0
U.S. (TOLL FREE)
+1 (315) 215-3225
Automative

0
U.S. (TOLL FREE)
+1 (315) 215-3225
Warehousing and Distribution Logistics Market By End Use (Healthcare, Manufacturing, Aerospace, Telecommunication, Government and public utilities, Banking and financial services, Retail, Media and entertainment, Trade and Transportation, Others), By Business Type (Warehouse, Distribution, Value added services), By Mode of operation (Storage, Roadways Distribution, Seaways Distribution, Others), By Type (Solution, Services): Global Opportunity Analysis and Industry Forecast, 2021-2031
Published Date: September 2022
|
Report Code: ALLI-Auto-1O817
Home | Market Reports | Business & Industrial| Transportation & Logistics
Warehousing and Distribution Logistics Market By End Use Healthcare Manufacturing Aerospace Telecommunication Government and public utilities Banking and financial services Retail Media and entertainment Trade and Transportation Others By Business Type Warehouse Distribution Value added services By Mode of operation Storage Roadways Distribution Seaways Distribution Others By Type Solution Services Global Opportunity Analysis and Industry Forecast 2021 2031
BUY CHAPTERS

Warehousing and Distribution Logistics Market By End Use (Healthcare, Manufacturing, Aerospace, Telecommunication, Government and public utilities, Banking and financial services, Retail, Media and entertainment, Trade and Transportation, Others), By Business Type (Warehouse, Distribution, Value added services), By Mode of operation (Storage, Roadways Distribution, Seaways Distribution, Others), By Type (Solution, Services): Global Opportunity Analysis and Industry Forecast, 2021-2031

Code: ALLI-Auto-1O817
Report
September 2022
Pages:424
Allied Market Research
Buy Now with 15% Discount
DESCRIPTION
TABLE OF CONTENT
TABLES & FIGURES

Warehousing and Distribution Logistics Market Size

According to a new report published by , titled, “Warehousing and Distribution Logistics Market," The warehousing and distribution logistics market was valued at $12,018.98 billion in 2021, and is estimated to reach $25,788.7 billion by 2031, growing at a CAGR of 7.7% from 2022 to 2031.

Warehousing and Distribution Logistics Market

Warehousing and Distribution Logistics Market

In 2021, Asia-Pacific is dominating the market in terms of revenue, followed by North America, Europe, and LAMEA. U.S. and China dominated the warehousing and distribution logistics market in 2021. The booming e-commerce industry in these economies is expected to drive the growth of the market. In addition, increased adoption of outsourced logistics services in the region is driving the growth of the market in Asia-Pacific. Moreover, high government support for development of logistics infrastructure in the region is also boosting the market growth.
The prominent key factors that drive the growth of the warehousing and distribution logistics market are increase in demand for warehousing and distribution logistics in e-commerce industry, increase in demand for refrigerated warehouses, and emergence of last mile deliveries coupled with logistics automation. The market economy is also responsible for the growth of the market. Countries such as China, India, Brazil, and South Africa are developing economies. Thus, the logistics sector witnesses prominent growth in these countries, which is expected to provide lucrative opportunities for the market. Also, in some undeveloped countries, there is an increase in the freight forwarding services, which is expected to boost the warehousing and distribution logistics market.
Warehousing and distribution logistics market is segmented basis of end use, business type, mode of operation, type and region. By end use, it is divided into healthcare, manufacturing, aerospace, telecommunication, government and public utilities, banking and financial services, retail, media and entertainment, trade and transportation and others. By business type, it is divided into warehouse, distribution, and value-added services. By mode of operation, it is segmented into storage, roadways distribution, seaways distribution, and others. By type, it is divided into solution, and services. By region, the market is analyzed across North America, Europe, Asia-Pacific and LAMEA.
COVID-19 Impact Analysis
The outbreak of COVID-19 has resulted in flight cancellations, travel bans, and quarantines, which made massive slowing of the supply chain and logistics activities across the world. Since the beginning of 2020, several countries across the globe shut down their borders and limited transportation & travel to contain the coronavirus (COVID-19) outbreak, thereby creating impediments for international trade & transportation. The pandemic affected almost every dimension of economic activity and individuals globally. As a consequence of the coronavirus outbreak, important supply chains in the logistics and transportation industry are hampered, though differently across air, freight, and sea sectors.
Although, there are some industries that are struggling due to the pandemic, but some are thriving such as healthcare & pharmaceuticals, e-commerce, and daily essentials goods industry, which are expected to affect the logistics industry positively during the COVID-19 outbreak globally. As B2B logistics industry suffered and came to a halt, B2C emerged during the pandemic, owing to the growth of online retail and e-commerce industry. Attributed to the lockdown and social distancing impact, the demand for online retailing has increased compared to offline retailing. In addition, there has been increasing demand for healthcare and FMCG supplies such as hospital supplies, gloves, sanitizers, vaccinations, and perishable food items, propelling the growth of the cold chain warehousing and logistics during the pandemic. For instance, according to new data from IBM’s U.S. Retail Index, the pandemic has accelerated the shift away from physical stores to digital shopping. In addition, according to the report from the U.S. Census Bureau 2020, the U.S. retail e-commerce industry reached $211.5 billion, up 31.8% from the first quarter of 2020 and 44.5% year-over-year. Such growth in online sales and logistics channels also create an opportunity for warehousing and distribution logistics market.
KEY FINDINGS OF THE STUDY
By end use, the healthcare segment is expected to register a significant growth during the forecast period.
By business type, the distribution segment is projected to lead the global warehousing and distribution logistics market
By mode of operation, the seaways distribution segment is projected to lead the global warehousing and distribution logistics market
By type, the solution segment is projected to lead the global warehousing and distribution logistics market
Region-wise, Asia-Pacific is anticipated to register the highest CAGR during the forecast period.
The key players that operate in this warehousing and distribution logistics market are Agility, Ceva Logistics, CJ Century Logistics, CWT Ltd., DB Schenker, DHL Supply Chain, Gemadept, Keppel Logistics, Kerry Logistic, Kuehne+Nagel, Singapore Post, Tiong Nam Logistics, WHA Corp., YCH Group, and Yusen Logistics.

Overview

Warehousing primarily refers to storage of goods, which is to be transported, whether inbound or outbound and is one of the major segments of the rapidly growing industry. Distribution logistics services consist of activities such as material handling, packaging, transportation, inventory, security, and warehousing, which can be scaled according to customer needs and market conditions. Distribution logistics service providers are responsible for the delivery of materials or goods from manufacturers to consumers. Growing demand in the logistics industry has broadened from basic transportation of goods to include end-to-end supply chain solutions including warehousing & express delivery.
The global logistics has experienced tremendous transformation in the past few years. The Covid-19 pandemic is making the shippers are focusing on using faster and cost-effective method of shipping the cargo which is expected to fuel the market for warehousing and distribution logistics. Moreover, the growth online sales owing to its ease is anticipated to fortify the demand for warehousing and distribution logistics up to a great degree during the forecast period.
Warehousing and distribution logistics market is segmented basis of end use, business type, mode of operation, type and region. Based on end use, it is divided into healthcare, manufacturing, aerospace, telecommunication, government and public utilities, banking and financial services, retail, media and entertainment, trade and transportation and others. Based on business type, it is divided into warehouse, distribution, and value-added services. Based on mode of operation, it is segmented into storage, roadways distribution, seaways distribution, and others. By type, it is divided into solution, and services. By region, the market is analyzed across North America, Europe, Asia-Pacific and LAMEA.
The growth drivers, restraints, and opportunities are explained in the report to better understand the market dynamics. This report further highlights key areas of investments. In addition, it includes Porter’s five forces analysis to understand competitive scenario of the industry and role of each stakeholder. The report features strategies adopted by key market players to maintain their foothold in the market. Furthermore, it highlights competitive landscape of key players to increase their market share and sustain intense competition in the industry.
The key players that operate in this market are Agility, Ceva Logistics, CJ Century Logistics, CWT Ltd., DB Schenker, DHL Supply Chain, Gemadept, Keppel Logistics, Kerry Logistic, Kuehne+Nagel, Singapore Post, Tiong Nam Logistics, WHA Corp., YCH Group, and Yusen Logistics.

Key Benefits For Stakeholders

●This report provides a quantitative analysis of the market segments, current trends, estimations, and dynamics of the warehousing and distribution logistics market analysis from 2021 to 2031 to identify the prevailing warehousing and distribution logistics market opportunities.
●The market research is offered along with information related to key drivers, restraints, and opportunities.
●Porter's five forces analysis highlights the potency of buyers and suppliers to enable stakeholders make profit-oriented business decisions and strengthen their supplier-buyer network.
●In-depth analysis of the warehousing and distribution logistics market segmentation assists to determine the prevailing market opportunities.
●Major countries in each region are mapped according to their revenue contribution to the global market.
●Market player positioning facilitates benchmarking and provides a clear understanding of the present position of the market players.
●The report includes the analysis of the regional as well as global warehousing and distribution logistics market trends, key players, market segments, application areas, and market growth strategies.
Key Market Segments
○ Yusen Logistic

Scope of Warehousing and Distribution Logistics Market Report

Report Metric Details
Report Name Warehousing and Distribution Logistics Market
Accounted market size in 2021 $ 12,018.98 in billion
Forecasted market size in 2031 $ 25,788.7 billion
CAGR 7.7%
Base Year 2021
Forecasted years 2024 - 2031
By End Use ● Healthcare
● Manufacturing
● Aerospace
● Telecommunication
● Government and public utilities
● Banking and financial services
● Retail
● Media and entertainment
● Trade and Transportation
● Others
By Business Type ● Warehouse
● Distribution
● Value added services
By Mode of operation ● Storage
● Roadways Distribution
● Seaways Distribution
● Others
By Type ● Solution
● Services
By Region
  • North America (United States, Canada)
  • Europe (Germany, France, UK, Italy, Russia) Rest of Europe
  • Nordic Countries
  • Asia-Pacific (China, Japan, South Korea)
  • Southeast Asia (India, Australia)
  • Rest of Asia
  • Latin America (Mexico, Brazil)
  • Rest of Latin America
  • Middle East & Africa (Turkey, Saudi Arabia, UAE, Rest of MEA)
Forecast units USD million in value
Report coverage Revenue and volume forecast, company share, competitive landscape, growth factors and trends

FAQ for this report

How fast is Warehousing and Distribution Logistics Market growing?

Ans: The Warehousing and Distribution Logistics Market witnessing a CAGR of 7.7% during the forecast period 2024-2031.

What is the Warehousing and Distribution Logistics Market size in 2031?

Ans: The Warehousing and Distribution Logistics Market size in 2031 will be $ 25,788.7 billion.

What are the Type segmentation covered in the Warehousing and Distribution Logistics Market report?

Ans: The Types covered in the Warehousing and Distribution Logistics Market report are ● Solution, ● Services

CHAPTER 1:INTRODUCTION
1.1.Report description
1.2.Key market segments
1.3.Key benefits to the stakeholders
1.4.Research Methodology
1.4.1.Secondary research
1.4.2.Primary research
1.4.3.Analyst tools and models
CHAPTER 2:EXECUTIVE SUMMARY
2.1.Key findings of the study
2.2.CXO Perspective
CHAPTER 3:MARKET OVERVIEW
3.1.Market definition and scope
3.2.Key findings
3.2.1.Top investment pockets
3.3.Porter’s five forces analysis
3.4.Top player positioning
3.5.Market dynamics
3.5.1.Drivers
3.5.2.Restraints
3.5.3.Opportunities
3.6.COVID-19 Impact Analysis on the market
CHAPTER 4: WAREHOUSING AND DISTRIBUTION LOGISTICS MARKET, BY END USE
4.1 Overview
4.1.1 Market size and forecast
4.2 Healthcare
4.2.1 Key market trends, growth factors and opportunities
4.2.2 Market size and forecast, by region
4.2.3 Market analysis by country
4.3 Manufacturing
4.3.1 Key market trends, growth factors and opportunities
4.3.2 Market size and forecast, by region
4.3.3 Market analysis by country
4.4 Aerospace
4.4.1 Key market trends, growth factors and opportunities
4.4.2 Market size and forecast, by region
4.4.3 Market analysis by country
4.5 Telecommunication
4.5.1 Key market trends, growth factors and opportunities
4.5.2 Market size and forecast, by region
4.5.3 Market analysis by country
4.6 Government and public utilities
4.6.1 Key market trends, growth factors and opportunities
4.6.2 Market size and forecast, by region
4.6.3 Market analysis by country
4.7 Banking and financial services
4.7.1 Key market trends, growth factors and opportunities
4.7.2 Market size and forecast, by region
4.7.3 Market analysis by country
4.8 Retail
4.8.1 Key market trends, growth factors and opportunities
4.8.2 Market size and forecast, by region
4.8.3 Market analysis by country
4.9 Media and entertainment
4.9.1 Key market trends, growth factors and opportunities
4.9.2 Market size and forecast, by region
4.9.3 Market analysis by country
5.0 Trade and Transportation
5.0.1 Key market trends, growth factors and opportunities
5.0.2 Market size and forecast, by region
5.0.3 Market analysis by country
5.1 Others
5.1.1 Key market trends, growth factors and opportunities
5.1.2 Market size and forecast, by region
5.1.3 Market analysis by country
CHAPTER 5: WAREHOUSING AND DISTRIBUTION LOGISTICS MARKET, BY BUSINESS TYPE
5.1 Overview
5.1.1 Market size and forecast
5.2 Warehouse
5.2.1 Key market trends, growth factors and opportunities
5.2.2 Market size and forecast, by region
5.2.3 Market analysis by country
5.3 Distribution
5.3.1 Key market trends, growth factors and opportunities
5.3.2 Market size and forecast, by region
5.3.3 Market analysis by country
5.4 Value added services
5.4.1 Key market trends, growth factors and opportunities
5.4.2 Market size and forecast, by region
5.4.3 Market analysis by country
CHAPTER 6: WAREHOUSING AND DISTRIBUTION LOGISTICS MARKET, BY MODE OF OPERATION
6.1 Overview
6.1.1 Market size and forecast
6.2 Storage
6.2.1 Key market trends, growth factors and opportunities
6.2.2 Market size and forecast, by region
6.2.3 Market analysis by country
6.3 Roadways Distribution
6.3.1 Key market trends, growth factors and opportunities
6.3.2 Market size and forecast, by region
6.3.3 Market analysis by country
6.4 Seaways Distribution
6.4.1 Key market trends, growth factors and opportunities
6.4.2 Market size and forecast, by region
6.4.3 Market analysis by country
6.5 Others
6.5.1 Key market trends, growth factors and opportunities
6.5.2 Market size and forecast, by region
6.5.3 Market analysis by country
CHAPTER 7: WAREHOUSING AND DISTRIBUTION LOGISTICS MARKET, BY TYPE
7.1 Overview
7.1.1 Market size and forecast
7.2 Solution
7.2.1 Key market trends, growth factors and opportunities
7.2.2 Market size and forecast, by region
7.2.3 Market analysis by country
7.3 Services
7.3.1 Key market trends, growth factors and opportunities
7.3.2 Market size and forecast, by region
7.3.3 Market analysis by country
CHAPTER 8: WAREHOUSING AND DISTRIBUTION LOGISTICS MARKET, BY REGION
8.1 Overview
8.1.1 Market size and forecast
8.2 North America
8.2.1 Key trends and opportunities
8.2.2 North America Market size and forecast, by End Use
8.2.3 North America Market size and forecast, by Business Type
8.2.4 North America Market size and forecast, by Mode of operation
8.2.5 North America Market size and forecast, by Type
8.2.6 North America Market size and forecast, by country
8.2.6.1 U.S.
8.2.6.1.1 Market size and forecast, by End Use
8.2.6.1.2 Market size and forecast, by Business Type
8.2.6.1.3 Market size and forecast, by Mode of operation
8.2.6.1.4 Market size and forecast, by Type
8.2.6.2 Canada
8.2.6.2.1 Market size and forecast, by End Use
8.2.6.2.2 Market size and forecast, by Business Type
8.2.6.2.3 Market size and forecast, by Mode of operation
8.2.6.2.4 Market size and forecast, by Type
8.2.6.3 Mexico
8.2.6.3.1 Market size and forecast, by End Use
8.2.6.3.2 Market size and forecast, by Business Type
8.2.6.3.3 Market size and forecast, by Mode of operation
8.2.6.3.4 Market size and forecast, by Type
8.3 Europe
8.3.1 Key trends and opportunities
8.3.2 Europe Market size and forecast, by End Use
8.3.3 Europe Market size and forecast, by Business Type
8.3.4 Europe Market size and forecast, by Mode of operation
8.3.5 Europe Market size and forecast, by Type
8.3.6 Europe Market size and forecast, by country
8.3.6.1 Germany
8.3.6.1.1 Market size and forecast, by End Use
8.3.6.1.2 Market size and forecast, by Business Type
8.3.6.1.3 Market size and forecast, by Mode of operation
8.3.6.1.4 Market size and forecast, by Type
8.3.6.2 France
8.3.6.2.1 Market size and forecast, by End Use
8.3.6.2.2 Market size and forecast, by Business Type
8.3.6.2.3 Market size and forecast, by Mode of operation
8.3.6.2.4 Market size and forecast, by Type
8.3.6.3 Russia
8.3.6.3.1 Market size and forecast, by End Use
8.3.6.3.2 Market size and forecast, by Business Type
8.3.6.3.3 Market size and forecast, by Mode of operation
8.3.6.3.4 Market size and forecast, by Type
8.3.6.4 Netherlands
8.3.6.4.1 Market size and forecast, by End Use
8.3.6.4.2 Market size and forecast, by Business Type
8.3.6.4.3 Market size and forecast, by Mode of operation
8.3.6.4.4 Market size and forecast, by Type
8.3.6.5 UK
8.3.6.5.1 Market size and forecast, by End Use
8.3.6.5.2 Market size and forecast, by Business Type
8.3.6.5.3 Market size and forecast, by Mode of operation
8.3.6.5.4 Market size and forecast, by Type
8.3.6.6 Poland
8.3.6.6.1 Market size and forecast, by End Use
8.3.6.6.2 Market size and forecast, by Business Type
8.3.6.6.3 Market size and forecast, by Mode of operation
8.3.6.6.4 Market size and forecast, by Type
8.3.6.7 Spain
8.3.6.7.1 Market size and forecast, by End Use
8.3.6.7.2 Market size and forecast, by Business Type
8.3.6.7.3 Market size and forecast, by Mode of operation
8.3.6.7.4 Market size and forecast, by Type
8.3.6.8 Rest of Europe
8.3.6.8.1 Market size and forecast, by End Use
8.3.6.8.2 Market size and forecast, by Business Type
8.3.6.8.3 Market size and forecast, by Mode of operation
8.3.6.8.4 Market size and forecast, by Type
8.4 Asia-Pacific
8.4.1 Key trends and opportunities
8.4.2 Asia-Pacific Market size and forecast, by End Use
8.4.3 Asia-Pacific Market size and forecast, by Business Type
8.4.4 Asia-Pacific Market size and forecast, by Mode of operation
8.4.5 Asia-Pacific Market size and forecast, by Type
8.4.6 Asia-Pacific Market size and forecast, by country
8.4.6.1 China
8.4.6.1.1 Market size and forecast, by End Use
8.4.6.1.2 Market size and forecast, by Business Type
8.4.6.1.3 Market size and forecast, by Mode of operation
8.4.6.1.4 Market size and forecast, by Type
8.4.6.2 India
8.4.6.2.1 Market size and forecast, by End Use
8.4.6.2.2 Market size and forecast, by Business Type
8.4.6.2.3 Market size and forecast, by Mode of operation
8.4.6.2.4 Market size and forecast, by Type
8.4.6.3 Japan
8.4.6.3.1 Market size and forecast, by End Use
8.4.6.3.2 Market size and forecast, by Business Type
8.4.6.3.3 Market size and forecast, by Mode of operation
8.4.6.3.4 Market size and forecast, by Type
8.4.6.4 South Korea
8.4.6.4.1 Market size and forecast, by End Use
8.4.6.4.2 Market size and forecast, by Business Type
8.4.6.4.3 Market size and forecast, by Mode of operation
8.4.6.4.4 Market size and forecast, by Type
8.4.6.5 Asean
8.4.6.5.1 Market size and forecast, by End Use
8.4.6.5.2 Market size and forecast, by Business Type
8.4.6.5.3 Market size and forecast, by Mode of operation
8.4.6.5.4 Market size and forecast, by Type
8.4.6.6 Rest of Asia-Pacific
8.4.6.6.1 Market size and forecast, by End Use
8.4.6.6.2 Market size and forecast, by Business Type
8.4.6.6.3 Market size and forecast, by Mode of operation
8.4.6.6.4 Market size and forecast, by Type
8.5 LAMEA
8.5.1 Key trends and opportunities
8.5.2 LAMEA Market size and forecast, by End Use
8.5.3 LAMEA Market size and forecast, by Business Type
8.5.4 LAMEA Market size and forecast, by Mode of operation
8.5.5 LAMEA Market size and forecast, by Type
8.5.6 LAMEA Market size and forecast, by country
8.5.6.1 Brazil
8.5.6.1.1 Market size and forecast, by End Use
8.5.6.1.2 Market size and forecast, by Business Type
8.5.6.1.3 Market size and forecast, by Mode of operation
8.5.6.1.4 Market size and forecast, by Type
8.5.6.2 UAE
8.5.6.2.1 Market size and forecast, by End Use
8.5.6.2.2 Market size and forecast, by Business Type
8.5.6.2.3 Market size and forecast, by Mode of operation
8.5.6.2.4 Market size and forecast, by Type
8.5.6.3 Saudi Arabia
8.5.6.3.1 Market size and forecast, by End Use
8.5.6.3.2 Market size and forecast, by Business Type
8.5.6.3.3 Market size and forecast, by Mode of operation
8.5.6.3.4 Market size and forecast, by Type
8.5.6.4 South Africa
8.5.6.4.1 Market size and forecast, by End Use
8.5.6.4.2 Market size and forecast, by Business Type
8.5.6.4.3 Market size and forecast, by Mode of operation
8.5.6.4.4 Market size and forecast, by Type
8.5.6.5 Rest of LAMEA
8.5.6.5.1 Market size and forecast, by End Use
8.5.6.5.2 Market size and forecast, by Business Type
8.5.6.5.3 Market size and forecast, by Mode of operation
8.5.6.5.4 Market size and forecast, by Type
CHAPTER 9: COMPANY LANDSCAPE
9.1. Introduction
9.2. Top winning strategies
9.3. Product Mapping of Top 10 Player
9.4. Competitive Dashboard
9.5. Competitive Heatmap
9.6. Key developments
CHAPTER 10: COMPANY PROFILES
10.1 AGILITY
10.1.1 Company overview
10.1.2 Company snapshot
10.1.3 Operating business segments
10.1.4 Product portfolio
10.1.5 Business performance
10.1.6 Key strategic moves and developments
10.2 CEVA LOGISTICS
10.2.1 Company overview
10.2.2 Company snapshot
10.2.3 Operating business segments
10.2.4 Product portfolio
10.2.5 Business performance
10.2.6 Key strategic moves and developments
10.3 CJ Century Logistics
10.3.1 Company overview
10.3.2 Company snapshot
10.3.3 Operating business segments
10.3.4 Product portfolio
10.3.5 Business performance
10.3.6 Key strategic moves and developments
10.4 CWT Ltd
10.4.1 Company overview
10.4.2 Company snapshot
10.4.3 Operating business segments
10.4.4 Product portfolio
10.4.5 Business performance
10.4.6 Key strategic moves and developments
10.5 DB Schenker
10.5.1 Company overview
10.5.2 Company snapshot
10.5.3 Operating business segments
10.5.4 Product portfolio
10.5.5 Business performance
10.5.6 Key strategic moves and developments
10.6 DHL Supply Chain
10.6.1 Company overview
10.6.2 Company snapshot
10.6.3 Operating business segments
10.6.4 Product portfolio
10.6.5 Business performance
10.6.6 Key strategic moves and developments
10.7 Gemadept
10.7.1 Company overview
10.7.2 Company snapshot
10.7.3 Operating business segments
10.7.4 Product portfolio
10.7.5 Business performance
10.7.6 Key strategic moves and developments
10.8 Keppel Logistics
10.8.1 Company overview
10.8.2 Company snapshot
10.8.3 Operating business segments
10.8.4 Product portfolio
10.8.5 Business performance
10.8.6 Key strategic moves and developments
10.9 Kerry Logistics
10.9.1 Company overview
10.9.2 Company snapshot
10.9.3 Operating business segments
10.9.4 Product portfolio
10.9.5 Business performance
10.9.6 Key strategic moves and developments
10.10 Kuehne + Nagel
10.10.1 Company overview
10.10.2 Company snapshot
10.10.3 Operating business segments
10.10.4 Product portfolio
10.10.5 Business performance
10.10.6 Key strategic moves and developments
10.11 Singapore Post
10.11.1 Company overview
10.11.2 Company snapshot
10.11.3 Operating business segments
10.11.4 Product portfolio
10.11.5 Business performance
10.11.6 Key strategic moves and developments
10.12 Tiong Nam Logistics
10.12.1 Company overview
10.12.2 Company snapshot
10.12.3 Operating business segments
10.12.4 Product portfolio
10.12.5 Business performance
10.12.6 Key strategic moves and developments
10.13 WHA Corp
10.13.1 Company overview
10.13.2 Company snapshot
10.13.3 Operating business segments
10.13.4 Product portfolio
10.13.5 Business performance
10.13.6 Key strategic moves and developments
10.14 Ych Group
10.14.1 Company overview
10.14.2 Company snapshot
10.14.3 Operating business segments
10.14.4 Product portfolio
10.14.5 Business performance
10.14.6 Key strategic moves and developments
10.15 Yusen Logistics
10.15.1 Company overview
10.15.2 Company snapshot
10.15.3 Operating business segments
10.15.4 Product portfolio
10.15.5 Business performance
10.15.6 Key strategic moves and development
LIST OF TABLES
TABLE 1. GLOBAL WAREHOUSING AND DISTRIBUTION LOGISTICS MARKET, BY END USE, 2021-2031 ($BILLION)
TABLE 2. WAREHOUSING AND DISTRIBUTION LOGISTICS MARKET, FOR HEALTHCARE, BY REGION, 2021-2031 ($BILLION)
TABLE 3. WAREHOUSING AND DISTRIBUTION LOGISTICS MARKET FOR HEALTHCARE, BY COUNTRY, 2021-2031 ($BILLION)
TABLE 4. WAREHOUSING AND DISTRIBUTION LOGISTICS MARKET, FOR MANUFACTURING, BY REGION, 2021-2031 ($BILLION)
TABLE 5. WAREHOUSING AND DISTRIBUTION LOGISTICS MARKET FOR MANUFACTURING, BY COUNTRY, 2021-2031 ($BILLION)
TABLE 6. WAREHOUSING AND DISTRIBUTION LOGISTICS MARKET, FOR AEROSPACE, BY REGION, 2021-2031 ($BILLION)
TABLE 7. WAREHOUSING AND DISTRIBUTION LOGISTICS MARKET FOR AEROSPACE, BY COUNTRY, 2021-2031 ($BILLION)
TABLE 8. WAREHOUSING AND DISTRIBUTION LOGISTICS MARKET, FOR TELECOMMUNICATION, BY REGION, 2021-2031 ($BILLION)
TABLE 9. WAREHOUSING AND DISTRIBUTION LOGISTICS MARKET FOR TELECOMMUNICATION, BY COUNTRY, 2021-2031 ($BILLION)
TABLE 10. WAREHOUSING AND DISTRIBUTION LOGISTICS MARKET, FOR GOVERNMENT AND PUBLIC UTILITIES, BY REGION, 2021-2031 ($BILLION)
TABLE 11. WAREHOUSING AND DISTRIBUTION LOGISTICS MARKET FOR GOVERNMENT AND PUBLIC UTILITIES, BY COUNTRY, 2021-2031 ($BILLION)
TABLE 12. WAREHOUSING AND DISTRIBUTION LOGISTICS MARKET, FOR BANKING AND FINANCIAL SERVICES, BY REGION, 2021-2031 ($BILLION)
TABLE 13. WAREHOUSING AND DISTRIBUTION LOGISTICS MARKET FOR BANKING AND FINANCIAL SERVICES, BY COUNTRY, 2021-2031 ($BILLION)
TABLE 14. WAREHOUSING AND DISTRIBUTION LOGISTICS MARKET, FOR RETAIL, BY REGION, 2021-2031 ($BILLION)
TABLE 15. WAREHOUSING AND DISTRIBUTION LOGISTICS MARKET FOR RETAIL, BY COUNTRY, 2021-2031 ($BILLION)
TABLE 16. WAREHOUSING AND DISTRIBUTION LOGISTICS MARKET, FOR MEDIA AND ENTERTAINMENT, BY REGION, 2021-2031 ($BILLION)
TABLE 17. WAREHOUSING AND DISTRIBUTION LOGISTICS MARKET FOR MEDIA AND ENTERTAINMENT, BY COUNTRY, 2021-2031 ($BILLION)
TABLE 18. WAREHOUSING AND DISTRIBUTION LOGISTICS MARKET, FOR TRADE AND TRANSPORTATION, BY REGION, 2021-2031 ($BILLION)
TABLE 19. WAREHOUSING AND DISTRIBUTION LOGISTICS MARKET FOR TRADE AND TRANSPORTATION, BY COUNTRY, 2021-2031 ($BILLION)
TABLE 20. WAREHOUSING AND DISTRIBUTION LOGISTICS MARKET, FOR OTHERS, BY REGION, 2021-2031 ($BILLION)
TABLE 21. WAREHOUSING AND DISTRIBUTION LOGISTICS MARKET FOR OTHERS, BY COUNTRY, 2021-2031 ($BILLION)
TABLE 22. GLOBAL WAREHOUSING AND DISTRIBUTION LOGISTICS MARKET, BY BUSINESS TYPE, 2021-2031 ($BILLION)
TABLE 23. WAREHOUSING AND DISTRIBUTION LOGISTICS MARKET, FOR WAREHOUSE, BY REGION, 2021-2031 ($BILLION)
TABLE 24. WAREHOUSING AND DISTRIBUTION LOGISTICS MARKET FOR WAREHOUSE, BY COUNTRY, 2021-2031 ($BILLION)
TABLE 25. WAREHOUSING AND DISTRIBUTION LOGISTICS MARKET, FOR DISTRIBUTION, BY REGION, 2021-2031 ($BILLION)
TABLE 26. WAREHOUSING AND DISTRIBUTION LOGISTICS MARKET FOR DISTRIBUTION, BY COUNTRY, 2021-2031 ($BILLION)
TABLE 27. WAREHOUSING AND DISTRIBUTION LOGISTICS MARKET, FOR VALUE ADDED SERVICES, BY REGION, 2021-2031 ($BILLION)
TABLE 28. WAREHOUSING AND DISTRIBUTION LOGISTICS MARKET FOR VALUE ADDED SERVICES, BY COUNTRY, 2021-2031 ($BILLION)
TABLE 29. GLOBAL WAREHOUSING AND DISTRIBUTION LOGISTICS MARKET, BY MODE OF OPERATION, 2021-2031 ($BILLION)
TABLE 30. WAREHOUSING AND DISTRIBUTION LOGISTICS MARKET, FOR STORAGE, BY REGION, 2021-2031 ($BILLION)
TABLE 31. WAREHOUSING AND DISTRIBUTION LOGISTICS MARKET FOR STORAGE, BY COUNTRY, 2021-2031 ($BILLION)
TABLE 32. WAREHOUSING AND DISTRIBUTION LOGISTICS MARKET, FOR ROADWAYS DISTRIBUTION, BY REGION, 2021-2031 ($BILLION)
TABLE 33. WAREHOUSING AND DISTRIBUTION LOGISTICS MARKET FOR ROADWAYS DISTRIBUTION, BY COUNTRY, 2021-2031 ($BILLION)
TABLE 34. WAREHOUSING AND DISTRIBUTION LOGISTICS MARKET, FOR SEAWAYS DISTRIBUTION, BY REGION, 2021-2031 ($BILLION)
TABLE 35. WAREHOUSING AND DISTRIBUTION LOGISTICS MARKET FOR SEAWAYS DISTRIBUTION, BY COUNTRY, 2021-2031 ($BILLION)
TABLE 36. WAREHOUSING AND DISTRIBUTION LOGISTICS MARKET, FOR OTHERS, BY REGION, 2021-2031 ($BILLION)
TABLE 37. WAREHOUSING AND DISTRIBUTION LOGISTICS MARKET FOR OTHERS, BY COUNTRY, 2021-2031 ($BILLION)
TABLE 38. GLOBAL WAREHOUSING AND DISTRIBUTION LOGISTICS MARKET, BY TYPE, 2021-2031 ($BILLION)
TABLE 39. WAREHOUSING AND DISTRIBUTION LOGISTICS MARKET, FOR SOLUTION, BY REGION, 2021-2031 ($BILLION)
TABLE 40. WAREHOUSING AND DISTRIBUTION LOGISTICS MARKET FOR SOLUTION, BY COUNTRY, 2021-2031 ($BILLION)
TABLE 41. WAREHOUSING AND DISTRIBUTION LOGISTICS MARKET, FOR SERVICES, BY REGION, 2021-2031 ($BILLION)
TABLE 42. WAREHOUSING AND DISTRIBUTION LOGISTICS MARKET FOR SERVICES, BY COUNTRY, 2021-2031 ($BILLION)
TABLE 43. WAREHOUSING AND DISTRIBUTION LOGISTICS MARKET, BY REGION, 2021-2031 ($BILLION)
TABLE 44. NORTH AMERICA WAREHOUSING AND DISTRIBUTION LOGISTICS MARKET, BY END USE, 2021-2031 ($BILLION)
TABLE 45. NORTH AMERICA WAREHOUSING AND DISTRIBUTION LOGISTICS MARKET, BY BUSINESS TYPE, 2021-2031 ($BILLION)
TABLE 46. NORTH AMERICA WAREHOUSING AND DISTRIBUTION LOGISTICS MARKET, BY MODE OF OPERATION, 2021-2031 ($BILLION)
TABLE 47. NORTH AMERICA WAREHOUSING AND DISTRIBUTION LOGISTICS MARKET, BY TYPE, 2021-2031 ($BILLION)
TABLE 48. NORTH AMERICA WAREHOUSING AND DISTRIBUTION LOGISTICS MARKET, BY COUNTRY, 2021-2031 ($BILLION)
TABLE 49. U.S. WAREHOUSING AND DISTRIBUTION LOGISTICS MARKET, BY END USE, 2021-2031 ($BILLION)
TABLE 50. U.S. WAREHOUSING AND DISTRIBUTION LOGISTICS MARKET, BY BUSINESS TYPE, 2021-2031 ($BILLION)
TABLE 51. U.S. WAREHOUSING AND DISTRIBUTION LOGISTICS MARKET, BY MODE OF OPERATION, 2021-2031 ($BILLION)
TABLE 52. U.S. WAREHOUSING AND DISTRIBUTION LOGISTICS MARKET, BY TYPE, 2021-2031 ($BILLION)
TABLE 53. CANADA WAREHOUSING AND DISTRIBUTION LOGISTICS MARKET, BY END USE, 2021-2031 ($BILLION)
TABLE 54. CANADA WAREHOUSING AND DISTRIBUTION LOGISTICS MARKET, BY BUSINESS TYPE, 2021-2031 ($BILLION)
TABLE 55. CANADA WAREHOUSING AND DISTRIBUTION LOGISTICS MARKET, BY MODE OF OPERATION, 2021-2031 ($BILLION)
TABLE 56. CANADA WAREHOUSING AND DISTRIBUTION LOGISTICS MARKET, BY TYPE, 2021-2031 ($BILLION)
TABLE 57. MEXICO WAREHOUSING AND DISTRIBUTION LOGISTICS MARKET, BY END USE, 2021-2031 ($BILLION)
TABLE 58. MEXICO WAREHOUSING AND DISTRIBUTION LOGISTICS MARKET, BY BUSINESS TYPE, 2021-2031 ($BILLION)
TABLE 59. MEXICO WAREHOUSING AND DISTRIBUTION LOGISTICS MARKET, BY MODE OF OPERATION, 2021-2031 ($BILLION)
TABLE 60. MEXICO WAREHOUSING AND DISTRIBUTION LOGISTICS MARKET, BY TYPE, 2021-2031 ($BILLION)
TABLE 61. EUROPE WAREHOUSING AND DISTRIBUTION LOGISTICS MARKET, BY END USE, 2021-2031 ($BILLION)
TABLE 62. EUROPE WAREHOUSING AND DISTRIBUTION LOGISTICS MARKET, BY BUSINESS TYPE, 2021-2031 ($BILLION)
TABLE 63. EUROPE WAREHOUSING AND DISTRIBUTION LOGISTICS MARKET, BY MODE OF OPERATION, 2021-2031 ($BILLION)
TABLE 64. EUROPE WAREHOUSING AND DISTRIBUTION LOGISTICS MARKET, BY TYPE, 2021-2031 ($BILLION)
TABLE 65. EUROPE WAREHOUSING AND DISTRIBUTION LOGISTICS MARKET, BY COUNTRY, 2021-2031 ($BILLION)
TABLE 66. GERMANY WAREHOUSING AND DISTRIBUTION LOGISTICS MARKET, BY END USE, 2021-2031 ($BILLION)
TABLE 67. GERMANY WAREHOUSING AND DISTRIBUTION LOGISTICS MARKET, BY BUSINESS TYPE, 2021-2031 ($BILLION)
TABLE 68. GERMANY WAREHOUSING AND DISTRIBUTION LOGISTICS MARKET, BY MODE OF OPERATION, 2021-2031 ($BILLION)
TABLE 69. GERMANY WAREHOUSING AND DISTRIBUTION LOGISTICS MARKET, BY TYPE, 2021-2031 ($BILLION)
TABLE 70. FRANCE WAREHOUSING AND DISTRIBUTION LOGISTICS MARKET, BY END USE, 2021-2031 ($BILLION)
TABLE 71. FRANCE WAREHOUSING AND DISTRIBUTION LOGISTICS MARKET, BY BUSINESS TYPE, 2021-2031 ($BILLION)
TABLE 72. FRANCE WAREHOUSING AND DISTRIBUTION LOGISTICS MARKET, BY MODE OF OPERATION, 2021-2031 ($BILLION)
TABLE 73. FRANCE WAREHOUSING AND DISTRIBUTION LOGISTICS MARKET, BY TYPE, 2021-2031 ($BILLION)
TABLE 74. RUSSIA WAREHOUSING AND DISTRIBUTION LOGISTICS MARKET, BY END USE, 2021-2031 ($BILLION)
TABLE 75. RUSSIA WAREHOUSING AND DISTRIBUTION LOGISTICS MARKET, BY BUSINESS TYPE, 2021-2031 ($BILLION)
TABLE 76. RUSSIA WAREHOUSING AND DISTRIBUTION LOGISTICS MARKET, BY MODE OF OPERATION, 2021-2031 ($BILLION)
TABLE 77. RUSSIA WAREHOUSING AND DISTRIBUTION LOGISTICS MARKET, BY TYPE, 2021-2031 ($BILLION)
TABLE 78. NETHERLANDS WAREHOUSING AND DISTRIBUTION LOGISTICS MARKET, BY END USE, 2021-2031 ($BILLION)
TABLE 79. NETHERLANDS WAREHOUSING AND DISTRIBUTION LOGISTICS MARKET, BY BUSINESS TYPE, 2021-2031 ($BILLION)
TABLE 80. NETHERLANDS WAREHOUSING AND DISTRIBUTION LOGISTICS MARKET, BY MODE OF OPERATION, 2021-2031 ($BILLION)
TABLE 81. NETHERLANDS WAREHOUSING AND DISTRIBUTION LOGISTICS MARKET, BY TYPE, 2021-2031 ($BILLION)
TABLE 82. UK WAREHOUSING AND DISTRIBUTION LOGISTICS MARKET, BY END USE, 2021-2031 ($BILLION)
TABLE 83. UK WAREHOUSING AND DISTRIBUTION LOGISTICS MARKET, BY BUSINESS TYPE, 2021-2031 ($BILLION)
TABLE 84. UK WAREHOUSING AND DISTRIBUTION LOGISTICS MARKET, BY MODE OF OPERATION, 2021-2031 ($BILLION)
TABLE 85. UK WAREHOUSING AND DISTRIBUTION LOGISTICS MARKET, BY TYPE, 2021-2031 ($BILLION)
TABLE 86. POLAND WAREHOUSING AND DISTRIBUTION LOGISTICS MARKET, BY END USE, 2021-2031 ($BILLION)
TABLE 87. POLAND WAREHOUSING AND DISTRIBUTION LOGISTICS MARKET, BY BUSINESS TYPE, 2021-2031 ($BILLION)
TABLE 88. POLAND WAREHOUSING AND DISTRIBUTION LOGISTICS MARKET, BY MODE OF OPERATION, 2021-2031 ($BILLION)
TABLE 89. POLAND WAREHOUSING AND DISTRIBUTION LOGISTICS MARKET, BY TYPE, 2021-2031 ($BILLION)
TABLE 90. SPAIN WAREHOUSING AND DISTRIBUTION LOGISTICS MARKET, BY END USE, 2021-2031 ($BILLION)
TABLE 91. SPAIN WAREHOUSING AND DISTRIBUTION LOGISTICS MARKET, BY BUSINESS TYPE, 2021-2031 ($BILLION)
TABLE 92. SPAIN WAREHOUSING AND DISTRIBUTION LOGISTICS MARKET, BY MODE OF OPERATION, 2021-2031 ($BILLION)
TABLE 93. SPAIN WAREHOUSING AND DISTRIBUTION LOGISTICS MARKET, BY TYPE, 2021-2031 ($BILLION)
TABLE 94. REST OF EUROPE WAREHOUSING AND DISTRIBUTION LOGISTICS MARKET, BY END USE, 2021-2031 ($BILLION)
TABLE 95. REST OF EUROPE WAREHOUSING AND DISTRIBUTION LOGISTICS MARKET, BY BUSINESS TYPE, 2021-2031 ($BILLION)
TABLE 96. REST OF EUROPE WAREHOUSING AND DISTRIBUTION LOGISTICS MARKET, BY MODE OF OPERATION, 2021-2031 ($BILLION)
TABLE 97. REST OF EUROPE WAREHOUSING AND DISTRIBUTION LOGISTICS MARKET, BY TYPE, 2021-2031 ($BILLION)
TABLE 98. ASIA-PACIFIC WAREHOUSING AND DISTRIBUTION LOGISTICS MARKET, BY END USE, 2021-2031 ($BILLION)
TABLE 99. ASIA-PACIFIC WAREHOUSING AND DISTRIBUTION LOGISTICS MARKET, BY BUSINESS TYPE, 2021-2031 ($BILLION)
TABLE 100. ASIA-PACIFIC WAREHOUSING AND DISTRIBUTION LOGISTICS MARKET, BY MODE OF OPERATION, 2021-2031 ($BILLION)
TABLE 101. ASIA-PACIFIC WAREHOUSING AND DISTRIBUTION LOGISTICS MARKET, BY TYPE, 2021-2031 ($BILLION)
TABLE 102. ASIA-PACIFIC WAREHOUSING AND DISTRIBUTION LOGISTICS MARKET, BY COUNTRY, 2021-2031 ($BILLION)
TABLE 103. CHINA WAREHOUSING AND DISTRIBUTION LOGISTICS MARKET, BY END USE, 2021-2031 ($BILLION)
TABLE 104. CHINA WAREHOUSING AND DISTRIBUTION LOGISTICS MARKET, BY BUSINESS TYPE, 2021-2031 ($BILLION)
TABLE 105. CHINA WAREHOUSING AND DISTRIBUTION LOGISTICS MARKET, BY MODE OF OPERATION, 2021-2031 ($BILLION)
TABLE 106. CHINA WAREHOUSING AND DISTRIBUTION LOGISTICS MARKET, BY TYPE, 2021-2031 ($BILLION)
TABLE 107. INDIA WAREHOUSING AND DISTRIBUTION LOGISTICS MARKET, BY END USE, 2021-2031 ($BILLION)
TABLE 108. INDIA WAREHOUSING AND DISTRIBUTION LOGISTICS MARKET, BY BUSINESS TYPE, 2021-2031 ($BILLION)
TABLE 109. INDIA WAREHOUSING AND DISTRIBUTION LOGISTICS MARKET, BY MODE OF OPERATION, 2021-2031 ($BILLION)
TABLE 110. INDIA WAREHOUSING AND DISTRIBUTION LOGISTICS MARKET, BY TYPE, 2021-2031 ($BILLION)
TABLE 111. JAPAN WAREHOUSING AND DISTRIBUTION LOGISTICS MARKET, BY END USE, 2021-2031 ($BILLION)
TABLE 112. JAPAN WAREHOUSING AND DISTRIBUTION LOGISTICS MARKET, BY BUSINESS TYPE, 2021-2031 ($BILLION)
TABLE 113. JAPAN WAREHOUSING AND DISTRIBUTION LOGISTICS MARKET, BY MODE OF OPERATION, 2021-2031 ($BILLION)
TABLE 114. JAPAN WAREHOUSING AND DISTRIBUTION LOGISTICS MARKET, BY TYPE, 2021-2031 ($BILLION)
TABLE 115. SOUTH KOREA WAREHOUSING AND DISTRIBUTION LOGISTICS MARKET, BY END USE, 2021-2031 ($BILLION)
TABLE 116. SOUTH KOREA WAREHOUSING AND DISTRIBUTION LOGISTICS MARKET, BY BUSINESS TYPE, 2021-2031 ($BILLION)
TABLE 117. SOUTH KOREA WAREHOUSING AND DISTRIBUTION LOGISTICS MARKET, BY MODE OF OPERATION, 2021-2031 ($BILLION)
TABLE 118. SOUTH KOREA WAREHOUSING AND DISTRIBUTION LOGISTICS MARKET, BY TYPE, 2021-2031 ($BILLION)
TABLE 119. ASEAN WAREHOUSING AND DISTRIBUTION LOGISTICS MARKET, BY END USE, 2021-2031 ($BILLION)
TABLE 120. ASEAN WAREHOUSING AND DISTRIBUTION LOGISTICS MARKET, BY BUSINESS TYPE, 2021-2031 ($BILLION)
TABLE 121. ASEAN WAREHOUSING AND DISTRIBUTION LOGISTICS MARKET, BY MODE OF OPERATION, 2021-2031 ($BILLION)
TABLE 122. ASEAN WAREHOUSING AND DISTRIBUTION LOGISTICS MARKET, BY TYPE, 2021-2031 ($BILLION)
TABLE 123. REST OF ASIA-PACIFIC WAREHOUSING AND DISTRIBUTION LOGISTICS MARKET, BY END USE, 2021-2031 ($BILLION)
TABLE 124. REST OF ASIA-PACIFIC WAREHOUSING AND DISTRIBUTION LOGISTICS MARKET, BY BUSINESS TYPE, 2021-2031 ($BILLION)
TABLE 125. REST OF ASIA-PACIFIC WAREHOUSING AND DISTRIBUTION LOGISTICS MARKET, BY MODE OF OPERATION, 2021-2031 ($BILLION)
TABLE 126. REST OF ASIA-PACIFIC WAREHOUSING AND DISTRIBUTION LOGISTICS MARKET, BY TYPE, 2021-2031 ($BILLION)
TABLE 127. LAMEA WAREHOUSING AND DISTRIBUTION LOGISTICS MARKET, BY END USE, 2021-2031 ($BILLION)
TABLE 128. LAMEA WAREHOUSING AND DISTRIBUTION LOGISTICS MARKET, BY BUSINESS TYPE, 2021-2031 ($BILLION)
TABLE 129. LAMEA WAREHOUSING AND DISTRIBUTION LOGISTICS MARKET, BY MODE OF OPERATION, 2021-2031 ($BILLION)
TABLE 130. LAMEA WAREHOUSING AND DISTRIBUTION LOGISTICS MARKET, BY TYPE, 2021-2031 ($BILLION)
TABLE 131. LAMEA WAREHOUSING AND DISTRIBUTION LOGISTICS MARKET, BY COUNTRY, 2021-2031 ($BILLION)
TABLE 132. BRAZIL WAREHOUSING AND DISTRIBUTION LOGISTICS MARKET, BY END USE, 2021-2031 ($BILLION)
TABLE 133. BRAZIL WAREHOUSING AND DISTRIBUTION LOGISTICS MARKET, BY BUSINESS TYPE, 2021-2031 ($BILLION)
TABLE 134. BRAZIL WAREHOUSING AND DISTRIBUTION LOGISTICS MARKET, BY MODE OF OPERATION, 2021-2031 ($BILLION)
TABLE 135. BRAZIL WAREHOUSING AND DISTRIBUTION LOGISTICS MARKET, BY TYPE, 2021-2031 ($BILLION)
TABLE 136. UAE WAREHOUSING AND DISTRIBUTION LOGISTICS MARKET, BY END USE, 2021-2031 ($BILLION)
TABLE 137. UAE WAREHOUSING AND DISTRIBUTION LOGISTICS MARKET, BY BUSINESS TYPE, 2021-2031 ($BILLION)
TABLE 138. UAE WAREHOUSING AND DISTRIBUTION LOGISTICS MARKET, BY MODE OF OPERATION, 2021-2031 ($BILLION)
TABLE 139. UAE WAREHOUSING AND DISTRIBUTION LOGISTICS MARKET, BY TYPE, 2021-2031 ($BILLION)
TABLE 140. SAUDI ARABIA WAREHOUSING AND DISTRIBUTION LOGISTICS MARKET, BY END USE, 2021-2031 ($BILLION)
TABLE 141. SAUDI ARABIA WAREHOUSING AND DISTRIBUTION LOGISTICS MARKET, BY BUSINESS TYPE, 2021-2031 ($BILLION)
TABLE 142. SAUDI ARABIA WAREHOUSING AND DISTRIBUTION LOGISTICS MARKET, BY MODE OF OPERATION, 2021-2031 ($BILLION)
TABLE 143. SAUDI ARABIA WAREHOUSING AND DISTRIBUTION LOGISTICS MARKET, BY TYPE, 2021-2031 ($BILLION)
TABLE 144. SOUTH AFRICA WAREHOUSING AND DISTRIBUTION LOGISTICS MARKET, BY END USE, 2021-2031 ($BILLION)
TABLE 145. SOUTH AFRICA WAREHOUSING AND DISTRIBUTION LOGISTICS MARKET, BY BUSINESS TYPE, 2021-2031 ($BILLION)
TABLE 146. SOUTH AFRICA WAREHOUSING AND DISTRIBUTION LOGISTICS MARKET, BY MODE OF OPERATION, 2021-2031 ($BILLION)
TABLE 147. SOUTH AFRICA WAREHOUSING AND DISTRIBUTION LOGISTICS MARKET, BY TYPE, 2021-2031 ($BILLION)
TABLE 148. REST OF LAMEA WAREHOUSING AND DISTRIBUTION LOGISTICS MARKET, BY END USE, 2021-2031 ($BILLION)
TABLE 149. REST OF LAMEA WAREHOUSING AND DISTRIBUTION LOGISTICS MARKET, BY BUSINESS TYPE, 2021-2031 ($BILLION)
TABLE 150. REST OF LAMEA WAREHOUSING AND DISTRIBUTION LOGISTICS MARKET, BY MODE OF OPERATION, 2021-2031 ($BILLION)
TABLE 151. REST OF LAMEA WAREHOUSING AND DISTRIBUTION LOGISTICS MARKET, BY TYPE, 2021-2031 ($BILLION)
TABLE 152.AGILITY: COMPANY SNAPSHOT
TABLE 153.AGILITY: OPERATING SEGMENTS
TABLE 154.AGILITY: PRODUCT PORTFOLIO
TABLE 155.AGILITY: NET SALES,
TABLE 156.AGILITY: KEY STRATERGIES
TABLE 157.CEVA LOGISTICS: COMPANY SNAPSHOT
TABLE 158.CEVA LOGISTICS: OPERATING SEGMENTS
TABLE 159.CEVA LOGISTICS: PRODUCT PORTFOLIO
TABLE 160.CEVA LOGISTICS: NET SALES,
TABLE 161.CEVA LOGISTICS: KEY STRATERGIES
TABLE 162.CJ CENTURY LOGISTICS: COMPANY SNAPSHOT
TABLE 163.CJ CENTURY LOGISTICS: OPERATING SEGMENTS
TABLE 164.CJ CENTURY LOGISTICS: PRODUCT PORTFOLIO
TABLE 165.CJ CENTURY LOGISTICS: NET SALES,
TABLE 166.CJ CENTURY LOGISTICS: KEY STRATERGIES
TABLE 167.CWT LTD: COMPANY SNAPSHOT
TABLE 168.CWT LTD: OPERATING SEGMENTS
TABLE 169.CWT LTD: PRODUCT PORTFOLIO
TABLE 170.CWT LTD: NET SALES,
TABLE 171.CWT LTD: KEY STRATERGIES
TABLE 172.DB SCHENKER: COMPANY SNAPSHOT
TABLE 173.DB SCHENKER: OPERATING SEGMENTS
TABLE 174.DB SCHENKER: PRODUCT PORTFOLIO
TABLE 175.DB SCHENKER: NET SALES,
TABLE 176.DB SCHENKER: KEY STRATERGIES
TABLE 177.DHL SUPPLY CHAIN: COMPANY SNAPSHOT
TABLE 178.DHL SUPPLY CHAIN: OPERATING SEGMENTS
TABLE 179.DHL SUPPLY CHAIN: PRODUCT PORTFOLIO
TABLE 180.DHL SUPPLY CHAIN: NET SALES,
TABLE 181.DHL SUPPLY CHAIN: KEY STRATERGIES
TABLE 182.GEMADEPT: COMPANY SNAPSHOT
TABLE 183.GEMADEPT: OPERATING SEGMENTS
TABLE 184.GEMADEPT: PRODUCT PORTFOLIO
TABLE 185.GEMADEPT: NET SALES,
TABLE 186.GEMADEPT: KEY STRATERGIES
TABLE 187.KEPPEL LOGISTICS: COMPANY SNAPSHOT
TABLE 188.KEPPEL LOGISTICS: OPERATING SEGMENTS
TABLE 189.KEPPEL LOGISTICS: PRODUCT PORTFOLIO
TABLE 190.KEPPEL LOGISTICS: NET SALES,
TABLE 191.KEPPEL LOGISTICS: KEY STRATERGIES
TABLE 192.KERRY LOGISTICS: COMPANY SNAPSHOT
TABLE 193.KERRY LOGISTICS: OPERATING SEGMENTS
TABLE 194.KERRY LOGISTICS: PRODUCT PORTFOLIO
TABLE 195.KERRY LOGISTICS: NET SALES,
TABLE 196.KERRY LOGISTICS: KEY STRATERGIES
TABLE 197.KUEHNE + NAGEL: COMPANY SNAPSHOT
TABLE 198.KUEHNE + NAGEL: OPERATING SEGMENTS
TABLE 199.KUEHNE + NAGEL: PRODUCT PORTFOLIO
TABLE 200.KUEHNE + NAGEL: NET SALES,
TABLE 201.KUEHNE + NAGEL: KEY STRATERGIES
TABLE 202.SINGAPORE POST: COMPANY SNAPSHOT
TABLE 203.SINGAPORE POST: OPERATING SEGMENTS
TABLE 204.SINGAPORE POST: PRODUCT PORTFOLIO
TABLE 205.SINGAPORE POST: NET SALES,
TABLE 206.SINGAPORE POST: KEY STRATERGIES
TABLE 207.TIONG NAM LOGISTICS: COMPANY SNAPSHOT
TABLE 208.TIONG NAM LOGISTICS: OPERATING SEGMENTS
TABLE 209.TIONG NAM LOGISTICS: PRODUCT PORTFOLIO
TABLE 210.TIONG NAM LOGISTICS: NET SALES,
TABLE 211.TIONG NAM LOGISTICS: KEY STRATERGIES
TABLE 212.WHA CORP: COMPANY SNAPSHOT
TABLE 213.WHA CORP: OPERATING SEGMENTS
TABLE 214.WHA CORP: PRODUCT PORTFOLIO
TABLE 215.WHA CORP: NET SALES,
TABLE 216.WHA CORP: KEY STRATERGIES
TABLE 217.YCH GROUP: COMPANY SNAPSHOT
TABLE 218.YCH GROUP: OPERATING SEGMENTS
TABLE 219.YCH GROUP: PRODUCT PORTFOLIO
TABLE 220.YCH GROUP: NET SALES,
TABLE 221.YCH GROUP: KEY STRATERGIES
TABLE 222.YUSEN LOGISTICS: COMPANY SNAPSHOT
TABLE 223.YUSEN LOGISTICS: OPERATING SEGMENTS
TABLE 224.YUSEN LOGISTICS: PRODUCT PORTFOLIO
TABLE 225.YUSEN LOGISTICS: NET SALES,
TABLE 226.YUSEN LOGISTICS: KEY STRATERGIES LIST OF FIGURES
FIGURE 1.WAREHOUSING AND DISTRIBUTION LOGISTICS MARKET SEGMENTATION
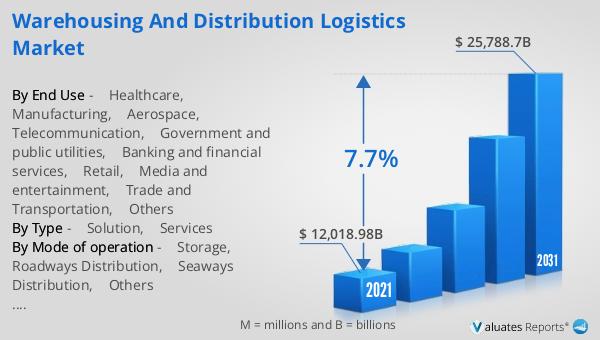
FIGURE 2.WAREHOUSING AND DISTRIBUTION LOGISTICS MARKET,2021-2031
FIGURE 3.WAREHOUSING AND DISTRIBUTION LOGISTICS MARKET,2021-2031
FIGURE 4. TOP INVESTMENT POCKETS, BY REGION
FIGURE 5.PORTER FIVE-1
FIGURE 6.PORTER FIVE-2
FIGURE 7.PORTER FIVE-3
FIGURE 8.PORTER FIVE-4
FIGURE 9.PORTER FIVE-5
FIGURE 10.TOP PLAYER POSITIONING
FIGURE 11.WAREHOUSING AND DISTRIBUTION LOGISTICS MARKET:DRIVERS, RESTRAINTS AND OPPORTUNITIES
FIGURE 12.WAREHOUSING AND DISTRIBUTION LOGISTICS MARKET,BY END USE,2021(%)
FIGURE 13.COMPARATIVE SHARE ANALYSIS OF HEALTHCARE WAREHOUSING AND DISTRIBUTION LOGISTICS MARKET,2021-2031(%)
FIGURE 14.COMPARATIVE SHARE ANALYSIS OF MANUFACTURING WAREHOUSING AND DISTRIBUTION LOGISTICS MARKET,2021-2031(%)
FIGURE 15.COMPARATIVE SHARE ANALYSIS OF AEROSPACE WAREHOUSING AND DISTRIBUTION LOGISTICS MARKET,2021-2031(%)
FIGURE 16.COMPARATIVE SHARE ANALYSIS OF TELECOMMUNICATION WAREHOUSING AND DISTRIBUTION LOGISTICS MARKET,2021-2031(%)
FIGURE 17.COMPARATIVE SHARE ANALYSIS OF GOVERNMENT AND PUBLIC UTILITIES WAREHOUSING AND DISTRIBUTION LOGISTICS MARKET,2021-2031(%)
FIGURE 18.COMPARATIVE SHARE ANALYSIS OF BANKING AND FINANCIAL SERVICES WAREHOUSING AND DISTRIBUTION LOGISTICS MARKET,2021-2031(%)
FIGURE 19.COMPARATIVE SHARE ANALYSIS OF RETAIL WAREHOUSING AND DISTRIBUTION LOGISTICS MARKET,2021-2031(%)
FIGURE 20.COMPARATIVE SHARE ANALYSIS OF MEDIA AND ENTERTAINMENT WAREHOUSING AND DISTRIBUTION LOGISTICS MARKET,2021-2031(%)
FIGURE 21.COMPARATIVE SHARE ANALYSIS OF TRADE AND TRANSPORTATION WAREHOUSING AND DISTRIBUTION LOGISTICS MARKET,2021-2031(%)
FIGURE 22.COMPARATIVE SHARE ANALYSIS OF OTHERS WAREHOUSING AND DISTRIBUTION LOGISTICS MARKET,2021-2031(%)
FIGURE 23.WAREHOUSING AND DISTRIBUTION LOGISTICS MARKET,BY BUSINESS TYPE,2021(%)
FIGURE 24.COMPARATIVE SHARE ANALYSIS OF WAREHOUSE WAREHOUSING AND DISTRIBUTION LOGISTICS MARKET,2021-2031(%)
FIGURE 25.COMPARATIVE SHARE ANALYSIS OF DISTRIBUTION WAREHOUSING AND DISTRIBUTION LOGISTICS MARKET,2021-2031(%)
FIGURE 26.COMPARATIVE SHARE ANALYSIS OF VALUE ADDED SERVICES WAREHOUSING AND DISTRIBUTION LOGISTICS MARKET,2021-2031(%)
FIGURE 27.WAREHOUSING AND DISTRIBUTION LOGISTICS MARKET,BY MODE OF OPERATION,2021(%)
FIGURE 28.COMPARATIVE SHARE ANALYSIS OF STORAGE WAREHOUSING AND DISTRIBUTION LOGISTICS MARKET,2021-2031(%)
FIGURE 29.COMPARATIVE SHARE ANALYSIS OF ROADWAYS DISTRIBUTION WAREHOUSING AND DISTRIBUTION LOGISTICS MARKET,2021-2031(%)
FIGURE 30.COMPARATIVE SHARE ANALYSIS OF SEAWAYS DISTRIBUTION WAREHOUSING AND DISTRIBUTION LOGISTICS MARKET,2021-2031(%)
FIGURE 31.COMPARATIVE SHARE ANALYSIS OF OTHERS WAREHOUSING AND DISTRIBUTION LOGISTICS MARKET,2021-2031(%)
FIGURE 32.WAREHOUSING AND DISTRIBUTION LOGISTICS MARKET,BY TYPE,2021(%)
FIGURE 33.COMPARATIVE SHARE ANALYSIS OF SOLUTION WAREHOUSING AND DISTRIBUTION LOGISTICS MARKET,2021-2031(%)
FIGURE 34.COMPARATIVE SHARE ANALYSIS OF SERVICES WAREHOUSING AND DISTRIBUTION LOGISTICS MARKET,2021-2031(%)
FIGURE 35.WAREHOUSING AND DISTRIBUTION LOGISTICS MARKET BY REGION,2021
FIGURE 36.U.S. WAREHOUSING AND DISTRIBUTION LOGISTICS MARKET,2021-2031($BILLION)
FIGURE 37.CANADA WAREHOUSING AND DISTRIBUTION LOGISTICS MARKET,2021-2031($BILLION)
FIGURE 38.MEXICO WAREHOUSING AND DISTRIBUTION LOGISTICS MARKET,2021-2031($BILLION)
FIGURE 39.GERMANY WAREHOUSING AND DISTRIBUTION LOGISTICS MARKET,2021-2031($BILLION)
FIGURE 40.FRANCE WAREHOUSING AND DISTRIBUTION LOGISTICS MARKET,2021-2031($BILLION)
FIGURE 41.RUSSIA WAREHOUSING AND DISTRIBUTION LOGISTICS MARKET,2021-2031($BILLION)
FIGURE 42.NETHERLANDS WAREHOUSING AND DISTRIBUTION LOGISTICS MARKET,2021-2031($BILLION)
FIGURE 43.UK WAREHOUSING AND DISTRIBUTION LOGISTICS MARKET,2021-2031($BILLION)
FIGURE 44.POLAND WAREHOUSING AND DISTRIBUTION LOGISTICS MARKET,2021-2031($BILLION)
FIGURE 45.SPAIN WAREHOUSING AND DISTRIBUTION LOGISTICS MARKET,2021-2031($BILLION)
FIGURE 46.REST OF EUROPE WAREHOUSING AND DISTRIBUTION LOGISTICS MARKET,2021-2031($BILLION)
FIGURE 47.CHINA WAREHOUSING AND DISTRIBUTION LOGISTICS MARKET,2021-2031($BILLION)
FIGURE 48.INDIA WAREHOUSING AND DISTRIBUTION LOGISTICS MARKET,2021-2031($BILLION)
FIGURE 49.JAPAN WAREHOUSING AND DISTRIBUTION LOGISTICS MARKET,2021-2031($BILLION)
FIGURE 50.SOUTH KOREA WAREHOUSING AND DISTRIBUTION LOGISTICS MARKET,2021-2031($BILLION)
FIGURE 51.ASEAN WAREHOUSING AND DISTRIBUTION LOGISTICS MARKET,2021-2031($BILLION)
FIGURE 52.REST OF ASIA-PACIFIC WAREHOUSING AND DISTRIBUTION LOGISTICS MARKET,2021-2031($BILLION)
FIGURE 53.BRAZIL WAREHOUSING AND DISTRIBUTION LOGISTICS MARKET,2021-2031($BILLION)
FIGURE 54.UAE WAREHOUSING AND DISTRIBUTION LOGISTICS MARKET,2021-2031($BILLION)
FIGURE 55.SAUDI ARABIA WAREHOUSING AND DISTRIBUTION LOGISTICS MARKET,2021-2031($BILLION)
FIGURE 56.SOUTH AFRICA WAREHOUSING AND DISTRIBUTION LOGISTICS MARKET,2021-2031($BILLION)
FIGURE 57.REST OF LAMEA WAREHOUSING AND DISTRIBUTION LOGISTICS MARKET,2021-2031($BILLION)
FIGURE 58. TOP WINNING STRATEGIES, BY YEAR
FIGURE 59. TOP WINNING STRATEGIES, BY DEVELOPMENT
FIGURE 60. TOP WINNING STRATEGIES, BY COMPANY
FIGURE 61.PRODUCT MAPPING OF TOP 10 PLAYERS
FIGURE 62.COMPETITIVE DASHBOARD
FIGURE 63.COMPETITIVE HEATMAP OF TOP 10 KEY PLAYERS
FIGURE 64.AGILITY.: NET SALES ,($BILLION)
FIGURE 65.CEVA LOGISTICS.: NET SALES ,($BILLION)
FIGURE 66.CJ CENTURY LOGISTICS.: NET SALES ,($BILLION)
FIGURE 67.CWT LTD.: NET SALES ,($BILLION)
FIGURE 68.DB SCHENKER.: NET SALES ,($BILLION)
FIGURE 69.DHL SUPPLY CHAIN.: NET SALES ,($BILLION)
FIGURE 70.GEMADEPT.: NET SALES ,($BILLION)
FIGURE 71.KEPPEL LOGISTICS.: NET SALES ,($BILLION)
FIGURE 72.KERRY LOGISTICS.: NET SALES ,($BILLION)
FIGURE 73.KUEHNE + NAGEL.: NET SALES ,($BILLION)
FIGURE 74.SINGAPORE POST.: NET SALES ,($BILLION)
FIGURE 75.TIONG NAM LOGISTICS.: NET SALES ,($BILLION)
FIGURE 76.WHA CORP.: NET SALES ,($BILLION)
FIGURE 77.YCH GROUP.: NET SALES ,($BILLION)
FIGURE 78.YUSEN LOGISTICS.: NET SALES ,($BILLION
SELECT A FORMAT
Added to Cart
Electronic (PDF)

$5730

This license allows only one user to access the PDF.
Electronic (PDF)

$6450

This license allows 1 - 5 user to access the PDF, license is suitable for small groups of 5 users working together
Electronic (PDF)

$9600

This license allows users/teams in a same Enterprise to use this report, various departments within an enterpise can use this report
Electronic (PDF)

$3840

This license just provides quantitative data in a excel sheet
Add to Cart
Buy Now (15% Discount)

OUR CUSTOMER

Novocure

SIMILAR REPORTS


RELATED REPORTS

Global Multi Chip Module Packaging Solution Market Research Report 2024

120 Pages
Type: Report
Code: QYRE-Auto-16B13159
Wed May 08 00:00:00 UTC 2024

Add to Cart

Global Holographic Anti-counterfeiting Packaging Materials Market Research Report 2024

120 Pages
Type: Report
Code: QYRE-Auto-30H14450
Wed May 08 00:00:00 UTC 2024

Add to Cart

Global Shipyard Transporter(SHT) Market Research Report 2024

120 Pages
Type: Report
Code: QYRE-Auto-38K11488
Wed May 08 00:00:00 UTC 2024

Add to Cart

Global Multi Chip Module Packaging Market Research Report 2024

120 Pages
Type: Report
Code: QYRE-Auto-29E11723
Wed May 08 00:00:00 UTC 2024

Add to Cart