
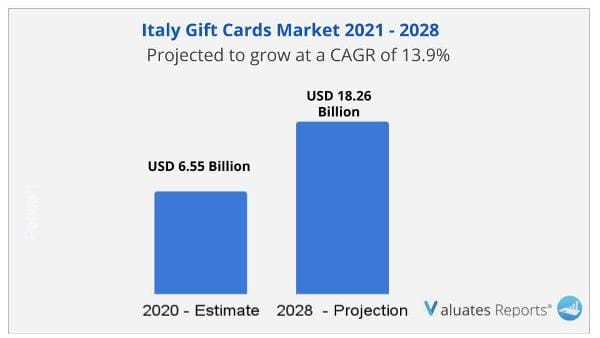
The Italy gift cards market size was valued at USD 6.55 Billion in 2020, and is projected to reach USD 18.26 Billion by 2028, growing at a CAGR of 13.9% from 2021 to 2028.
The outbreak of COVID-19 has created several digital transformation opportunities for Italy gift card providers as businesses have started expanding their offerings in digital gifts cards for enhanced online experiences for consumers during pandemic.
A gift card is a stored value card used as an alternative source for money at a particular store or business store for purchases related to goods or services. Gift cards are also known as gift certificates, vouchers, tokens, and others, which are generally issued by a retailer or a bank as a developmental strategy used for promoting businesses, attract new customers, increase brand awareness, reduce fraud, and improve sales. Closed loop gift cards can be used at a selected outlet or group of outlets depending on the issuing authority. The rise in use of e-commerce digital payments/wallets—makes it convenient for consumers to track, manage, and redeem gift cards.
The Italy gift cards market share is expected to exhibit robust growth during the forecast period. The key factors impacting the growth of the market include technological innovation in product offerings, and increase in application areas such as hospitality, banking, and retail stores. In addition, rise in need for advanced promotional strategies, high adoption rate of smart phones, and growth associated with e-commerce industry drives the Italy gift cards market growth. Furthermore, various types of fees associated with card transaction and dearth of security measures as compared to credit or debit cards are the major restraints that hinder the growth of the market. Moreover, increase in popularity of these cards while traveling and increase in demand for digital gift cards from consumers in Italy are expected to boost the market growth in the future. However, each of these factors is anticipated to have a definite impact on the overall market growth during the forecast period.
On the basis of functional attribute, the open-loop card segment dominated the Italy gift cards market share in 2020, and is expected to maintain its dominance in the upcoming years owing to the presence of vast population without a bank account in Italy, which makes the gift card market very lucrative. In addition, it provides better security, efficiency, and flexibility of electronic payments, to transact without a bank account, thus boosting its adoption among consumers and businesses. In addition, the closed-loop card segment is expected to witness highest growth rate in the upcoming years, owing to provide various benefits such as providing an opportunity to business to make money on the products purchased using the gift card, free activation for the user, and others, drive the adoption of closed loop gift cards in Italy.
The retail segment dominated the overall Italy gift cards market share in 2020, This is attributed to continuous addition of innovative and attractive gift cards by retailers, which include three-dimensional, reloadable, voice recordable, and online-redeemable gift cards. Retailers use gift cards not only to increase sales but also to communicate their marketing mix, which drives the growth of the Italy gift cards market revenue in the retail industry. However, the corporate segment is expected to grow at the highest rate during the forecast period, due to the increase in usage of gift cards by corporate institutions as an incentive, rebate, and reward payment options to encourage employees to reach new sales goals or production goals and build customer and partner relationships.
The report focuses on the growth prospects, restraints, and Italy gift cards market analysis. The study provides Porter’s five forces analysis of the Italy gift cards industry to understand the impact of various factors such as bargaining power of suppliers, competitive intensity of competitors, threat of new entrants, threat of substitutes, and bargaining power of buyers on the Italy gift cards market trends.
The Italy gift cards market is segmented into functional attribute, distribution channel, product type, end user, age group and application. On the basis of functional attribute, it is classified into open loop gift cards and closed loop gift cards. By distribution channel, the market is bifurcated into offline, and online. By product type, the market is bifurcated into physical gift card and digital gift card. In terms of end user, the market is bifurcated into retail and corporate. As per age group, it is segregated into generation X, generation Z/millennials and baby boomers. On the basis of application, the market is categorized into consumer goods, health & wellness, restaurants & bars, travel & tourism, media & entertainment and others.
Increase in demand for innovative products
Gift cards have become one of the best ways for companies to make money. The ongoing technological innovations in gift cards enable high sales in companies and help them in revenue generation. These gift card innovations benefit companies by making them unique and attractive. For instance, track gift card, which allows its users to buy and give gift cards online and also offer them capabilities to see when those gift cards can be redeemed. It also allows recipients to donate their gift cards to charity, and if a card goes unused after its expiry date, the card giver is not charged for it. For instance, Amilon Srl entered into a partnership with Eataly to extend the sale of its digital gift cards to companies. Such broad innovative offerings focused on customer experience drive the growth of the Italy gift cards market.
High Adoption of Smartphone
Gift cards have become innovative with the rapid evolution of smartphones as the use of modern technology and marketing strategies create different ways for gift card lovers and tech-savvy smartphone users that combine all the services into one convenient package. Thus, increase in adoption of smartphones boosts the growth of the gift cards market by providing many easy solutions to the customers. For instance, Gyft that is available on iOS and Android platforms, is one of the most popular solutions. Users can load their gift cards into the app and use them during shopping. As of September 2018, the penetration of smart phones in Italy is limited to only 58% of the total population. However, over the years, the number of smart phone users is estimated to exceed 43 million, i.e., 69% of the total population. High promotion and loyalty programs associated with gift cards are anticipated to fuel the usage of gift cards among smart phone users, especially among online shoppers.
CHAPTER 1:INTRODUCTION
1.1.Report description
1.2.Key benefits for stakeholders
1.3.Key market segments
1.4.Research methodology
1.4.1.Secondary research
1.4.2.Primary research
1.4.3.Analyst tools & models
CHAPTER 2:EXECUTIVE SUMMARY
2.1.Key findings
2.1.1.Top impacting factors
2.1.2.Top investment pockets
2.2.CXO perspective
CHAPTER 3:MARKET OVERVIEW
3.1.Market definition and scope
3.2.Key forces shaping Italy Gift Cards market
3.3.Market dynamics
3.3.1.Drivers
3.3.1.1.Increase in demand for innovative products
3.3.1.2.High adoption of smartphones
3.3.1.3.Rise in demand for cash alternatives
3.3.2.Restraints
3.3.2.1.Security issues and privacy concerns
3.3.3.Opportunities
3.3.3.1.Surge in demand of gift cards from Italy
3.4.COVID-19 impact analysis on Italy Gift Cards market
3.4.1.Impact on market size
3.4.2.Consumer trends, preferences, and budget impact
3.4.3.Economic impact
3.4.4.Strategies to tackle negative impact
3.4.5.Opportunity window
CHAPTER 4:ITALY GIFT CARDS MARKET, BY FUNCTIONAL ATTRIBUTE
4.1.Overview
4.2.Open Loop
4.2.1.Key market trends, growth factors, and opportunities
4.2.2.Market size and forecast, by region
4.3.Closed Loop
4.3.1.Key market trends, growth factors, and opportunities
4.3.2.Market size and forecast, by region
CHAPTER 5:ITALY GIFT CARDS MARKET, BY DISTRIBUTION CHANNEL
5.1.Overview
5.2.Online
5.2.1.Key market trends, growth factors, and opportunities
5.2.2.Market size and forecast, by region
5.3.Offline
5.3.1.Key market trends, growth factors, and opportunities
5.3.2.Market size and forecast, by region
CHAPTER 6:ITALY GIFT CARD MARKET, BY PRODUCT TYPE
6.1.Overview
6.2.Physical gift cards
6.2.1.Key market trends, growth factors, and opportunities
6.2.2.Market size and forecast, by region
6.3.Digital Gift Cards
6.3.1.Key market trends, growth factors, and opportunities
6.3.2.Market size and forecast, by region
CHAPTER 7:ITALY GIFT CARD MARKET, BY END USER
7.1.Overview
7.2.Retail Establishments
7.2.1.Key market trends, growth factors, and opportunities
7.2.2.Market size and forecast, by region
7.3.Corporate Institutions
7.3.1.Key market trends, growth factors, and opportunities
7.3.2.Market size and forecast, by region
CHAPTER 8:ITALY GIFT CARD MARKET, BY AGE GROUP
8.1.Overview
8.2.Generation X
8.2.1.Key market trends, growth factors, and opportunities
8.2.2.Market size and forecast, by region
8.3.Generation Z/Millennial
8.3.1.Key market trends, growth factors, and opportunities
8.3.2.Market size and forecast, by region
8.4.Baby Boomers
8.4.1.Key market trends, growth factors, and opportunities
8.4.2.Market size and forecast, by region
CHAPTER 9:ITALY GIFT CARDS MARKET, BY APPLICATION
9.1.Overview
9.2.Consumer Goods
9.2.1.Key market trends, growth factors, and opportunities
9.2.2.Market size and forecast, by region
9.3.Health & Wellness
9.3.1.Key market trends, growth factors, and opportunities
9.3.2.Market size and forecast, by region
9.4.Restaurants & Bars
9.4.1.Key market trends, growth factors, and opportunities
9.4.2.Market size and forecast, by region
9.5.Travel & Tourism
9.5.1.Key market trends, growth factors, and opportunities
9.5.2.Market size and forecast, by region
9.6.Media & Entertainment
9.6.1.Key market trends, growth factors, and opportunities
9.6.2.Market size and forecast, by region
9.7.Others
9.7.1.Key market trends, growth factors, and opportunities
9.7.2.Market size and forecast, by region
CHAPTER 10:COMPETITIVE LANDSCAPE
10.1.Key players positioning analysis, 2020
10.2.Top winning strategies
CHAPTER 11:COMPANY PROFILE
11.1.AMAZON.COM, INC.
11.1.1.Company overview
11.1.2.Company snapshot
11.1.3.Operating business segments
11.1.4.Product portfolio
11.1.5.Business performance
11.2.Auchan Holding
11.2.1.Company overview
11.2.2.Company snapshot
11.2.3.Operating business segments
11.2.4.Product portfolio
11.2.5.Business performance
11.3.APPLE INC.
11.3.1.Company overview
11.3.2.Company snapshot
11.3.3.Product portfolio
11.3.4.Business performance
11.4.Conad
11.4.1.Company overview
11.4.2.Company snapshot
11.4.3.Product portfolio
11.5.Carrefour Group
11.5.1.Company overview
11.5.2.Company snapshot
11.5.3.Product portfolio
11.5.4.Business performance
11.6.EUROSPAR
11.6.1.Company overview
11.6.2.Company snapshot
11.6.3.Product portfolio
11.7.Esselunga S.p.A.
11.7.1.Company overview
11.7.2.Company snapshot
11.7.3.Product portfolio
11.8.EPIPOLI S.P.A.
11.8.1.Company overview
11.8.2.Company snapshot
11.8.3.Product portfolio
11.8.4.Key strategic moves and developments
11.9.PANORAMA
11.9.1.Company overview
11.9.2.Company snapshot
11.9.3.Product portfolio
11.10.Square, Inc.
11.10.1.Company overview
11.10.2.Company snapshot
11.10.3.Product portfolio
11.10.4.Business performance
11.10.5.Key strategic moves and developments
LIST OF TABLES
TABLE 01.ITALY GIFT CARDS MARKET REVENUE, BY FUNCTIONAL ATTRIBUTE, 2020-2028 ($MILLION)
TABLE 02.ITALY GIFT CARDS MARKET FOR OPEN LOOP, BY REGION 2020–2028 ($MILLION)
TABLE 03.ITALY GIFT CARDS MARKET REVENUE FOR CLOSED LOOP, BY REGION 2020-2028 ($MILLION)
TABLE 04.ITALY GIFT CARDS MARKET REVENUE, BY DISTRIBUTION CHANNEL, 2020-2028 ($MILLION)
TABLE 05.ITALY GIFT CARDS MARKET FOR ONLINE, BY REGION 2020–2028 ($MILLION)
TABLE 06.ITALY GIFT CARDS MARKET REVENUE FOR OFFLINE, BY REGION 2020-2028 ($MILLION)
TABLE 07.ITALY GIFT CARDS MARKET REVENUE, BY PRODUCT TYPE, 2020–2028 ($MILLION)
TABLE 08.PHYSICAL GIFT CARDS ITALY GIFT CARDS MARKET REVENUE, BY REGION, 2020–2028 ($MILLION)
TABLE 09.DIGITAL GIFT CARDS ITALY GIFT CARDS MARKET REVENUE, BY REGION, 2020–2028 ($MILLION)
TABLE 10.ITALY GIFT CARDS MARKET REVENUE, BY END USER, 2020–2028 ($MILLION)
TABLE 11.RETAIL ESTABLISHMENTS ITALY GIFT CARDS MARKET REVENUE, BY REGION, 2020–2028 ($MILLION)
TABLE 12.CORPORATE INSTITUTIONS ITALY GIFT CARDS MARKET REVENUE, BY REGION, 2020–2028 ($MILLION)
TABLE 13.ITALY GIFT CARDS MARKET REVENUE, BY AGE GROUP, 2020–2028 ($MILLION)
TABLE 14.GENERATION X ITALY GIFT CARDS MARKET REVENUE, BY REGION, 2020–2028 ($MILLION)
TABLE 15.GENERATION Z/MILLENNIAL ITALY GIFT CARDS MARKET REVENUE, BY REGION, 2020–2028 ($MILLION)
TABLE 16.BABY BOOMERS ITALY GIFT CARDS MARKET REVENUE, BY REGION, 2020–2028 ($MILLION)
TABLE 17.ITALY GIFT CARDS MARKET REVENUE, BY APPLICATION, 2020-2028 ($MILLION)
TABLE 18.ITALY GIFT CARDS MARKET FOR CONSUMER GOODS, BY REGION 2020–2028 ($MILLION)
TABLE 19.ITALY GIFT CARDS MARKET FOR HEALTH & WELLNESS, BY REGION 2020–2028 ($MILLION)
TABLE 20.ITALY GIFT CARDS MARKET REVENUE FOR RESTAURANTS & BARS, BY REGION 2020-2028 ($MILLION)
TABLE 21.ITALY GIFT CARDS MARKET REVENUE FOR TRAVEL & TOURISM, BY REGION 2020-2028 ($MILLION)
TABLE 22.ITALY GIFT CARDS MARKET REVENUE FOR MEDIA & ENTERTAINMENT, BY REGION 2020-2028 ($MILLION)
TABLE 23.ITALY GIFT CARDS MARKET REVENUE FOR OTHERS, BY REGION 2020-2028 ($MILLION)
TABLE 24.AMAZON.COM, INC.: COMPANY SNAPSHOT
TABLE 25.AMAZON.COM, INC.: OPERATING SEGMENTS
TABLE 26.AMAZON.COM, INC.: PRODUCT PORTFOLIO
TABLE 27.AUCHAN HOLDING: COMPANY SNAPSHOT
TABLE 28.AUCHAN RETAIL: OPERATING SEGMENTS
TABLE 29.ITALY GIFT CARDS: PRODUCT PORTFOLIO
TABLE 30.APPLE INC.: COMPANY SNAPSHOT
TABLE 31.APPLE INC.: PRODUCT PORTFOLIO
TABLE 32.CONAD: COMPANY SNAPSHOT
TABLE 33.CONAD: PRODUCT PORTFOLIO
TABLE 34.CARREFOUR GROUP: COMPANY SNAPSHOT
TABLE 35.CARREFOUR GROUP: PRODUCT PORTFOLIO
TABLE 36.EUROSPAR: COMPANY SNAPSHOT
TABLE 37.EUROSPAR: PRODUCT PORTFOLIO
TABLE 38.ESSELUNGA S.P.A.: COMPANY SNAPSHOT
TABLE 39.ESSELUNGA S.P.A.: PRODUCT PORTFOLIO
TABLE 40.EPIPOLI S.P.A: COMPANY SNAPSHOT
TABLE 41.EPIPOLI S.P.A.: PRODUCT PORTFOLIO
TABLE 42.EPIPOLI S.P.A.: KEY STRATEGIC MOVES AND DEVELOPMENTS
TABLE 43.PANORAMA: COMPANY SNAPSHOT
TABLE 44.PANORAMA: PRODUCT PORTFOLIO
TABLE 45.SQUARE, INC.: COMPANY SNAPSHOT
TABLE 46.SQUARE, INC..: PRODUCT PORTFOLIO
TABLE 47.SQUAREUP INTERNATIONAL LTD.: KEY STRATEGIC MOVES AND DEVELOPMENTS
LIST OF FIGURES
FIGURE 01.KEY MARKET SEGMENTS
FIGURE 02.ITALY GIFT CARDS MARKET SNAPSHOT, BY SEGMENTATION, 2020–2028
FIGURE 03.ITALY GIFT CARDS MARKET: TOP IMPACTING FACTOR
FIGURE 04.TOP INVESTMENT POCKETS
FIGURE 05.MODERATE BARGAINING POWER OF SUPPLIERS
FIGURE 06.MODERATE POWER OF BUYERS
FIGURE 07.MODERATE THREAT OF SUBSTITUTES
FIGURE 08.MODERATE THREAT OF NEW ENTRANTS
FIGURE 09.MODERATE COMPETITIVE RIVALRY
FIGURE 10.ITALY GIFT CARDS MARKET REVENUE, BY TYPE, 2020–2028 ($MILLION)
FIGURE 11.ITALY GIFT CARDS MARKET REVENUE, BY DISTRIBUTION CHANNEL, 2020–2028 ($MILLION)
FIGURE 12.ITALY GIFT CARDS MARKET, BY PRODUCT TYPE, 2020-2028
FIGURE 13.ITALY GIFT CARDS MARKET, BY END USER, 2020-2028
FIGURE 14.ITALY GIFT CARDS MARKET, BY AGE GROUP, 2020-2028
FIGURE 15.ITALY GIFT CARDS MARKET REVENUE, BY APPLICATION, 2020–2028 ($MILLION)
FIGURE 16.KEY PLAYER POSITIONING ANLYSIS
FIGURE 17.TOP WINNING STRATEGIES, BY YEAR, 2019–2021
FIGURE 18.TOP WINNING STRATEGIES, BY DEVELOPMENT, 2019-2021
FIGURE 19.TOP WINNING STRATEGIES, BY COMPANY, 2019-2021
FIGURE 20.AMAZON.COM, INC.: REVENUE, 2018–2020 ($MILLION)
FIGURE 21.AMAZON.COM, INC.: REVENUE SHARE BY SEGMENT, 2020 (%)
FIGURE 22.AMAZON.COM, INC.: REVENUE SHARE BY REGION, 2020 (%)
FIGURE 23.AUCHAN HOLDING: REVENUE, 2018–2020 ($MILLION)
FIGURE 24.APPLE INC.: REVENUE, 2018–2020 ($MILLION)
FIGURE 25.APPLE INC.: REVENUE SHARE BY SEGMENT, 2020 (%)
FIGURE 26.APPLE INC.: REVENUE SHARE BY REGION, 2020 (%)
FIGURE 27.CARREFOUR GROUP: REVENUE, 2018–2020 ($MILLION)
FIGURE 28.CARREFOUR GROUP: REVENUE SHARE BY SEGMENT, 2020 (%)
FIGURE 29.SQUARE, INC.: REVENUE, 2017–2019 ($MILLION)
FIGURE 30.SQUARE, INC.: REVENUE SHARE BY SEGMENT, 2019 (%)
FIGURE 31.SQUARE, INC.: REVENUE SHARE BY REGION, 2019 (%)
$3689
$6511
HAVE A QUERY?
OUR CUSTOMER
