
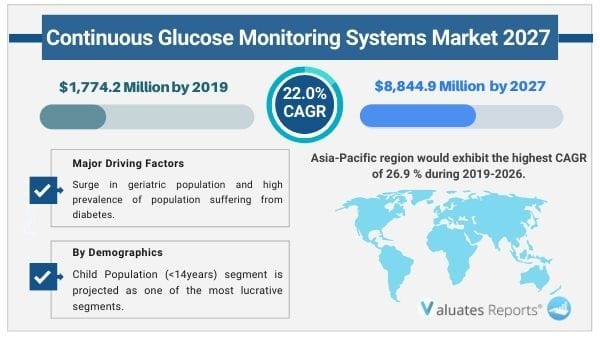
The global continuous glucose monitoring systems (CGMS) market size was valued at USD 1,774.2 million in 2019, and is projected to reach USD 8,844.9 million by 2027, registering a CAGR of 22.0% during the forecast period.
Continuous glucose monitoring (CGM) is one of the latest technological advancements in the field of diabetes management. CGM system is a type of glucose monitoring device that functions by inserting a biosensor through transcutaneous or subcutaneous route. The embedded sensor measures the glucose levels in interstitial fluid or blood, and transmits the information using a transmitter to a receiver/monitor for displaying the results. These systems play an integral role in diabetes management, owing to their associated several advantages over other glucose monitoring devices. Unlike conventional galucose monitors, these systems enable periodic monitoring of glucose levels, which is crucial for avoiding diabetic complications. In addition, CGMS technology has laid a roadmap to the most awaited, high-tech, closed-loop artificial/bionic pancreas. Therefore, development of novel and technologically advanced CGMS is the prime focus of glucose monitoring device manufacturing companies. It offers a wide range of applications for all age-cohorts, healthcare settings (diagnostic centers/clinics, hospital ICUs, and home healthcare), and geographies. Thus, continuous glucose monitoring systems market provides lucrative opportunities for both CGMS manufacturers and insulin pump manufacturers.
The major factors that drive the growth include surge in geriatric population and high prevalence of population suffering from diabetes. According to the International Diabetes Federation, the number of diabetic population is expected to reach 642 million by 2040 as compared to 415 million patients in 2015, worldwide. Thus, one out of every ten adults is expected to have diabetes by 2040, which reveals the graveness of this pandemic. Therefore, the treatment, and management of diabetes is expected to be the prime focus areas of healthcare departments and stakeholders, globally. The increase in incidence of diabetic cases is expected to provide high continuous glucose monitoring systems market growth and opportunities, which in turn will attract and compel numerous market players to develop innovative products or product line extensions. The aforementioned factors are expected to boost the overall growth of the market. However, lack of adequate reimbursement for devices is the key barrier to the adoption of the devices. On the contrary, high growth opportunities in the untapped markets are expected to provide significant profitable opportunities for manufacturers in the near future.
The continuous glucose monitoring systems market is categorized based on component, demographics, end user, and region. Based on component, the market is segmented into transmitters & receivers and integrated insulin pumps; and sensors. On the basis of demographics, CGMS are categorized into child population (≤14 years) and adult population (>14 years). Based on end user, it is classified into clinics and diagnostics centers, ICUs, and home healthcare. Region wise the continuous glucose monitoring systems market is analyzed across North America, Europe, Asia-Pacific, and LAMEA.
On the basis of component, the continuous glucose monitoring systems market is segmented into durable components such as transmitters & receivers and integrated insulin pumps; and disposable components such as sensors. The sensors segment was the major revenue contributor in 2019, and is anticipated to continue this trend during the forecast period, owing to recurring sales of CGMS, short scrap life, and bulk purchases. Therefore, it is deployed in diagnostic centers/clinics. Moreover, the adoption of CGMS in hospital ICUs and in-home healthcare settings has increased in the recent years.
Depending on the demographics, the continuous glucose monitoring systems market is categorized into child population (≤14 years) and adult population (>14 years). The adult population (>14 years) segment is projected to exhibit the highest growth during the forecast period. This is attributed to the fact that CGMS is considered as a perfect tool to control diabetes in the adult population, as CGMS is a “ready-to-go” treatment, effective for diabetes management, and affordable for the working class/employed individuals and thus, it has been widely accepted by this age group.
Region wise, the continuous glucose monitoring systems market is analyzed across North America, Europe, Asia-Pacific, and LAMEA. North America dominated the continuous glucose monitoring systems market in 2019, accounting for the highest share, and is anticipated to maintain this trend throughout the forecast period. This is attributed to increase in geriatric population, rise in incidence of diabetes, surge in demand for wireless & portable systems, and availability of sophisticated reimbursement structure that aims at reducing expenditure
The key players profiled in the continuous glucose monitoring systems market include Abbott Laboratories, Dexcom, Inc., A. Menarini Diagnostics, Echo Therapeutics, Inc., GlySens Incorporated, Johnson & Johnson, Medtronic plc, Senseonics Holdings, Inc., and F. Hoffmann-La Roche Ltd. The major strategies adopted by market players are collaborations, product launches, and product approvals. The adoption of collaboration strategy by companies enables greater focus on innovation, distribution, and commercialization of devices.
By Component
By Demographics
By Region
CHAPTER 1:INTRODUCTION
1.1.Report description
1.2.Key Benefits
1.3.Key Market Segments
1.4.RESEARCH METHODOLOGY
1.4.1.Secondary research
1.4.2.Primary research
1.4.3.Analyst tools & models
CHAPTER 2:EXECUTIVE SUMMARY
2.1.Key findings of the study
2.2.CXO Perspective
CHAPTER 3:MARKET OVERVIEW
3.1.Market definition
3.2.Need for glucose monitoring systems
3.2.1.Diabetes–a pandemic
3.2.1.1.Type 1 diabetes
3.2.1.2.Type-2 diabetes
3.2.1.3.Prediabetes and gestational diabetes mellitus (GDM)
3.2.1.4.Gestational diabetes mellitus (GDM)
3.2.1.5.Secondary diabetes
3.2.1.6.Global healthcare expenditure on diabetes
3.3.Key Findings
3.3.1.Top investment pockets
3.3.2.Top winning strategies
3.3.3.Value Chain Analysis
3.4.Patent analysis
3.4.1.Patent analysis, by market participant
3.4.2.U.S. patent analysis, by market participant
3.4.3.Patent analysis, by year
3.5.Market Share Analysis, 2019
3.6.Government Regulations
3.6.1.FDA regulations (21CFR820)
3.6.1.1.Objective and Scope of FDA 21CFR820
3.6.2.ISO regulations (ISO 13485:2003)
3.6.2.1.Objective and Scope of ISO 13485:2003
3.7.Reimbursement Scenario
3.8.Market dynamics
3.8.1.Drivers
3.8.1.1.Benefits of CGMS over POC glucometers
3.8.1.2.Rise in incidence of diabetes cases
3.8.1.3.Technological advancements
3.8.2.1.Adverse effects and accuracy
3.8.2.2.Reimbursement and stringent regulatory issues
3.8.3.Opportunities
3.8.3.1.High adoption rate of CGMS in home healthcare and ICUs
3.8.3.2.Increase in product awareness
3.8.3.3.High undiagnosed patient population
3.8.4.Impact analyses
CHAPTER 4:CONTINOUS GLUCOSE MONITORING SYSTEMS MARKET, BY COMPONENT
4.1.Overview
4.1.1.Market size and forecast, by component
4.2.Sensors
4.2.1.Key market trends, growth factors, and opportunities
4.2.2.Market size and forecast
4.2.3.Market Analysis, by country
4.3.Transmitters & Receivers
4.3.1.Key market trends, growth factors, and opportunities
4.3.2.Market size and forecast
4.3.3.Market Analysis, by country
4.4.Integrated Insulin pumps
4.4.1.Key market trends, growth factors, and opportunities
4.4.2.Market size and forecast
4.4.3.Market Analysis, by country
CHAPTER 5:CONTINUOUS GLUCOSE MONITORING SYSTEMS MARKET, BY DEMOGRAPHICS
5.1.Overview
5.1.1.Market size and forecast
5.2.Adult Population (>14 years)
5.2.1.Market size and forecast
5.2.2.Market Analysis, by country
5.3.Children Population (≤14 years)
5.3.1.Market size and forecast
5.3.2.Market Analysis, by country
CHAPTER 6:CONTINUOUS GLUCOSE MONITORING SYSTEMS MARKET, BY END USER
6.1.Overview
6.1.1.Market size and forecast
6.2.Diagnostic centers/clinics
6.2.1.Market size and forecast
6.2.2.Market Analysis, by country
6.3.ICUs
6.3.1.Market size and forecast
6.3.2.Market Analysis, by country
6.4.Home Healthcare
6.4.1.Market size and forecast
6.4.2.Market Analysis, by country
CHAPTER 7:CONTINUOUS GLUCOSE MONITORING SYSTEMS MARKET, BY REGION
7.1.Overview
7.1.1.Market size and forecast
7.2.North America
7.2.1.Key market trends, growth factors, and opportunities
7.2.2.North America continuous glucose monitoring systems market size and forecast, by country
7.2.2.2.U.S. continuous glucose monitoring systems market size and forecast, by component
7.2.2.3.U.S. continuous glucose monitoring systems market size and forecast, by demographics
7.2.2.4.U.S. continuous glucose monitoring systems market size and forecast, by end user
7.2.2.6.Canada continuous glucose monitoring systems market size and forecast, by component
7.2.2.7.Canada continuous glucose monitoring systems market size and forecast, by demographics
7.2.2.8.Canada continuous glucose monitoring systems market size and forecast, by end user
7.2.2.10.Mexico continuous glucose monitoring systems market size and forecast, by component
7.2.2.11.Mexico continuous glucose monitoring systems market size and forecast, by demographics
7.2.2.12.Mexico continuous glucose monitoring systems market size and forecast, by end user
7.2.3.North America continuous glucose monitoring systems market size and forecast, by component
7.2.4.North America continuous glucose monitoring systems market size and forecast, by demographics
7.2.5.North America continuous glucose monitoring systems market size and forecast, by end user
7.3.Europe
7.3.1.Key market trends, growth factors, and opportunities
7.3.2.Europe continuous glucose monitoring systems market size and forecast, by country
7.3.2.1.Germany continuous glucose monitoring systems market size and forecast, by component
7.3.2.2.Germany continuous glucose monitoring systems market size and forecast, by demographics
7.3.2.3.Germany continuous glucose monitoring systems market size and forecast, by end user
7.3.2.4.France continuous glucose monitoring systems market size and forecast, by component
7.3.2.5.France continuous glucose monitoring systems market size and forecast, by demographics
7.3.2.6.France continuous glucose monitoring systems market size and forecast, by end user
7.3.2.8.UK continuous glucose monitoring systems market size and forecast, by component
7.3.2.9.UK continuous glucose monitoring systems market size and forecast, by demographics
7.3.2.10.UK continuous glucose monitoring systems market size and forecast, by end user
7.3.2.12.Spain continuous glucose monitoring systems market size and forecast, by component
7.3.2.13.Spain continuous glucose monitoring systems market size and forecast, by demographics
7.3.2.14.Spain continuous glucose monitoring systems market size and forecast, by end user
7.3.2.16.Italy continuous glucose monitoring systems market size and forecast, by component
7.3.2.17.Italy continuous glucose monitoring systems market size and forecast, by demographics
7.3.2.18.Italy continuous glucose monitoring systems market size and forecast, by end user
7.3.2.20.Netherlands continuous glucose monitoring systems market size and forecast, by component
7.3.2.21.Netherlands continuous glucose monitoring systems market size and forecast, by demographics
7.3.2.22.Netherlands continuous glucose monitoring systems market size and forecast, by end user
7.3.2.23.Norway continuous glucose monitoring systems market size and forecast, by component
7.3.2.24.Norway continuous glucose monitoring systems market size and forecast, by demographics
7.3.2.25.Norway continuous glucose monitoring systems market size and forecast, by end user
7.3.2.27.Sweden continuous glucose monitoring systems market size and forecast, by component
7.3.2.28.Sweden continuous glucose monitoring systems market size and forecast, by demographics
7.3.2.29.Sweden continuous glucose monitoring systems market size and forecast, by end user
7.3.2.31.Denmark continuous glucose monitoring systems market size and forecast, by component
7.3.2.32.Denmark continuous glucose monitoring systems market size and forecast, by demographics
7.3.2.33.Denmark continuous glucose monitoring systems market size and forecast, by end user
7.3.2.35.Finland continuous glucose monitoring systems market size and forecast, by component
7.3.2.36.Finland continuous glucose monitoring systems market size and forecast, by demographics
7.3.2.37.Finland continuous glucose monitoring systems market size and forecast, by end user
7.3.2.39.Rest of Europe continuous glucose monitoring systems market size and forecast, by component
7.3.2.40.Rest of Europe continuous glucose monitoring systems market size and forecast, by demographics
7.3.2.41.Rest of Europe continuous glucose monitoring systems market size and forecast, by end user
7.3.3.Europe continuous glucose monitoring systems market size and forecast, by component
7.3.4.Europe continuous glucose monitoring systems market size and forecast, by demographics
7.3.5.Europe continuous glucose monitoring systems market size and forecast, by end user
7.4.Asia-Pacific
7.4.1.Key market trends, growth factors, and opportunities
7.4.2.Asia-Pacific continuous glucose monitoring systems market size and forecast, by country
7.4.2.1.Japan continuous glucose monitoring systems market size and forecast, by component
7.4.2.2.Japan continuous glucose monitoring systems market size and forecast, by demographics
7.4.2.3.Japan continuous glucose monitoring systems market size and forecast, by end user
7.4.2.4.China continuous glucose monitoring systems market size and forecast, by component
7.4.2.5.China continuous glucose monitoring systems market size and forecast, by demographics
7.4.2.6.China continuous glucose monitoring systems market size and forecast, by end user
7.4.2.8.India continuous glucose monitoring systems market size and forecast, by component
7.4.2.9.India continuous glucose monitoring systems market size and forecast, by demographics
7.4.2.10.India continuous glucose monitoring systems market size and forecast, by end user
7.4.2.12.Australia continuous glucose monitoring systems market size and forecast, by component
7.4.2.13.Australia continuous glucose monitoring systems market size and forecast, by demographics
7.4.2.14.Australia continuous glucose monitoring systems market size and forecast, by end user
7.4.2.16.South Korea continuous glucose monitoring systems market size and forecast, by component
7.4.2.17.South Korea continuous glucose monitoring systems market size and forecast, by demographics
7.4.2.18.South Korea continuous glucose monitoring systems market size and forecast, by end user
7.4.2.20.Rest of Asia-Pacific continuous glucose monitoring systems market size and forecast, by component
7.4.2.21.Rest of Asia-Pacific continuous glucose monitoring systems market size and forecast, by demographics
7.4.2.22.Rest of Asia-Pacific continuous glucose monitoring systems market size and forecast, by end user
7.4.3.Asia-Pacific continuous glucose monitoring systems market size and forecast, by component
7.4.4.Asia-Pacific continuous glucose monitoring systems market size and forecast, by demographics
7.4.5.Asia-Pacific continuous glucose monitoring systems market size and forecast, by end user
7.5.LAMEA
7.5.1.Key market trends, growth factors, and opportunities
7.5.2.LAMEA continuous glucose monitoring systems market size and forecast, by country
7.5.2.1.Brazil continuous glucose monitoring systems market size and forecast, by component
7.5.2.2.Brazil continuous glucose monitoring systems market size and forecast, by demographics
7.5.2.3.Brazil continuous glucose monitoring systems market size and forecast, by end user
7.5.2.5.Saudi Arabia continuous glucose monitoring systems market size and forecast, by component
7.5.2.6.Saudi Arabia continuous glucose monitoring systems market size and forecast, by demographics
7.5.2.7.Saudi Arabia continuous glucose monitoring systems market size and forecast, by end user
7.5.2.9.South Africa continuous glucose monitoring systems market size and forecast, by component
7.5.2.10.South Africa continuous glucose monitoring systems market size and forecast, by demographics
7.5.2.11.South Africa continuous glucose monitoring systems market size and forecast, by end user
7.5.2.13.Venezuela continuous glucose monitoring systems market size and forecast, by component
7.5.2.14.Venezuela continuous glucose monitoring systems market size and forecast, by demographics
7.5.2.15.Venezuela continuous glucose monitoring systems market size and forecast, by end user
7.5.2.17.Argentina continuous glucose monitoring systems market size and forecast, by component
7.5.2.18.Argentina continuous glucose monitoring systems market size and forecast, by demographics
7.5.2.19.Argentina continuous glucose monitoring systems market size and forecast, by end user
7.5.2.21.Rest of LAMEA continuous glucose monitoring systems market size and forecast, by component
7.5.2.22.Rest of LAMEA continuous glucose monitoring systems market size and forecast, by demographics
7.5.2.23.Rest of LAMEA continuous glucose monitoring systems market size and forecast, by end user
7.5.3.LAMEA continuous glucose monitoring systems market size and forecast, by component
7.5.4.LAMEA continuous glucose monitoring systems market size and forecast, by demographics
7.5.5.LAMEA continuous glucose monitoring systems market size and forecast, by end user
CHAPTER 8:COMPANY PROFILES
8.1.ABBOTT LABORATORIES
8.1.1.Company overview
8.1.2.Company snapshot
8.1.3.Operating business segments
8.1.4.Product portfolio
8.1.5.Business performance
8.2.A. Menarini Diagnostics S.r.l.
8.2.1.Company overview
8.2.2.Company snapshot
8.2.3.Operating business segments
8.2.4.Product portfolio
8.3.DexCom, Inc.
8.3.1.Company overview
8.3.2.Company snapshot
8.3.3.Product portfolio
8.3.4.Business performance
8.3.5.Key strategic moves and developments
8.4.Echo Therapeutics, Inc.
8.4.1.Company overview
8.4.2.Company snapshot
8.4.3.Operating business segments
8.4.4.Product portfolio
8.5.F. Hoffmann-La Roche Ltd.
8.5.1.Company overview
8.5.2.Company snapshot
8.5.3.Operating business segments
8.5.4.Product portfolio
8.5.5.Business performance
8.6.GlySens Incorporated
8.6.1.Company overview
8.6.2.Company snapshot
8.6.3.Product portfolio
8.6.4.Key strategic moves and developments
8.7.Insulet Corporation
8.7.1.Company overview
8.7.2.Company snapshot
8.7.3.Product portfolio
8.7.4.Business performance
8.7.5.Key strategic moves and developments
8.8.JOHNSON & JOHNSON
8.8.1.Company overview
8.8.2.Company snapshot
8.8.3.Operating business segments
8.8.4.Product portfolio
8.8.5.Business performance
8.9.MEDTRONIC PLC
8.9.1.Company overview
8.9.2.Company snapshot
8.9.3.Operating business segments
8.9.4.Product portfolio
8.9.5.Business performance
8.10.Senseonics Holdings, Inc.
8.10.1.Company overview
8.10.2.Company snapshot
8.10.3.Operating business segments
8.10.4.Product portfolio
8.10.5.Business performance
8.10.6.Key strategic moves and developments
TABLE 01.GLOBAL PREVALENCE OF TYPE-2 DIABETES (2014)
TABLE 02.GLOBAL CONTINUOUS GLUCOSE MONITORING SYSTEMS MARKET, BY COMPONENT, 2019-2027 ($MILLION)
TABLE 03.SENSORS MARKET, BY REGION, 2019-2027 ($MILLION)
TABLE 04.TRANSMITTERS & RECEIVERS MARKET, BY REGION, 2019-2027 ($MILLION)
TABLE 05.INTEGRATED INSULIN PUMPS MARKET, BY REGION, 2019-2027 ($MILLION)
TABLE 06.GLOBAL CONTINUOUS GLUCOSE MONITORING SYSTEMS MARKET, BY DEMOGRAPHICS, 2019-2027 ($MILLION)
TABLE 07.CONTINUOUS GLUCOSE MONITORING SYSTEMS MARKET FOR ADULT POPULATION (>14YEARS), BY REGION, 2019-2027 ($MILLION)
TABLE 08.TYPE-1 DIABETES (0–14 YEARS), 2019
TABLE 09.CONTINUOUS GLUCOSE MONITORING SYSTEMS MARKET FOR CHILD POPULATION (<14YEARS), BY REGION, 2019-2027 ($MILLION)
TABLE 10.GLOBAL CONTINUOUS GLUCOSE MONITORING SYSTEMS MARKET, BY END-USER, 2019-2027 ($MILLION)
TABLE 11.CONTINUOUS GLUCOSE MONITORING SYSTEMS MARKET FOR DIAGNOSTIC CENTERS/CLINICS, BY REGION,2019-2027 ($MILLION)
TABLE 12.CONTINUOUS GLUCOSE MONITORING SYSTEMS MARKET FOR ICUS, BY REGION, 2019-2027 ($MILLION)
TABLE 13.CONTINUOUS GLUCOSE MONITORING SYSTEMS MARKET FOR HOME HEALTHCARE, BY REGION, 2019-2027 ($MILLION)
TABLE 14.CONTINUOUS GLUCOSE MONITORING SYSTEMS MARKET, BY REGION, 2019-2027 ($MILLION)
TABLE 15.NORTH AMERICA CONTINUOUS GLUCOSE MONITORING SYSTEMS MARKET, BY COUNTRY, 2019-2027 ($MILLION)
TABLE 16.U.S. CONTINUOUS GLUCOSE MONITORING SYSTEMS MARKET, BY COMPONENT, 2019-2027 ($MILLION)
TABLE 17.U.S. CONTINUOUS GLUCOSE MONITORING SYSTEMS MARKET, BY DEMOGRAPHICS, 2019-2027 ($MILLION)
TABLE 18.U.S. CONTINUOUS GLUCOSE MONITORING SYSTEMS MARKET, BY END USER, 2019-2027 ($MILLION)
TABLE 19.CANADA CONTINUOUS GLUCOSE MONITORING SYSTEMS MARKET, BY COMPONENT, 2019-2027 ($MILLION)
TABLE 20.CANADA CONTINUOUS GLUCOSE MONITORING SYSTEMS MARKET, BY DEMOGRAPHICS, 2019-2027 ($MILLION)
TABLE 21.CANADA CONTINUOUS GLUCOSE MONITORING SYSTEMS MARKET, BY END USER, 2019-2027 ($MILLION)
TABLE 22.MEXICO CONTINUOUS GLUCOSE MONITORING SYSTEMS MARKET, BY COMPONENT, 2019-2027 ($MILLION)
TABLE 23.MEXICO CONTINUOUS GLUCOSE MONITORING SYSTEMS MARKET, BY DEMOGRAPHICS, 2019-2027 ($MILLION)
TABLE 24.MEXICO CONTINUOUS GLUCOSE MONITORING SYSTEMS MARKET, BY END USER, 2019-2027 ($MILLION)
TABLE 25.NORTH AMERICA CONTINUOUS GLUCOSE MONITORING SYSTEMS MARKET, BY COMPONENT, 2019-2027 ($MILLION)
TABLE 26.NORTH AMERICA CONTINUOUS GLUCOSE MONITORING SYSTEMS MARKET, BY DEMOGRAPHICS, 2019-2027 ($MILLION)
TABLE 27.NORTH AMERICA CONTINUOUS GLUCOSE MONITORING SYSTEMS MARKET, BY END USER, 2019-2027 ($MILLION)
TABLE 28.PREVALENCE ESTIMATES OF DIABETES (20–79 YEARS) IN EUROPE, 2015
TABLE 29.EUROPE CONTINUOUS GLUCOSE MONITORING SYSTEMS MARKET, BY COUNTRY, 2019-2027 ($MILLION)
TABLE 30.GERMANY CONTINUOUS GLUCOSE MONITORING SYSTEMS MARKET, BY COMPONENT, 2019-2027 ($MILLION)
TABLE 31.GERMANY CONTINUOUS GLUCOSE MONITORING SYSTEMS MARKET, BY DEMOGRAPHICS, 2019-2027 ($MILLION)
TABLE 32.GERMANY CONTINUOUS GLUCOSE MONITORING SYSTEMS MARKET, BY END USER, 2019-2027 ($MILLION)
TABLE 33.FRANCE CONTINUOUS GLUCOSE MONITORING SYSTEMS MARKET, BY COMPONENT, 2019-2027 ($MILLION)
TABLE 34.FRANCE CONTINUOUS GLUCOSE MONITORING SYSTEMS MARKET, BY DEMOGRAPHICS, 2019-2027 ($MILLION)
TABLE 35.FRANCE CONTINUOUS GLUCOSE MONITORING SYSTEMS MARKET, BY END USER, 2019-2027 ($MILLION)
TABLE 36.UK CONTINUOUS GLUCOSE MONITORING SYSTEMS MARKET, BY COMPONENT, 2019-2027 ($MILLION)
TABLE 37.UK CONTINUOUS GLUCOSE MONITORING SYSTEMS MARKET, BY DEMOGRAPHICS, 2019-2027 ($MILLION)
TABLE 38.UK CONTINUOUS GLUCOSE MONITORING SYSTEMS MARKET, BY END USER, 2019-2027 ($MILLION)
TABLE 39.SPAIN CONTINUOUS GLUCOSE MONITORING SYSTEMS MARKET, BY COMPONENT, 2019-2027 ($MILLION)
TABLE 40.SPAIN CONTINUOUS GLUCOSE MONITORING SYSTEMS MARKET, BY DEMOGRAPHICS, 2019-2027 ($MILLION)
TABLE 41.SPAIN CONTINUOUS GLUCOSE MONITORING SYSTEMS MARKET, BY END USER, 2019-2027 ($MILLION)
TABLE 42.ITALY CONTINUOUS GLUCOSE MONITORING SYSTEMS MARKET, BY COMPONENT, 2019-2027 ($MILLION)
TABLE 43.ITALY CONTINUOUS GLUCOSE MONITORING SYSTEMS MARKET, BY DEMOGRAPHICS, 2019-2027 ($MILLION)
TABLE 44.ITALY CONTINUOUS GLUCOSE MONITORING SYSTEMS MARKET, BY END USER, 2019-2027 ($MILLION)
TABLE 45.NETHERLANDS CONTINUOUS GLUCOSE MONITORING SYSTEMS MARKET, BY COMPONENT, 2019-2027 ($MILLION)
TABLE 46.NETHERLANDS CONTINUOUS GLUCOSE MONITORING SYSTEMS MARKET, BY DEMOGRAPHICS, 2019-2027 ($MILLION)
TABLE 47.NETHERLANDS CONTINUOUS GLUCOSE MONITORING SYSTEMS MARKET, BY END USER, 2019-2027 ($MILLION)
TABLE 48.NORWAY CONTINUOUS GLUCOSE MONITORING SYSTEMS MARKET, BY COMPONENT, 2019-2027 ($MILLION)
TABLE 49.NORWAY CONTINUOUS GLUCOSE MONITORING SYSTEMS MARKET, BY DEMOGRAPHICS, 2019-2027 ($MILLION)
TABLE 50.NORWAY CONTINUOUS GLUCOSE MONITORING SYSTEMS MARKET, BY END USER, 2019-2027 ($MILLION)
TABLE 51.SWEDEN CONTINUOUS GLUCOSE MONITORING SYSTEMS MARKET, BY COMPONENT, 2019-2027 ($MILLION)
TABLE 52.SWEDEN CONTINUOUS GLUCOSE MONITORING SYSTEMS MARKET, BY DEMOGRAPHICS, 2019-2027 ($MILLION)
TABLE 53.SWEDEN CONTINUOUS GLUCOSE MONITORING SYSTEMS MARKET, BY END USER, 2019-2027 ($MILLION)
TABLE 54.DENMARK CONTINUOUS GLUCOSE MONITORING SYSTEMS MARKET, BY COMPONENT, 2019-2027 ($MILLION)
TABLE 55.DENMARK CONTINUOUS GLUCOSE MONITORING SYSTEMS MARKET, BY DEMOGRAPHICS, 2019-2027 ($MILLION)
TABLE 56.DENMARK CONTINUOUS GLUCOSE MONITORING SYSTEMS MARKET, BY END USER, 2019-2027 ($MILLION)
TABLE 57.FINLAND CONTINUOUS GLUCOSE MONITORING SYSTEMS MARKET, BY COMPONENT, 2019-2027 ($MILLION)
TABLE 58.FINLAND CONTINUOUS GLUCOSE MONITORING SYSTEMS MARKET, BY DEMOGRAPHICS, 2019-2027 ($MILLION)
TABLE 59.FINLAND CONTINUOUS GLUCOSE MONITORING SYSTEMS MARKET, BY END USER, 2019-2027 ($MILLION)
TABLE 60.REST OF EUROPE CONTINUOUS GLUCOSE MONITORING SYSTEMS MARKET, BY COMPONENT, 2019-2027 ($MILLION)
TABLE 61.REST OF EUROPE CONTINUOUS GLUCOSE MONITORING SYSTEMS MARKET, BY DEMOGRAPHICS, 2019-2027 ($MILLION)
TABLE 62.REST OF EUROPE CONTINUOUS GLUCOSE MONITORING SYSTEMS MARKET, BY END USER, 2019-2027 ($MILLION)
TABLE 63.EUROPE CONTINUOUS GLUCOSE MONITORING SYSTEMS MARKET, BY COMPONENT, 2019-2027 ($MILLION)
TABLE 64.EUROPE CONTINUOUS GLUCOSE MONITORING SYSTEMS MARKET, BY DEMOGRAPHICS, 2019-2027 ($MILLION)
TABLE 65.EUROPE CONTINUOUS GLUCOSE MONITORING SYSTEMS MARKET, BY END USER, 2019-2027 ($MILLION)
TABLE 66.ASIA-PACIFIC CONTINUOUS GLUCOSE MONITORING SYSTEMS MARKET, BY COUNTRY, 2019-2027 ($MILLION)
TABLE 67.JAPAN CONTINUOUS GLUCOSE MONITORING SYSTEMS MARKET, BY COMPONENT, 2019-2027 ($MILLION)
TABLE 68.JAPAN CONTINUOUS GLUCOSE MONITORING SYSTEMS MARKET, BY DEMOGRAPHICS, 2019-2027 ($MILLION)
TABLE 69.JAPAN CONTINUOUS GLUCOSE MONITORING SYSTEMS MARKET, BY END USER, 2019-2027 ($MILLION)
TABLE 70.CHINA CONTINUOUS GLUCOSE MONITORING SYSTEMS MARKET, BY COMPONENT, 2019-2027 ($MILLION)
TABLE 71.CHINA CONTINUOUS GLUCOSE MONITORING SYSTEMS MARKET, BY DEMOGRAPHICS, 2019-2027 ($MILLION)
TABLE 72.CHINA CONTINUOUS GLUCOSE MONITORING SYSTEMS MARKET, BY END USER, 2019-2027 ($MILLION)
TABLE 73.INDIA CONTINUOUS GLUCOSE MONITORING SYSTEMS MARKET, BY COMPONENT, 2019-2027 ($MILLION)
TABLE 74.INDIA CONTINUOUS GLUCOSE MONITORING SYSTEMS MARKET, BY DEMOGRAPHICS, 2019-2027 ($MILLION)
TABLE 75.INDIA CONTINUOUS GLUCOSE MONITORING SYSTEMS MARKET, BY END USER, 2019-2027 ($MILLION)
TABLE 76.AUSTRALIA CONTINUOUS GLUCOSE MONITORING SYSTEMS MARKET, BY COMPONENT, 2019-2027 ($MILLION)
TABLE 77.AUSTRALIA CONTINUOUS GLUCOSE MONITORING SYSTEMS MARKET, BY DEMOGRAPHICS, 2019-2027 ($MILLION)
TABLE 78.AUSTRALIA CONTINUOUS GLUCOSE MONITORING SYSTEMS MARKET, BY END USER, 2019-2027 ($MILLION)
TABLE 79.SOUTH KOREA CONTINUOUS GLUCOSE MONITORING SYSTEMS MARKET, BY COMPONENT, 2019-2027 ($MILLION)
TABLE 80.SOUTH KOREA CONTINUOUS GLUCOSE MONITORING SYSTEMS MARKET, BY DEMOGRAPHICS, 2019-2027 ($MILLION)
TABLE 81.SOUTH KOREA CONTINUOUS GLUCOSE MONITORING SYSTEMS MARKET, BY END USER, 2019-2027 ($MILLION)
TABLE 82.REST OF ASIA-PACIFIC CONTINUOUS GLUCOSE MONITORING SYSTEMS MARKET, BY COMPONENT, 2019-2027 ($MILLION)
TABLE 83.REST OF ASIA-PACIFIC CONTINUOUS GLUCOSE MONITORING SYSTEMS MARKET, BY DEMOGRAPHICS, 2019-2027 ($MILLION)
TABLE 84.REST OF ASIA-PACIFIC CONTINUOUS GLUCOSE MONITORING SYSTEMS MARKET, BY END USER, 2019-2027 ($MILLION)
TABLE 85.ASIA-PACIFIC CONTINUOUS GLUCOSE MONITORING SYSTEMS MARKET, BY COMPONENT, 2019-2027 ($MILLION)
TABLE 86.ASIA-PACIFIC CONTINUOUS GLUCOSE MONITORING SYSTEMS MARKET, BY DEMOGRAPHICS, 2019-2027 ($MILLION)
TABLE 87.ASIA-PACIFIC CONTINUOUS GLUCOSE MONITORING SYSTEMS MARKET, BY END USER, 2019-2027 ($MILLION)
TABLE 88.LAMEA CONTINUOUS GLUCOSE MONITORING SYSTEMS MARKET, BY COUNTRY, 2019-2027 ($MILLION)
TABLE 89.BRAZIL CONTINUOUS GLUCOSE MONITORING SYSTEMS MARKET, BY COMPONENT, 2019-2027 ($MILLION)
TABLE 90.BRAZIL CONTINUOUS GLUCOSE MONITORING SYSTEMS MARKET, BY DEMOGRAPHICS, 2019-2027 ($MILLION)
TABLE 91.BRAZIL CONTINUOUS GLUCOSE MONITORING SYSTEMS MARKET, BY END USER, 2019-2027 ($MILLION)
TABLE 92.SAUDI ARABIA CONTINUOUS GLUCOSE MONITORING SYSTEMS MARKET, BY COMPONENT, 2019-2027 ($MILLION)
TABLE 93.SAUDI ARABIA CONTINUOUS GLUCOSE MONITORING SYSTEMS MARKET, BY DEMOGRAPHICS, 2019-2027 ($MILLION)
TABLE 94.SAUDI ARABIA CONTINUOUS GLUCOSE MONITORING SYSTEMS MARKET, BY END USER, 2019-2027 ($MILLION)
TABLE 95.SOUTH AFRICA CONTINUOUS GLUCOSE MONITORING SYSTEMS MARKET, BY COMPONENT, 2019-2027 ($MILLION)
TABLE 96.SOUTH AFRICA CONTINUOUS GLUCOSE MONITORING SYSTEMS MARKET, BY DEMOGRAPHICS, 2019-2027 ($MILLION)
TABLE 97.SOUTH AFRICA CONTINUOUS GLUCOSE MONITORING SYSTEMS MARKET, BY END USER, 2019-2027 ($MILLION)
TABLE 98.VENEZUELA CONTINUOUS GLUCOSE MONITORING SYSTEMS MARKET, BY COMPONENT, 2019-2027 ($MILLION)
TABLE 99.VENEZUELA CONTINUOUS GLUCOSE MONITORING SYSTEMS MARKET, BY DEMOGRAPHICS, 2019-2027 ($MILLION)
TABLE 100.VENEZUELA CONTINUOUS GLUCOSE MONITORING SYSTEMS MARKET, BY END USER, 2019-2027 ($MILLION)
TABLE 101.ARGENTINA CONTINUOUS GLUCOSE MONITORING SYSTEMS MARKET, BY COMPONENT, 2019-2027 ($MILLION)
TABLE 102.ARGENTINA CONTINUOUS GLUCOSE MONITORING SYSTEMS MARKET, BY DEMOGRAPHICS, 2019-2027 ($MILLION)
TABLE 103.ARGENTINA CONTINUOUS GLUCOSE MONITORING SYSTEMS MARKET, BY END USER, 2019-2027 ($MILLION)
TABLE 104.REST OF LAMEA CONTINUOUS GLUCOSE MONITORING SYSTEMS MARKET, BY COMPONENT, 2019-2027 ($MILLION)
TABLE 105.REST OF LAMEA CONTINUOUS GLUCOSE MONITORING SYSTEMS MARKET, BY DEMOGRAPHICS, 2019-2027 ($MILLION)
TABLE 106.REST OF LAMEA CONTINUOUS GLUCOSE MONITORING SYSTEMS MARKET, BY END USER, 2019-2027 ($MILLION)
TABLE 107.LAMEA CONTINUOUS GLUCOSE MONITORING SYSTEMS MARKET, BY COMPONENT, 2019-2027 ($MILLION)
TABLE 108.LAMEA CONTINUOUS GLUCOSE MONITORING SYSTEMS MARKET, BY DEMOGRAPHICS, 2019-2027 ($MILLION)
TABLE 109.LAMEA CONTINUOUS GLUCOSE MONITORING SYSTEMS MARKET, BY END USER, 2019-2027 ($MILLION)
TABLE 110.ABBOTT LABORATORIES: COMPANY SNAPSHOT
TABLE 111.ABBOTT LABORATORIES: OPERATING SEGMENTS
TABLE 112.ABBOTT LABORATORIES PLC: PRODUCT PORTFOLIO
TABLE 113.A. MENARINI DIAGNOSTICS: COMPANY SNAPSHOT
TABLE 114.A. MENARINI DIAGNOSTICS: PRODUCT SEGMENTS
TABLE 115.A. MENARINI DIAGNOSTICS: PRODUCT PORTFOLIO
TABLE 116.DEXCOM: COMPANY SNAPSHOT
TABLE 117.DEXCOM: PRODUCT PORTFOLIO
TABLE 118.ECHO THERAPEUTICS: COMPANY SNAPSHOT
TABLE 119.ECHO THERAPEUTICS: OPERATING SEGMENTS
TABLE 120.ECHO THERAPEUTICS: PRODUCT PORTFOLIO
TABLE 121.ROCHE: COMPANY SNAPSHOT
TABLE 122.ROCHE: OPERATING SEGMENTS
TABLE 123.ROCHE: PRODUCT PORTFOLIO
TABLE 124.GLYSENS: COMPANY SNAPSHOT
TABLE 125.GLYSENS: PRODUCT PORTFOLIO
TABLE 126.INSULET CORPORATION: COMPANY SNAPSHOT
TABLE 127.INSULET CORPORATION: PRODUCT PORTFOLIO
TABLE 128.J&J: COMPANY SNAPSHOT
TABLE 129.J&J: OPERATING BUSINESS SEGMENTS
TABLE 130.J&J: PRODUCT PORTFOLIO
TABLE 131.MEDTRONIC: COMPANY SNAPSHOT
TABLE 132.MEDTRONIC: OPERATING BUSINESS SEGMENTS
TABLE 133.MEDTRONIC: PRODUCT PORTFOLIO
TABLE 134.SENSEONICS: COMPANY SNAPSHOT
TABLE 135.SENSEONICS: PRODUCT SEGMENTS
TABLE 136.SENSEONICS: PRODUCT PORTFOLIO
LIST OF FIGURES
FIGURE 01.GLOBAL CONTINUOUS GLUCOSE MONITORING (CGM) SYSTEMS MARKET SEGMENTATION
FIGURE 02.PREVALENCE OF TYPE 1 DIABETES (AGE GROUP OF <15 YEARS), BY GEOGRAPHY (2015)
FIGURE 03.SIMILAR PREDISPOSITION AND RISK FACTORS FOR PREDIABETES AND TYPE-2 DIABETES
FIGURE 04.TOP TEN COUNTRIES/TERRITORIES FOR DIABETES-RELATED HEALTH EXPENDITURE, 2015
FIGURE 05.GLOBAL FINANCIAL BURDEN OF DIABETES, BY GEOGRAPHY
FIGURE 06.TOP INVESTMENT POCKETS
FIGURE 07.TOP WINNING STRATEGIES, BY YEAR, 2014–2018*
FIGURE 08.TOP WINNING STRATEGIES, BY DEVELOPMENT, 2014–2018* (%)
FIGURE 09.TOP WINNING STRATEGIES, BY COMPANY, 2014–2018*
FIGURE 10.VALUE CHAIN OF GLOBAL CGMS MARKET
FIGURE 11.PATENTS REGISTERED/APPROVED IN THE WORLD 2015-2018
FIGURE 12.PATENT ANALYSIS BY MARKET PARTICIPANT, 2015-2018
FIGURE 13.U.S.: PATENT ANALYSIS BY MARKET PARTICIPANT, 2015-2018
FIGURE 14.PATENTS ANALYSIS BY YEAR, 2015-2018
FIGURE 15.MARKET SHARE ANALYSIS OF GLOBAL CGMS MARKET, 2019
FIGURE 16.UNDIAGNOSED PATIENT POPULATION IN 2015 (MILLION)
FIGURE 17.IMPACT ANALYSES
FIGURE 18.COMPARATIVE SHARE ANALYSIS OF GLOBAL CONTINUOUS GLUCOSE MONITORING SYSTEMS MARKET FOR SENSORS, BY COUNTRY, 2019 & 2027 (%)
FIGURE 19.COMPARATIVE SHARE ANALYSIS OF GLOBAL CONTINUOUS GLUCOSE MONITORING SYSTEMS MARKET FOR TRANSMITTERS & RECEIVERS, BY COUNTRY, 2019 & 2027 (%)
FIGURE 20.COMPARATIVE SHARE ANALYSIS OF GLOBAL CONTINUOUS GLUCOSE MONITORING SYSTEMS MARKET FOR INTEGRATED INSULIN PUMPS, BY COUNTRY, 2019 & 2027 (%)
FIGURE 21.COMPARATIVE SHARE ANALYSIS OF GLOBAL CONTINUOUS GLUCOSE MONITORING SYSTEMS MARKET FOR ADULT POPULATION (>14YEARS), BY COUNTRY, 2019 & 2027 (%)
FIGURE 22.COMPARATIVE SHARE ANALYSIS OF GLOBAL CONTINUOUS GLUCOSE MONITORING SYSTEMS MARKET FOR CHILD POPULATION (<14YEARS), BY COUNTRY, 2019 & 2027 (%)
FIGURE 23.COMPARATIVE SHARE ANALYSIS OF GLOBAL CONTINUOUS GLUCOSE MONITORING SYSTEMS MARKET FOR DIAGNOSTIC CENTERS/CLINICS, BY COUNTRY, 2019 & 2027 (%)
FIGURE 24.COMPARATIVE SHARE ANALYSIS OF GLOBAL CONTINUOUS GLUCOSE MONITORING SYSTEMS MARKET FOR ICUS, BY COUNTRY, 2019 & 2027 (%)
FIGURE 25.COMPARATIVE SHARE ANALYSIS OF GLOBAL CONTINUOUS GLUCOSE MONITORING SYSTEMS MARKET FOR HOME HEALTHCARE, BY COUNTRY, 2019 & 2027 (%)
FIGURE 26.ABBOTT LABORATORIES: REVENUE SHARE BY SEGMENT, 2018 (%)
FIGURE 27.ABBOTT LABORATORIES: REVENUE SHARE BY REGION, 2018 (%)
FIGURE 28.DEXCOM: NET SALES, 2015–2017 ($MILLION)
FIGURE 29.DEXCOM: REVENUE SHARE BY GEOGRAPHY, 2017 (%)
FIGURE 30.ROCHE: NET SALES, 2017–2018 ($MILLION)
FIGURE 31.ROCHE: REVENUE SHARE BY SEGMENT, 2018 (%)
FIGURE 32.ROCHE: REVENUE SHARE BY GEOGRAPHY, 2018 (%)
FIGURE 33.INSULET CORPORATION: REVENUE, 2017–2019 ($MILLION)
FIGURE 34.INSULET CORPORATION: REVENUE SHARE BY OPERATIONS, 2019 (%)
FIGURE 35.INSULET CORPORATION: REVENUE SHARE BY GEOGRAPHY, 2019 (%)
FIGURE 36.J&J: NET SALES, 2016–2018 ($MILLION)
FIGURE 37.J&J: REVENUE SHARE BY SEGMENT, 2018 (%)
FIGURE 38.J&J: REVENUE SHARE BY REGION, 2018(%)
FIGURE 39.MEDTRONIC: NET SALES, 2017–2019 ($MILLION)
FIGURE 40.MEDTRONIC: REVENUE SHARE BY SEGMENT, 2019 (%)
FIGURE 41.MEDTRONIC: REVENUE SHARE BY REGION, 2019 (%)
FIGURE 42.SENSEONICS: NET SALES, 2016–2018 ($MILLION)
$5370
$6450
$8995
HAVE A QUERY?
OUR CUSTOMER
