0
U.S. (TOLL FREE)
+1 (315) 215-3225
Automative

0
U.S. (TOLL FREE)
+1 (315) 215-3225
Sodium Citrate Market By Type (Monosodium Citrate, Disodium Citrate, Trisodium Citrate), By Application (Food and Beverages, Pharmaceuticals, Cosmetics, Soaps and Detergents, Others): Global Opportunity Analysis and Industry Forecast, 2021-2031
Published Date: February 2023
|
Report Code: ALLI-Auto-1Y767
Home | Market Reports | Health| Pharmacy| Drugs & Medications
Sodium Citrate Market By Type Monosodium Citrate Disodium Citrate Trisodium Citrate By Application Food and Beverages Pharmaceuticals Cosmetics Soaps and Detergents Others Global Opportunity Analysis and Industry Forecast 2021 2031
BUY CHAPTERS

Sodium Citrate Market By Type (Monosodium Citrate, Disodium Citrate, Trisodium Citrate), By Application (Food and Beverages, Pharmaceuticals, Cosmetics, Soaps and Detergents, Others): Global Opportunity Analysis and Industry Forecast, 2021-2031

Code: ALLI-Auto-1Y767
Report
February 2023
Pages:380
Allied Market Research
Buy Now with 15% Discount
DESCRIPTION
TABLE OF CONTENT
TABLES & FIGURES

Sodium Citrate Market Size

According to a new report published by , titled, “Sodium Citrate Market," The sodium citrate market was valued at $813.60 million in 2021, and is estimated to reach $1.2 billion by 2031, growing at a CAGR of 4.1% from 2022 to 2031.

Sodium Citrate Market

Sodium Citrate Market

Sodium citrate (Na3C6H5O7), the sodium salt of citrate, has an alkalizing effect. Sodium citrate is also known as trisodium citrate, citrosodine, and natrocitral. It is common in the pharmaceutical and food industries. After absorption, sodium citrate is dissociated into citrate anions and sodium cations. Organic citrate ions are converted to bicarbonate ions, which buffer excess hydrogen ions and have the potential to reverse acidosis, raise blood pH, and increase plasma bicarbonate concentration. It is a water-soluble trisodium citric acid salt. It has a pH range of 7.5 to 9.0.
Key factors that drive the growth of the sodium citrate market include the high demand for processed food. Consumer demand for food products in the market is being fueled by the increasing growth rate of the global population. Furthermore, hectic schedules of consumers, lack of time for food preparation, and increase in work pressure force them to seek out fast food alternatives. Fast-food manufacturers are attempting to improve the quality and shelf life of their products, to meet the market demand. As a result, there is a high demand for food ingredients in the food & beverage industry to continue production in order to maintain the demand-supply gap. On the other hand, there is an increase in the global population over time, and there is an increase in work pressure on people, leading them to seek out processed and packaged food to save time and satisfy their hunger. Furthermore, the availability of processed food has increased over time, which has influenced consumer eating habits. According to the United Nations Children's Fund (UNICEF), school-aged teenagers consumed processed food in 2019-2020: 42% consumed carbonated sugary sodas at least once a day, and 46% ate fast food at least once a week. Product innovations, an increase in the trend of healthy eating, economic growth, an increase in disposable income, and other factors boost market growth. Moreover, consumer habits, tastes, and preferences are always changing. This has resulted in market trends for food ingredients that drive market growth.
There are regulations governing raw materials, their processing, the ingredients used, and the labeling of these products. As a result, the food ingredients market has come under the scrutiny of the government, which is expected to limit the market growth. In October 2021, the U.S. Food and Drug Administration (FDA) issued guidance to set measurable voluntary sodium reduction targets for processed, packaged, and prepared food. In approximately 160 food categories, the guidance of the FDA establishes short-term sodium reduction targets for food manufacturers, restaurants, and food service establishments. The sodium reduction targets aim to reduce average dietary sodium intake from 3,400 mg to 3,000 mg per day over the next 2.5 years. This guidance brings the general public closer to meeting the Dietary Guidelines for Americans recommended sodium limit for Americans as 2,300 mg per day (for those 14 and older), which results in a lower risk of heart disease, stroke, and hypertension. Sodium citrate is also regulated in Europe under European Food Safety Authority (EFSA) Commission Regulation (EU) No. 231/2012. The Joint FAO/WHO Expert Committee on Food Additives (JECFA) governs the regulation of sodium citrate globally.
The market also offers growth opportunities to the key players in the market. Trisodium citrate is particularly well-suited for inclusion in liquid detergent formulations because it is soluble in liquid detergent, unlike other environment-friendly detergent builders. Sodium citrate can be used as the sole builder in anionic detergent formulations intended for high-temperature cleaning. A combination of anionic and nonionic surfactants is commonly used for optimal performance. In general, anionics are effective at removing particulate soil while nonionics are effective at removing greasy soil. As a result of the increased use of sodium citrate as an environment-friendly material in detergents, is expected to benefit sodium citrate manufacturers..
The sodium citrate market is segmented on the basis of type, application, and region. On the basis of type, the sodium citrate market is classified into monosodium citrate, disodium citrate, and trisodium citrate. On the basis of application, the market has been divided into food & beverages, pharmaceuticals, cosmetics, soaps and detergents, and others. The food & beverage sub-segment has been further divided into beverages, dairy, meat and fish, jams, jellies, preserves, and others. On the basis of region, the market is divided across North America (the U.S., Canada, and Mexico), Europe (Germany, the UK, France, Italy, Spain, and Rest of Europe), Asia-Pacific (China, India, Japan, South Korea, Australia, and Rest of Asia-Pacific), and LAMEA (Brazil, Argentina, South Africa, and Rest of LAMEA). 
 
Key Market Insights
On the basis of type, the trisodium citrate segment was the dominating segment that accounted for 46.01% of the market share in 2021.
On the basis of application, food & beverages and pharmaceutical were the two most prominent segments in 2021, where food & beverage segment led the market.
On the basis of region, Asia-Pacific is expected to be the fastest-growing region during the forecast period.
 

Overview

The global sodium citrate market size was valued at $813.60 million in 2021 and is estimated to reach $ 1,205.74 million by 2031, registering a CAGR of 4.09% from 2022 to 2031.
Sodium citrate is commercially available in white crystal and crystalline powder forms. It is colorless and odorless and tastes like salt. It is used in various industries as a pH regulator, buffering agent, chelating agent, stabilizer, and emulsifying agent. It is used in the detergent industry to enhance flavor and maintain the stability of active ingredients in food & beverages. It can also be used in fermentation, injection, photography, and metal plating.
Trisodium citrate has the chemical formula Na3C6H5O7. It is a sodium salt of citric acid known as sodium citrate. It has a salty, slightly acidic flavor and is also known as sour salt. Its primary application is as a food ingredient, typically as a flavor enhancer or preservative. It could have both salty and sour club soda flavors. Spherification with highly acidic substances is also permitted because it lowers the acidity of the food. E number E331 refers to the three different types of sodium salts.
Sodium citrate has numerous applications in the food & beverage industry, medical care, and other industries. Sodium citrate is an effective blood anticoagulant. As a result, it is frequently used for blood collection and storage. It can help to alleviate the discomfort associated with urinary tract infections. It can also be used as a laxative and to treat acidosis. It is an important part of the oral rehydration solution of the World Health Organization. It can also be used as an antacid, particularly prior to surgery. Sodium citrate is found in many pharmaceuticals, colors, cosmetics, and deodorants. This ingredient can be found in hair care, oral care, skin care, and bathing products.
Sodium citrate is used as an emulsifying salt in processed cheese products. It allows the cheese to melt without becoming greasy. It acts as a buffering agent, allowing for precise pH regulation in a variety of food & beverages, when combined with citric acid. It prevents milk from curdling. It is employed in the emulsification of oils. Its main purpose is to act as a food additive, either to enhance flavor or to preserve food. In some industries, citric acid is used for cleaning. It helps to remove calcium and rust deposits from steam blocks and hot water systems. It also serves as a buffering and complexing agent in electroplating procedures. The chelating properties of citric acid and its lack of toxicity aid the textile and construction industries. Thus, the wide use of products for different applications is expected to drive market demand.
The rise in demand for vegan cosmetics is likely to open up a new market for sodium citrate producers. Sodium citrate is derived from plants. It is commonly synthesized or derived from plant sources. According to AMR analysis, the global market for vegan cosmetics is expected to be worth $16.6 billion in 2021 and $28.5 billion by 2031. The skincare segment is the most popular and is expected to grow at a CAGR of 5.2%. Concerns about environmental degradation, as well as increased awareness of animal cruelty, are driving the growth of veganism. Veganism is a lifestyle choice that includes clothing and beauty products as well as food. Furthermore, customer demand for plant-based personal care products contributes to market expansion. The growth in popularity of clean, vegan, and cruelty-free beauty products has resulted in novel formulations in skincare, personal care, fragrance, and makeup.
The sodium citrate market is segmented on the basis of type, application, and region. On the basis of type, it is categorized into monosodium citrate, disodium citrate, and trisodium citrate. On the basis of application, it is segmented into food & beverages, pharmaceuticals, cosmetics, soaps and detergents, and others. The food & beverage sub-segment has been further divided into beverages, dairy, meat and fish, jams, jellies, preserves, and others. On the basis of region, the market is divided across North America (the U.S., Canada, and Mexico), Europe (Germany, the UK, France, Italy, Spain, and Rest of Europe), Asia-Pacific (China, India, Japan, South Korea, Australia, and Rest of Asia-Pacific), and LAMEA (Brazil, Argentina, South Africa, and Rest of LAMEA).
Some of the major players analyzed in this report are the Archer-Daniels-Midland Company, Wang Pharmaceuticals and Chemicals, FBC Industries, Inc, Hunan Dongting Citric Acid Chemicals Co. Ltd, Jiangsu Mupro IFT Corp., Cargill Incorporated, Natural Biological Group Co. Ltd., Citribel NV, Huangshi Xinghua Biochemical Co. Ltd., Pan Chem Corporation, Gadot Biochemical Industries Ltd., Jungbunzlauer Suisse AG, Laiwu Taihe Biochemistry Co. Ltd., Fuso Chemical Co. Ltd., and ATPGroup.

Key Benefits For Stakeholders

●This report provides a quantitative analysis of the market segments, current trends, estimations, and dynamics of the sodium citrate market analysis from 2021 to 2031 to identify the prevailing sodium citrate market opportunities.
●The market research is offered along with information related to key drivers, restraints, and opportunities.
●Porter's five forces analysis highlights the potency of buyers and suppliers to enable stakeholders make profit-oriented business decisions and strengthen their supplier-buyer network.
●In-depth analysis of the sodium citrate market segmentation assists to determine the prevailing market opportunities.
●Major countries in each region are mapped according to their revenue contribution to the global market.
●Market player positioning facilitates benchmarking and provides a clear understanding of the present position of the market players.
●The report includes the analysis of the regional as well as global sodium citrate market trends, key players, market segments, application areas, and market growth strategies.
Key Market Segments
○ ATPGrou

Scope of Sodium Citrate Market Report

Report Metric Details
Report Name Sodium Citrate Market
Accounted market size in 2021 $ 813.60 million
Forecasted market size in 2031 $ 1.2 billion
CAGR 4.1%
Base Year 2021
Forecasted years 2024 - 2031
By Type ● Monosodium Citrate
● Disodium Citrate
● Trisodium Citrate
By Application ● Food and Beverages
○ Food and Beverages
○ Beverages
○ Dairy
○ Meat and Fish
○ Jams, Jellies, and Preserves
○ Others
● Pharmaceuticals
● Cosmetics
● Soaps and Detergents
● Others
By Region
  • North America (United States, Canada)
  • Europe (Germany, France, UK, Italy, Russia) Rest of Europe
  • Nordic Countries
  • Asia-Pacific (China, Japan, South Korea)
  • Southeast Asia (India, Australia)
  • Rest of Asia
  • Latin America (Mexico, Brazil)
  • Rest of Latin America
  • Middle East & Africa (Turkey, Saudi Arabia, UAE, Rest of MEA)
Forecast units USD million in value
Report coverage Revenue and volume forecast, company share, competitive landscape, growth factors and trends

FAQ for this report

How fast is Sodium Citrate Market growing?

Ans: The Sodium Citrate Market witnessing a CAGR of 4.1% during the forecast period 2024-2031.

What is the Sodium Citrate Market size in 2031?

Ans: The Sodium Citrate Market size in 2031 will be $ 1.2 billion.

What are the Application segmentation covered in the Sodium Citrate Market report?

Ans: The Applications covered in the Sodium Citrate Market report are ● Food and Beverages, ○ Food and Beverages, ○ Beverages, ○ Dairy, ○ Meat and Fish, ○ Jams, Jellies, and Preserves, ○ Others, ● Pharmaceuticals, ● Cosmetics, ● Soaps and Detergents, ● Others

What are the Type segmentation covered in the Sodium Citrate Market report?

Ans: The Types covered in the Sodium Citrate Market report are ● Monosodium Citrate, ● Disodium Citrate, ● Trisodium Citrate

CHAPTER 1: INTRODUCTION
1.1. Report description
1.2. Key market segments
1.3. Key benefits to the stakeholders
1.4. Research Methodology
1.4.1. Primary research
1.4.2. Secondary research
1.4.3. Analyst tools and models
CHAPTER 2: EXECUTIVE SUMMARY
2.1. CXO Perspective
CHAPTER 3: MARKET OVERVIEW
3.1. Market definition and scope
3.2. Key findings
3.2.1. Top impacting factors
3.2.2. Top investment pockets
3.3. Porter’s five forces analysis
3.3.1. Moderate bargaining power of suppliers
3.3.2. High bargaining power of buyers
3.3.3. Moderate threat of substitutes
3.3.4. Moderate threat of new entrants
3.3.5. High intensity of rivalry
3.4. Market dynamics
3.4.1. Drivers
3.4.1.1. High demand for convenience food
3.4.1.2. Growth of the end-use industries
3.4.2. Restraints
3.4.2.1. Side effects associated with excess consumption
3.4.2.2. Stringent government regulations associated with sodium
3.4.3. Opportunities
3.4.3.1. Increase in use of sodium citrate for detergent application
3.4.3.2. Increase in demand for vegan cosmetics
3.5. COVID-19 Impact Analysis on the market
3.6. Pricing Analysis
3.7. Value Chain Analysis
CHAPTER 4: SODIUM CITRATE MARKET, BY TYPE
4.1. Overview
4.1.1. Market size and forecast
4.2. Monosodium Citrate
4.2.1. Key market trends, growth factors and opportunities
4.2.2. Market size and forecast, by region
4.2.3. Market share analysis by country
4.3. Disodium Citrate
4.3.1. Key market trends, growth factors and opportunities
4.3.2. Market size and forecast, by region
4.3.3. Market share analysis by country
4.4. Trisodium Citrate
4.4.1. Key market trends, growth factors and opportunities
4.4.2. Market size and forecast, by region
4.4.3. Market share analysis by country
CHAPTER 5: SODIUM CITRATE MARKET, BY APPLICATION
5.1. Overview
5.1.1. Market size and forecast
5.2. Food and Beverages
5.2.1. Key market trends, growth factors and opportunities
5.2.2. Market size and forecast, by region
5.2.3. Market share analysis by country
5.2.4. Food and Beverages Sodium Citrate Market by Food and Beverages
5.2.4.1. Beverages Market size and forecast, by region
5.2.4.2. Beverages Market size and forecast, by country
5.2.4.3. Dairy Market size and forecast, by region
5.2.4.4. Dairy Market size and forecast, by country
5.2.4.5. Meat and Fish Market size and forecast, by region
5.2.4.6. Meat and Fish Market size and forecast, by country
5.2.4.7. Jams, Jellies, and Preserves Market size and forecast, by region
5.2.4.8. Jams, Jellies, and Preserves Market size and forecast, by country
5.2.4.9. Others Market size and forecast, by region
5.2.4.10. Others Market size and forecast, by country
5.3. Pharmaceuticals
5.3.1. Key market trends, growth factors and opportunities
5.3.2. Market size and forecast, by region
5.3.3. Market share analysis by country
5.4. Cosmetics
5.4.1. Key market trends, growth factors and opportunities
5.4.2. Market size and forecast, by region
5.4.3. Market share analysis by country
5.5. Soaps and Detergents
5.5.1. Key market trends, growth factors and opportunities
5.5.2. Market size and forecast, by region
5.5.3. Market share analysis by country
5.6. Others
5.6.1. Key market trends, growth factors and opportunities
5.6.2. Market size and forecast, by region
5.6.3. Market share analysis by country
CHAPTER 6: SODIUM CITRATE MARKET, BY REGION
6.1. Overview
6.1.1. Market size and forecast By Region
6.2. North America
6.2.1. Key trends and opportunities
6.2.2. Market size and forecast, by Type
6.2.3. Market size and forecast, by Application
6.2.3.1. North America Food and Beverages Sodium Citrate Market by Food and Beverages
6.2.4. Market size and forecast, by country
6.2.4.1. U.S.
6.2.4.1.1. Key market trends, growth factors and opportunities
6.2.4.1.2. Market size and forecast, by Type
6.2.4.1.3. Market size and forecast, by Application
6.2.4.1.3.1. U.S. Food and Beverages Sodium Citrate Market by Food and Beverages
6.2.4.2. Canada
6.2.4.2.1. Key market trends, growth factors and opportunities
6.2.4.2.2. Market size and forecast, by Type
6.2.4.2.3. Market size and forecast, by Application
6.2.4.2.3.1. Canada Food and Beverages Sodium Citrate Market by Food and Beverages
6.2.4.3. Mexico
6.2.4.3.1. Key market trends, growth factors and opportunities
6.2.4.3.2. Market size and forecast, by Type
6.2.4.3.3. Market size and forecast, by Application
6.2.4.3.3.1. Mexico Food and Beverages Sodium Citrate Market by Food and Beverages
6.3. Europe
6.3.1. Key trends and opportunities
6.3.2. Market size and forecast, by Type
6.3.3. Market size and forecast, by Application
6.3.3.1. Europe Food and Beverages Sodium Citrate Market by Food and Beverages
6.3.4. Market size and forecast, by country
6.3.4.1. Germany
6.3.4.1.1. Key market trends, growth factors and opportunities
6.3.4.1.2. Market size and forecast, by Type
6.3.4.1.3. Market size and forecast, by Application
6.3.4.1.3.1. Germany Food and Beverages Sodium Citrate Market by Food and Beverages
6.3.4.2. France
6.3.4.2.1. Key market trends, growth factors and opportunities
6.3.4.2.2. Market size and forecast, by Type
6.3.4.2.3. Market size and forecast, by Application
6.3.4.2.3.1. France Food and Beverages Sodium Citrate Market by Food and Beverages
6.3.4.3. UK
6.3.4.3.1. Key market trends, growth factors and opportunities
6.3.4.3.2. Market size and forecast, by Type
6.3.4.3.3. Market size and forecast, by Application
6.3.4.3.3.1. UK Food and Beverages Sodium Citrate Market by Food and Beverages
6.3.4.4. Italy
6.3.4.4.1. Key market trends, growth factors and opportunities
6.3.4.4.2. Market size and forecast, by Type
6.3.4.4.3. Market size and forecast, by Application
6.3.4.4.3.1. Italy Food and Beverages Sodium Citrate Market by Food and Beverages
6.3.4.5. Spain
6.3.4.5.1. Key market trends, growth factors and opportunities
6.3.4.5.2. Market size and forecast, by Type
6.3.4.5.3. Market size and forecast, by Application
6.3.4.5.3.1. Spain Food and Beverages Sodium Citrate Market by Food and Beverages
6.3.4.6. Rest of Europe
6.3.4.6.1. Key market trends, growth factors and opportunities
6.3.4.6.2. Market size and forecast, by Type
6.3.4.6.3. Market size and forecast, by Application
6.3.4.6.3.1. Rest of Europe Food and Beverages Sodium Citrate Market by Food and Beverages
6.4. Asia-Pacific
6.4.1. Key trends and opportunities
6.4.2. Market size and forecast, by Type
6.4.3. Market size and forecast, by Application
6.4.3.1. Asia-Pacific Food and Beverages Sodium Citrate Market by Food and Beverages
6.4.4. Market size and forecast, by country
6.4.4.1. China
6.4.4.1.1. Key market trends, growth factors and opportunities
6.4.4.1.2. Market size and forecast, by Type
6.4.4.1.3. Market size and forecast, by Application
6.4.4.1.3.1. China Food and Beverages Sodium Citrate Market by Food and Beverages
6.4.4.2. Japan
6.4.4.2.1. Key market trends, growth factors and opportunities
6.4.4.2.2. Market size and forecast, by Type
6.4.4.2.3. Market size and forecast, by Application
6.4.4.2.3.1. Japan Food and Beverages Sodium Citrate Market by Food and Beverages
6.4.4.3. India
6.4.4.3.1. Key market trends, growth factors and opportunities
6.4.4.3.2. Market size and forecast, by Type
6.4.4.3.3. Market size and forecast, by Application
6.4.4.3.3.1. India Food and Beverages Sodium Citrate Market by Food and Beverages
6.4.4.4. Australia
6.4.4.4.1. Key market trends, growth factors and opportunities
6.4.4.4.2. Market size and forecast, by Type
6.4.4.4.3. Market size and forecast, by Application
6.4.4.4.3.1. Australia Food and Beverages Sodium Citrate Market by Food and Beverages
6.4.4.5. Rest of Asia-Pacific
6.4.4.5.1. Key market trends, growth factors and opportunities
6.4.4.5.2. Market size and forecast, by Type
6.4.4.5.3. Market size and forecast, by Application
6.4.4.5.3.1. Rest of Asia-Pacific Food and Beverages Sodium Citrate Market by Food and Beverages
6.5. LAMEA
6.5.1. Key trends and opportunities
6.5.2. Market size and forecast, by Type
6.5.3. Market size and forecast, by Application
6.5.3.1. LAMEA Food and Beverages Sodium Citrate Market by Food and Beverages
6.5.4. Market size and forecast, by country
6.5.4.1. Brazil
6.5.4.1.1. Key market trends, growth factors and opportunities
6.5.4.1.2. Market size and forecast, by Type
6.5.4.1.3. Market size and forecast, by Application
6.5.4.1.3.1. Brazil Food and Beverages Sodium Citrate Market by Food and Beverages
6.5.4.2. South Africa
6.5.4.2.1. Key market trends, growth factors and opportunities
6.5.4.2.2. Market size and forecast, by Type
6.5.4.2.3. Market size and forecast, by Application
6.5.4.2.3.1. South Africa Food and Beverages Sodium Citrate Market by Food and Beverages
6.5.4.3. Argentina
6.5.4.3.1. Key market trends, growth factors and opportunities
6.5.4.3.2. Market size and forecast, by Type
6.5.4.3.3. Market size and forecast, by Application
6.5.4.3.3.1. Argentina Food and Beverages Sodium Citrate Market by Food and Beverages
6.5.4.4. Saudi Arabia
6.5.4.4.1. Key market trends, growth factors and opportunities
6.5.4.4.2. Market size and forecast, by Type
6.5.4.4.3. Market size and forecast, by Application
6.5.4.4.3.1. Saudi Arabia Food and Beverages Sodium Citrate Market by Food and Beverages
6.5.4.5. Rest of LAMEA
6.5.4.5.1. Key market trends, growth factors and opportunities
6.5.4.5.2. Market size and forecast, by Type
6.5.4.5.3. Market size and forecast, by Application
6.5.4.5.3.1. Rest of LAMEA Food and Beverages Sodium Citrate Market by Food and Beverages
CHAPTER 7: COMPETITIVE LANDSCAPE
7.1. Introduction
7.2. Top winning strategies
7.3. Product Mapping of Top 10 Player
7.4. Competitive Dashboard
7.5. Competitive Heatmap
7.6. Top player positioning, 2021
CHAPTER 8: COMPANY PROFILES
8.1. Archer Daniels Midland Company
8.1.1. Company overview
8.1.2. Key Executives
8.1.3. Company snapshot
8.1.4. Operating business segments
8.1.5. Product portfolio
8.1.6. Business performance
8.2. Cargill, Incorporated
8.2.1. Company overview
8.2.2. Key Executives
8.2.3. Company snapshot
8.2.4. Operating business segments
8.2.5. Product portfolio
8.2.6. Business performance
8.3. Wang Pharmaceuticals and Chemicals
8.3.1. Company overview
8.3.2. Key Executives
8.3.3. Company snapshot
8.3.4. Operating business segments
8.3.5. Product portfolio
8.4. FBC Industries, Inc.
8.4.1. Company overview
8.4.2. Key Executives
8.4.3. Company snapshot
8.4.4. Operating business segments
8.4.5. Product portfolio
8.5. Pan Chem Corporation
8.5.1. Company overview
8.5.2. Key Executives
8.5.3. Company snapshot
8.5.4. Operating business segments
8.5.5. Product portfolio
8.6. Gadot Biochemical Industries Ltd.
8.6.1. Company overview
8.6.2. Key Executives
8.6.3. Company snapshot
8.6.4. Operating business segments
8.6.5. Product portfolio
8.7. Natural Biological Group Co., Ltd.
8.7.1. Company overview
8.7.2. Key Executives
8.7.3. Company snapshot
8.7.4. Operating business segments
8.7.5. Product portfolio
8.8. Jungbunzlauer Suisse AG
8.8.1. Company overview
8.8.2. Key Executives
8.8.3. Company snapshot
8.8.4. Operating business segments
8.8.5. Product portfolio
8.9. Laiwu Taihe Biochemistry Co.,Ltd.
8.9.1. Company overview
8.9.2. Key Executives
8.9.3. Company snapshot
8.9.4. Operating business segments
8.9.5. Product portfolio
8.10. Citribel nv
8.10.1. Company overview
8.10.2. Key Executives
8.10.3. Company snapshot
8.10.4. Operating business segments
8.10.5. Product portfolio
8.11. Jiangsu Mupro IFT Corp.
8.11.1. Company overview
8.11.2. Key Executives
8.11.3. Company snapshot
8.11.4. Operating business segments
8.11.5. Product portfolio
8.12. Hunan Dongting Citric Acid Chemicals Co., Ltd.
8.12.1. Company overview
8.12.2. Key Executives
8.12.3. Company snapshot
8.12.4. Operating business segments
8.12.5. Product portfolio
8.13. Huangshi Xinghua Biochemical Co. Ltd.
8.13.1. Company overview
8.13.2. Key Executives
8.13.3. Company snapshot
8.13.4. Operating business segments
8.13.5. Product portfolio
8.14. FUSO CHEMICAL CO., LTD.
8.14.1. Company overview
8.14.2. Key Executives
8.14.3. Company snapshot
8.14.4. Operating business segments
8.14.5. Product portfolio
8.14.6. Business performance
8.15. ATPGroup
8.15.1. Company overview
8.15.2. Key Executives
8.15.3. Company snapshot
8.15.4. Operating business segments
8.15.5. Product portfoli
LIST OF TABLES
TABLE 01. GLOBAL SODIUM CITRATE MARKET, BY TYPE, 2021-2031 (REVENUE, $MILLION)
TABLE 02. GLOBAL SODIUM CITRATE MARKET, BY TYPE, 2021-2031 (VOLUME, KILOTON)
TABLE 03. SODIUM CITRATE MARKET FOR MONOSODIUM CITRATE, BY REGION, 2021-2031 (REVENUE, $MILLION)
TABLE 04. SODIUM CITRATE MARKET FOR MONOSODIUM CITRATE, BY REGION, 2021-2031 (VOLUME, KILOTON)
TABLE 05. SODIUM CITRATE MARKET FOR DISODIUM CITRATE, BY REGION, 2021-2031 (REVENUE, $MILLION)
TABLE 06. SODIUM CITRATE MARKET FOR DISODIUM CITRATE, BY REGION, 2021-2031 (VOLUME, KILOTON)
TABLE 07. SODIUM CITRATE MARKET FOR TRISODIUM CITRATE, BY REGION, 2021-2031 (REVENUE, $MILLION)
TABLE 08. SODIUM CITRATE MARKET FOR TRISODIUM CITRATE, BY REGION, 2021-2031 (VOLUME, KILOTON)
TABLE 09. GLOBAL SODIUM CITRATE MARKET, BY APPLICATION, 2021-2031 (REVENUE, $MILLION)
TABLE 10. SODIUM CITRATE MARKET FOR FOOD AND BEVERAGES, BY REGION, 2021-2031 (REVENUE, $MILLION)
TABLE 11. GLOBAL FOOD AND BEVERAGES SODIUM CITRATE MARKET, BY FOOD AND BEVERAGES, 2021-2031 (REVENUE, $MILLION)
TABLE 12. SODIUM CITRATE MARKET FOR BEVERAGES, BY REGION, 2021-2031 (REVENUE, $MILLION)
TABLE 13. SODIUM CITRATE MARKET FOR DAIRY, BY REGION, 2021-2031 (REVENUE, $MILLION)
TABLE 14. SODIUM CITRATE MARKET FOR MEAT AND FISH, BY REGION, 2021-2031 (REVENUE, $MILLION)
TABLE 15. SODIUM CITRATE MARKET FOR JAMS, JELLIES, AND PRESERVES, BY REGION, 2021-2031 (REVENUE, $MILLION)
TABLE 16. SODIUM CITRATE MARKET FOR OTHERS, BY REGION, 2021-2031 (REVENUE, $MILLION)
TABLE 17. SODIUM CITRATE MARKET FOR PHARMACEUTICALS, BY REGION, 2021-2031 (REVENUE, $MILLION)
TABLE 18. SODIUM CITRATE MARKET FOR COSMETICS, BY REGION, 2021-2031 (REVENUE, $MILLION)
TABLE 19. SODIUM CITRATE MARKET FOR SOAPS AND DETERGENTS, BY REGION, 2021-2031 (REVENUE, $MILLION)
TABLE 20. SODIUM CITRATE MARKET FOR OTHERS, BY REGION, 2021-2031 (REVENUE, $MILLION)
TABLE 21. SODIUM CITRATE MARKET, BY REGION, 2021-2031 (REVENUE, $MILLION)
TABLE 22. SODIUM CITRATE MARKET, BY REGION, 2021-2031 (VOLUME, KILOTON)
TABLE 23. NORTH AMERICA SODIUM CITRATE MARKET, BY TYPE, 2021-2031 (REVENUE, $MILLION)
TABLE 24. NORTH AMERICA SODIUM CITRATE MARKET, BY TYPE, 2021-2031 (VOLUME, KILOTON)
TABLE 25. NORTH AMERICA SODIUM CITRATE MARKET, BY APPLICATION, 2021-2031 (REVENUE, $MILLION)
TABLE 26. NORTH AMERICA FOOD AND BEVERAGES SODIUM CITRATE MARKET, BY FOOD AND BEVERAGES, 2021-2031 (REVENUE, $MILLION)
TABLE 27. NORTH AMERICA SODIUM CITRATE MARKET, BY COUNTRY, 2021-2031 (REVENUE, $MILLION)
TABLE 28. NORTH AMERICA SODIUM CITRATE MARKET, BY COUNTRY, 2021-2031 (VOLUME, KILOTON)
TABLE 29. U.S. SODIUM CITRATE MARKET, BY TYPE, 2021-2031 (REVENUE, $MILLION)
TABLE 30. U.S. SODIUM CITRATE MARKET, BY TYPE, 2021-2031 (VOLUME, KILOTON)
TABLE 31. U.S. SODIUM CITRATE MARKET, BY APPLICATION, 2021-2031 (REVENUE, $MILLION)
TABLE 32. U.S. FOOD AND BEVERAGES SODIUM CITRATE MARKET, BY FOOD AND BEVERAGES, 2021-2031 (REVENUE, $MILLION)
TABLE 33. CANADA SODIUM CITRATE MARKET, BY TYPE, 2021-2031 (REVENUE, $MILLION)
TABLE 34. CANADA SODIUM CITRATE MARKET, BY TYPE, 2021-2031 (VOLUME, KILOTON)
TABLE 35. CANADA SODIUM CITRATE MARKET, BY APPLICATION, 2021-2031 (REVENUE, $MILLION)
TABLE 36. CANADA FOOD AND BEVERAGES SODIUM CITRATE MARKET, BY FOOD AND BEVERAGES, 2021-2031 (REVENUE, $MILLION)
TABLE 37. MEXICO SODIUM CITRATE MARKET, BY TYPE, 2021-2031 (REVENUE, $MILLION)
TABLE 38. MEXICO SODIUM CITRATE MARKET, BY TYPE, 2021-2031 (VOLUME, KILOTON)
TABLE 39. MEXICO SODIUM CITRATE MARKET, BY APPLICATION, 2021-2031 (REVENUE, $MILLION)
TABLE 40. MEXICO FOOD AND BEVERAGES SODIUM CITRATE MARKET, BY FOOD AND BEVERAGES, 2021-2031 (REVENUE, $MILLION)
TABLE 41. EUROPE SODIUM CITRATE MARKET, BY TYPE, 2021-2031 (REVENUE, $MILLION)
TABLE 42. EUROPE SODIUM CITRATE MARKET, BY TYPE, 2021-2031 (VOLUME, KILOTON)
TABLE 43. EUROPE SODIUM CITRATE MARKET, BY APPLICATION, 2021-2031 (REVENUE, $MILLION)
TABLE 44. EUROPE FOOD AND BEVERAGES SODIUM CITRATE MARKET, BY FOOD AND BEVERAGES, 2021-2031 (REVENUE, $MILLION)
TABLE 45. EUROPE SODIUM CITRATE MARKET, BY COUNTRY, 2021-2031 (REVENUE, $MILLION)
TABLE 46. EUROPE SODIUM CITRATE MARKET, BY COUNTRY, 2021-2031 (VOLUME, KILOTON)
TABLE 47. GERMANY SODIUM CITRATE MARKET, BY TYPE, 2021-2031 (REVENUE, $MILLION)
TABLE 48. GERMANY SODIUM CITRATE MARKET, BY TYPE, 2021-2031 (VOLUME, KILOTON)
TABLE 49. GERMANY SODIUM CITRATE MARKET, BY APPLICATION, 2021-2031 (REVENUE, $MILLION)
TABLE 50. GERMANY FOOD AND BEVERAGES SODIUM CITRATE MARKET, BY FOOD AND BEVERAGES, 2021-2031 (REVENUE, $MILLION)
TABLE 51. FRANCE SODIUM CITRATE MARKET, BY TYPE, 2021-2031 (REVENUE, $MILLION)
TABLE 52. FRANCE SODIUM CITRATE MARKET, BY TYPE, 2021-2031 (VOLUME, KILOTON)
TABLE 53. FRANCE SODIUM CITRATE MARKET, BY APPLICATION, 2021-2031 (REVENUE, $MILLION)
TABLE 54. FRANCE FOOD AND BEVERAGES SODIUM CITRATE MARKET, BY FOOD AND BEVERAGES, 2021-2031 (REVENUE, $MILLION)
TABLE 55. UK SODIUM CITRATE MARKET, BY TYPE, 2021-2031 (REVENUE, $MILLION)
TABLE 56. UK SODIUM CITRATE MARKET, BY TYPE, 2021-2031 (VOLUME, KILOTON)
TABLE 57. UK SODIUM CITRATE MARKET, BY APPLICATION, 2021-2031 (REVENUE, $MILLION)
TABLE 58. UK FOOD AND BEVERAGES SODIUM CITRATE MARKET, BY FOOD AND BEVERAGES, 2021-2031 (REVENUE, $MILLION)
TABLE 59. ITALY SODIUM CITRATE MARKET, BY TYPE, 2021-2031 (REVENUE, $MILLION)
TABLE 60. ITALY SODIUM CITRATE MARKET, BY TYPE, 2021-2031 (VOLUME, KILOTON)
TABLE 61. ITALY SODIUM CITRATE MARKET, BY APPLICATION, 2021-2031 (REVENUE, $MILLION)
TABLE 62. ITALY FOOD AND BEVERAGES SODIUM CITRATE MARKET, BY FOOD AND BEVERAGES, 2021-2031 (REVENUE, $MILLION)
TABLE 63. SPAIN SODIUM CITRATE MARKET, BY TYPE, 2021-2031 (REVENUE, $MILLION)
TABLE 64. SPAIN SODIUM CITRATE MARKET, BY TYPE, 2021-2031 (VOLUME, KILOTON)
TABLE 65. SPAIN SODIUM CITRATE MARKET, BY APPLICATION, 2021-2031 (REVENUE, $MILLION)
TABLE 66. SPAIN FOOD AND BEVERAGES SODIUM CITRATE MARKET, BY FOOD AND BEVERAGES, 2021-2031 (REVENUE, $MILLION)
TABLE 67. REST OF EUROPE SODIUM CITRATE MARKET, BY TYPE, 2021-2031 (REVENUE, $MILLION)
TABLE 68. REST OF EUROPE SODIUM CITRATE MARKET, BY TYPE, 2021-2031 (VOLUME, KILOTON)
TABLE 69. REST OF EUROPE SODIUM CITRATE MARKET, BY APPLICATION, 2021-2031 (REVENUE, $MILLION)
TABLE 70. REST OF EUROPE FOOD AND BEVERAGES SODIUM CITRATE MARKET, BY FOOD AND BEVERAGES, 2021-2031 (REVENUE, $MILLION)
TABLE 71. ASIA-PACIFIC SODIUM CITRATE MARKET, BY TYPE, 2021-2031 (REVENUE, $MILLION)
TABLE 72. ASIA-PACIFIC SODIUM CITRATE MARKET, BY TYPE, 2021-2031 (VOLUME, KILOTON)
TABLE 73. ASIA-PACIFIC SODIUM CITRATE MARKET, BY APPLICATION, 2021-2031 (REVENUE, $MILLION)
TABLE 74. ASIA-PACIFIC FOOD AND BEVERAGES SODIUM CITRATE MARKET, BY FOOD AND BEVERAGES, 2021-2031 (REVENUE, $MILLION)
TABLE 75. ASIA-PACIFIC SODIUM CITRATE MARKET, BY COUNTRY, 2021-2031 (REVENUE, $MILLION)
TABLE 76. ASIA-PACIFIC SODIUM CITRATE MARKET, BY COUNTRY, 2021-2031 (VOLUME, KILOTON)
TABLE 77. CHINA SODIUM CITRATE MARKET, BY TYPE, 2021-2031 (REVENUE, $MILLION)
TABLE 78. CHINA SODIUM CITRATE MARKET, BY TYPE, 2021-2031 (VOLUME, KILOTON)
TABLE 79. CHINA SODIUM CITRATE MARKET, BY APPLICATION, 2021-2031 (REVENUE, $MILLION)
TABLE 80. CHINA FOOD AND BEVERAGES SODIUM CITRATE MARKET, BY FOOD AND BEVERAGES, 2021-2031 (REVENUE, $MILLION)
TABLE 81. JAPAN SODIUM CITRATE MARKET, BY TYPE, 2021-2031 (REVENUE, $MILLION)
TABLE 82. JAPAN SODIUM CITRATE MARKET, BY TYPE, 2021-2031 (VOLUME, KILOTON)
TABLE 83. JAPAN SODIUM CITRATE MARKET, BY APPLICATION, 2021-2031 (REVENUE, $MILLION)
TABLE 84. JAPAN FOOD AND BEVERAGES SODIUM CITRATE MARKET, BY FOOD AND BEVERAGES, 2021-2031 (REVENUE, $MILLION)
TABLE 85. INDIA SODIUM CITRATE MARKET, BY TYPE, 2021-2031 (REVENUE, $MILLION)
TABLE 86. INDIA SODIUM CITRATE MARKET, BY TYPE, 2021-2031 (VOLUME, KILOTON)
TABLE 87. INDIA SODIUM CITRATE MARKET, BY APPLICATION, 2021-2031 (REVENUE, $MILLION)
TABLE 88. INDIA FOOD AND BEVERAGES SODIUM CITRATE MARKET, BY FOOD AND BEVERAGES, 2021-2031 (REVENUE, $MILLION)
TABLE 89. AUSTRALIA SODIUM CITRATE MARKET, BY TYPE, 2021-2031 (REVENUE, $MILLION)
TABLE 90. AUSTRALIA SODIUM CITRATE MARKET, BY TYPE, 2021-2031 (VOLUME, KILOTON)
TABLE 91. AUSTRALIA SODIUM CITRATE MARKET, BY APPLICATION, 2021-2031 (REVENUE, $MILLION)
TABLE 92. AUSTRALIA FOOD AND BEVERAGES SODIUM CITRATE MARKET, BY FOOD AND BEVERAGES, 2021-2031 (REVENUE, $MILLION)
TABLE 93. REST OF ASIA-PACIFIC SODIUM CITRATE MARKET, BY TYPE, 2021-2031 (REVENUE, $MILLION)
TABLE 94. REST OF ASIA-PACIFIC SODIUM CITRATE MARKET, BY TYPE, 2021-2031 (VOLUME, KILOTON)
TABLE 95. REST OF ASIA-PACIFIC SODIUM CITRATE MARKET, BY APPLICATION, 2021-2031 (REVENUE, $MILLION)
TABLE 96. REST OF ASIA-PACIFIC FOOD AND BEVERAGES SODIUM CITRATE MARKET, BY FOOD AND BEVERAGES, 2021-2031 (REVENUE, $MILLION)
TABLE 97. LAMEA SODIUM CITRATE MARKET, BY TYPE, 2021-2031 (REVENUE, $MILLION)
TABLE 98. LAMEA SODIUM CITRATE MARKET, BY TYPE, 2021-2031 (VOLUME, KILOTON)
TABLE 99. LAMEA SODIUM CITRATE MARKET, BY APPLICATION, 2021-2031 (REVENUE, $MILLION)
TABLE 100. LAMEA FOOD AND BEVERAGES SODIUM CITRATE MARKET, BY FOOD AND BEVERAGES, 2021-2031 (REVENUE, $MILLION)
TABLE 101. LAMEA SODIUM CITRATE MARKET, BY COUNTRY, 2021-2031 (REVENUE, $MILLION)
TABLE 102. LAMEA SODIUM CITRATE MARKET, BY COUNTRY, 2021-2031 (VOLUME, KILOTON)
TABLE 103. BRAZIL SODIUM CITRATE MARKET, BY TYPE, 2021-2031 (REVENUE, $MILLION)
TABLE 104. BRAZIL SODIUM CITRATE MARKET, BY TYPE, 2021-2031 (VOLUME, KILOTON)
TABLE 105. BRAZIL SODIUM CITRATE MARKET, BY APPLICATION, 2021-2031 (REVENUE, $MILLION)
TABLE 106. BRAZIL FOOD AND BEVERAGES SODIUM CITRATE MARKET, BY FOOD AND BEVERAGES, 2021-2031 (REVENUE, $MILLION)
TABLE 107. SOUTH AFRICA SODIUM CITRATE MARKET, BY TYPE, 2021-2031 (REVENUE, $MILLION)
TABLE 108. SOUTH AFRICA SODIUM CITRATE MARKET, BY TYPE, 2021-2031 (VOLUME, KILOTON)
TABLE 109. SOUTH AFRICA SODIUM CITRATE MARKET, BY APPLICATION, 2021-2031 (REVENUE, $MILLION)
TABLE 110. SOUTH AFRICA FOOD AND BEVERAGES SODIUM CITRATE MARKET, BY FOOD AND BEVERAGES, 2021-2031 (REVENUE, $MILLION)
TABLE 111. ARGENTINA SODIUM CITRATE MARKET, BY TYPE, 2021-2031 (REVENUE, $MILLION)
TABLE 112. ARGENTINA SODIUM CITRATE MARKET, BY TYPE, 2021-2031 (VOLUME, KILOTON)
TABLE 113. ARGENTINA SODIUM CITRATE MARKET, BY APPLICATION, 2021-2031 (REVENUE, $MILLION)
TABLE 114. ARGENTINA FOOD AND BEVERAGES SODIUM CITRATE MARKET, BY FOOD AND BEVERAGES, 2021-2031 (REVENUE, $MILLION)
TABLE 115. SAUDI ARABIA SODIUM CITRATE MARKET, BY TYPE, 2021-2031 (REVENUE, $MILLION)
TABLE 116. SAUDI ARABIA SODIUM CITRATE MARKET, BY TYPE, 2021-2031 (VOLUME, KILOTON)
TABLE 117. SAUDI ARABIA SODIUM CITRATE MARKET, BY APPLICATION, 2021-2031 (REVENUE, $MILLION)
TABLE 118. SAUDI ARABIA FOOD AND BEVERAGES SODIUM CITRATE MARKET, BY FOOD AND BEVERAGES, 2021-2031 (REVENUE, $MILLION)
TABLE 119. REST OF LAMEA SODIUM CITRATE MARKET, BY TYPE, 2021-2031 (REVENUE, $MILLION)
TABLE 120. REST OF LAMEA SODIUM CITRATE MARKET, BY TYPE, 2021-2031 (VOLUME, KILOTON)
TABLE 121. REST OF LAMEA SODIUM CITRATE MARKET, BY APPLICATION, 2021-2031 (REVENUE, $MILLION)
TABLE 122. REST OF LAMEA FOOD AND BEVERAGES SODIUM CITRATE MARKET, BY FOOD AND BEVERAGES, 2021-2031 (REVENUE, $MILLION)
TABLE 123. ARCHER DANIELS MIDLAND COMPANY: KEY EXECUTIVES
TABLE 124. ARCHER DANIELS MIDLAND COMPANY: COMPANY SNAPSHOT
TABLE 125. ARCHER DANIELS MIDLAND COMPANY: PRODUCT SEGMENTS
TABLE 126. ARCHER DANIELS MIDLAND COMPANY: PRODUCT PORTFOLIO
TABLE 127. CARGILL, INCORPORATED: KEY EXECUTIVES
TABLE 128. CARGILL, INCORPORATED: COMPANY SNAPSHOT
TABLE 129. CARGILL, INCORPORATED: PRODUCT SEGMENTS
TABLE 130. CARGILL, INCORPORATED: PRODUCT PORTFOLIO
TABLE 131. WANG PHARMACEUTICALS AND CHEMICALS: KEY EXECUTIVES
TABLE 132. WANG PHARMACEUTICALS AND CHEMICALS: COMPANY SNAPSHOT
TABLE 133. WANG PHARMACEUTICALS AND CHEMICALS: PRODUCT SEGMENTS
TABLE 134. WANG PHARMACEUTICALS AND CHEMICALS: PRODUCT PORTFOLIO
TABLE 135. FBC INDUSTRIES, INC.: KEY EXECUTIVES
TABLE 136. FBC INDUSTRIES, INC.: COMPANY SNAPSHOT
TABLE 137. FBC INDUSTRIES, INC.: PRODUCT SEGMENTS
TABLE 138. FBC INDUSTRIES, INC.: PRODUCT PORTFOLIO
TABLE 139. PAN CHEM CORPORATION: KEY EXECUTIVES
TABLE 140. PAN CHEM CORPORATION: COMPANY SNAPSHOT
TABLE 141. PAN CHEM CORPORATION: PRODUCT SEGMENTS
TABLE 142. PAN CHEM CORPORATION: PRODUCT PORTFOLIO
TABLE 143. GADOT BIOCHEMICAL INDUSTRIES LTD.: KEY EXECUTIVES
TABLE 144. GADOT BIOCHEMICAL INDUSTRIES LTD.: COMPANY SNAPSHOT
TABLE 145. GADOT BIOCHEMICAL INDUSTRIES LTD.: PRODUCT SEGMENTS
TABLE 146. GADOT BIOCHEMICAL INDUSTRIES LTD.: PRODUCT PORTFOLIO
TABLE 147. NATURAL BIOLOGICAL GROUP CO., LTD.: KEY EXECUTIVES
TABLE 148. NATURAL BIOLOGICAL GROUP CO., LTD.: COMPANY SNAPSHOT
TABLE 149. NATURAL BIOLOGICAL GROUP CO., LTD.: PRODUCT SEGMENTS
TABLE 150. NATURAL BIOLOGICAL GROUP CO., LTD.: PRODUCT PORTFOLIO
TABLE 151. JUNGBUNZLAUER SUISSE AG: KEY EXECUTIVES
TABLE 152. JUNGBUNZLAUER SUISSE AG: COMPANY SNAPSHOT
TABLE 153. JUNGBUNZLAUER SUISSE AG: PRODUCT SEGMENTS
TABLE 154. JUNGBUNZLAUER SUISSE AG: PRODUCT PORTFOLIO
TABLE 155. LAIWU TAIHE BIOCHEMISTRY CO.,LTD.: KEY EXECUTIVES
TABLE 156. LAIWU TAIHE BIOCHEMISTRY CO.,LTD.: COMPANY SNAPSHOT
TABLE 157. LAIWU TAIHE BIOCHEMISTRY CO.,LTD.: PRODUCT SEGMENTS
TABLE 158. LAIWU TAIHE BIOCHEMISTRY CO.,LTD.: PRODUCT PORTFOLIO
TABLE 159. CITRIBEL NV: KEY EXECUTIVES
TABLE 160. CITRIBEL NV: COMPANY SNAPSHOT
TABLE 161. CITRIBEL NV: PRODUCT SEGMENTS
TABLE 162. CITRIBEL NV: PRODUCT PORTFOLIO
TABLE 163. JIANGSU MUPRO IFT CORP.: KEY EXECUTIVES
TABLE 164. JIANGSU MUPRO IFT CORP.: COMPANY SNAPSHOT
TABLE 165. JIANGSU MUPRO IFT CORP.: PRODUCT SEGMENTS
TABLE 166. JIANGSU MUPRO IFT CORP.: PRODUCT PORTFOLIO
TABLE 167. HUNAN DONGTING CITRIC ACID CHEMICALS CO., LTD.: KEY EXECUTIVES
TABLE 168. HUNAN DONGTING CITRIC ACID CHEMICALS CO., LTD.: COMPANY SNAPSHOT
TABLE 169. HUNAN DONGTING CITRIC ACID CHEMICALS CO., LTD.: PRODUCT SEGMENTS
TABLE 170. HUNAN DONGTING CITRIC ACID CHEMICALS CO., LTD.: PRODUCT PORTFOLIO
TABLE 171. HUANGSHI XINGHUA BIOCHEMICAL CO. LTD.: KEY EXECUTIVES
TABLE 172. HUANGSHI XINGHUA BIOCHEMICAL CO. LTD.: COMPANY SNAPSHOT
TABLE 173. HUANGSHI XINGHUA BIOCHEMICAL CO. LTD.: PRODUCT SEGMENTS
TABLE 174. HUANGSHI XINGHUA BIOCHEMICAL CO. LTD.: PRODUCT PORTFOLIO
TABLE 175. FUSO CHEMICAL CO., LTD.: KEY EXECUTIVES
TABLE 176. FUSO CHEMICAL CO., LTD.: COMPANY SNAPSHOT
TABLE 177. FUSO CHEMICAL CO., LTD.: PRODUCT SEGMENTS
TABLE 178. FUSO CHEMICAL CO., LTD.: PRODUCT PORTFOLIO
TABLE 179. ATPGROUP: KEY EXECUTIVES
TABLE 180. ATPGROUP: COMPANY SNAPSHOT
TABLE 181. ATPGROUP: PRODUCT SEGMENTS
TABLE 182. ATPGROUP: PRODUCT PORTFOLIO LIST OF FIGURES
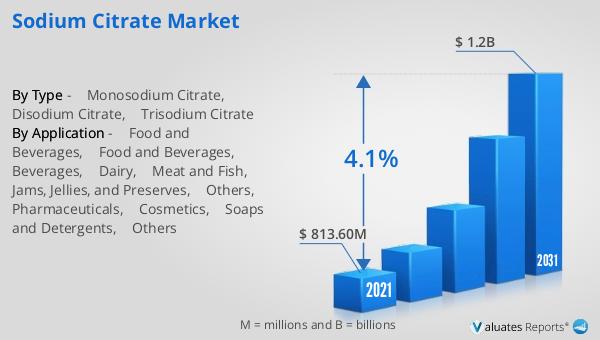
FIGURE 01. SODIUM CITRATE MARKET, 2021-2031
FIGURE 02. SEGMENTATION OF SODIUM CITRATE MARKET, 2021-2031
FIGURE 03. TOP INVESTMENT POCKETS IN SODIUM CITRATE MARKET (2022-2031)
FIGURE 04. MODERATE BARGAINING POWER OF SUPPLIERS
FIGURE 05. HIGH BARGAINING POWER OF BUYERS
FIGURE 06. MODERATE THREAT OF SUBSTITUTES
FIGURE 07. MODERATE THREAT OF NEW ENTRANTS
FIGURE 08. HIGH INTENSITY OF RIVALRY
FIGURE 09. DRIVERS, RESTRAINTS AND OPPORTUNITIES: GLOBALSODIUM CITRATE MARKET
FIGURE 10. PRICING ANALYSIS: SODIUM CITRATE MARKET 2021 AND 2031
FIGURE 11. VALUE CHAIN ANALYSIS: SODIUM CITRATE MARKET
FIGURE 12. SODIUM CITRATE MARKET, BY TYPE, 2021(%)
FIGURE 13. COMPARATIVE SHARE ANALYSIS OF SODIUM CITRATE MARKET FOR MONOSODIUM CITRATE, BY COUNTRY 2021-2031(%)
FIGURE 14. COMPARATIVE SHARE ANALYSIS OF SODIUM CITRATE MARKET FOR DISODIUM CITRATE, BY COUNTRY 2021-2031(%)
FIGURE 15. COMPARATIVE SHARE ANALYSIS OF SODIUM CITRATE MARKET FOR TRISODIUM CITRATE, BY COUNTRY 2021-2031(%)
FIGURE 16. SODIUM CITRATE MARKET, BY APPLICATION, 2021(%)
FIGURE 17. COMPARATIVE SHARE ANALYSIS OF SODIUM CITRATE MARKET FOR FOOD AND BEVERAGES, BY COUNTRY 2021-2031(%)
FIGURE 18. COMPARATIVE SHARE ANALYSIS OF SODIUM CITRATE MARKET FOR PHARMACEUTICALS, BY COUNTRY 2021-2031(%)
FIGURE 19. COMPARATIVE SHARE ANALYSIS OF SODIUM CITRATE MARKET FOR COSMETICS, BY COUNTRY 2021-2031(%)
FIGURE 20. COMPARATIVE SHARE ANALYSIS OF SODIUM CITRATE MARKET FOR SOAPS AND DETERGENTS, BY COUNTRY 2021-2031(%)
FIGURE 21. COMPARATIVE SHARE ANALYSIS OF SODIUM CITRATE MARKET FOR OTHERS, BY COUNTRY 2021-2031(%)
FIGURE 22. SODIUM CITRATE MARKET BY REGION, 2021
FIGURE 23. U.S. SODIUM CITRATE MARKET, 2021-2031 ($MILLION)
FIGURE 24. CANADA SODIUM CITRATE MARKET, 2021-2031 ($MILLION)
FIGURE 25. MEXICO SODIUM CITRATE MARKET, 2021-2031 ($MILLION)
FIGURE 26. GERMANY SODIUM CITRATE MARKET, 2021-2031 ($MILLION)
FIGURE 27. FRANCE SODIUM CITRATE MARKET, 2021-2031 ($MILLION)
FIGURE 28. UK SODIUM CITRATE MARKET, 2021-2031 ($MILLION)
FIGURE 29. ITALY SODIUM CITRATE MARKET, 2021-2031 ($MILLION)
FIGURE 30. SPAIN SODIUM CITRATE MARKET, 2021-2031 ($MILLION)
FIGURE 31. REST OF EUROPE SODIUM CITRATE MARKET, 2021-2031 ($MILLION)
FIGURE 32. CHINA SODIUM CITRATE MARKET, 2021-2031 ($MILLION)
FIGURE 33. JAPAN SODIUM CITRATE MARKET, 2021-2031 ($MILLION)
FIGURE 34. INDIA SODIUM CITRATE MARKET, 2021-2031 ($MILLION)
FIGURE 35. AUSTRALIA SODIUM CITRATE MARKET, 2021-2031 ($MILLION)
FIGURE 36. REST OF ASIA-PACIFIC SODIUM CITRATE MARKET, 2021-2031 ($MILLION)
FIGURE 37. BRAZIL SODIUM CITRATE MARKET, 2021-2031 ($MILLION)
FIGURE 38. SOUTH AFRICA SODIUM CITRATE MARKET, 2021-2031 ($MILLION)
FIGURE 39. ARGENTINA SODIUM CITRATE MARKET, 2021-2031 ($MILLION)
FIGURE 40. SAUDI ARABIA SODIUM CITRATE MARKET, 2021-2031 ($MILLION)
FIGURE 41. REST OF LAMEA SODIUM CITRATE MARKET, 2021-2031 ($MILLION)
FIGURE 42. TOP WINNING STRATEGIES, BY YEAR
FIGURE 43. TOP WINNING STRATEGIES, BY DEVELOPMENT
FIGURE 44. TOP WINNING STRATEGIES, BY COMPANY
FIGURE 45. PRODUCT MAPPING OF TOP 10 PLAYERS
FIGURE 46. COMPETITIVE DASHBOARD
FIGURE 47. COMPETITIVE HEATMAP: SODIUM CITRATE MARKET
FIGURE 48. TOP PLAYER POSITIONING, 2021
FIGURE 49. ARCHER DANIELS MIDLAND COMPANY: NET REVENUE, 2019-2021 ($MILLION)
FIGURE 50. ARCHER DANIELS MIDLAND COMPANY: RESEARCH & DEVELOPMENT EXPENDITURE, 2019-2021
FIGURE 51. ARCHER DANIELS MIDLAND COMPANY: REVENUE SHARE BY SEGMENT, 2021 (%)
FIGURE 52. ARCHER DANIELS MIDLAND COMPANY: REVENUE SHARE BY REGION, 2021 (%)
FIGURE 53. CARGILL, INCORPORATED: NET REVENUE, 2019-2021 ($MILLION)
FIGURE 54. FUSO CHEMICAL CO., LTD.: NET REVENUE, 2020-2022 ($MILLION
SELECT A FORMAT
Added to Cart
Electronic (PDF)

$5730

This license allows only one user to access the PDF.
Electronic (PDF)

$6450

This license allows 1 - 5 user to access the PDF, license is suitable for small groups of 5 users working together
Electronic (PDF)

$9600

This license allows users/teams in a same Enterprise to use this report, various departments within an enterpise can use this report
Electronic (PDF)

$3840

This license just provides quantitative data in a excel sheet
Add to Cart
Buy Now (15% Discount)

OUR CUSTOMER

SecuX Technology Inc

SIMILAR REPORTS


RELATED REPORTS

Global Alzheimer’s Agitation Clinical Treatment Market Research Report 2024

120 Pages
Type: Report
Code: QYRE-Auto-9K12557
Thu May 16 00:00:00 UTC 2024

Add to Cart

Global Therapeutic Drug Monitoring (TDM) Service Market Research Report 2024

120 Pages
Type: Report
Code: QYRE-Auto-27Y12877
Tue May 14 00:00:00 UTC 2024

Add to Cart

Global Valley Fever Medication Market Research Report 2024

120 Pages
Type: Report
Code: QYRE-Auto-7F11880
Tue May 14 00:00:00 UTC 2024

Add to Cart

Global Multi-Dose Medication Carts Market Research Report 2024

120 Pages
Type: Report
Code: QYRE-Auto-4Q10748
Tue May 14 00:00:00 UTC 2024

Add to Cart