
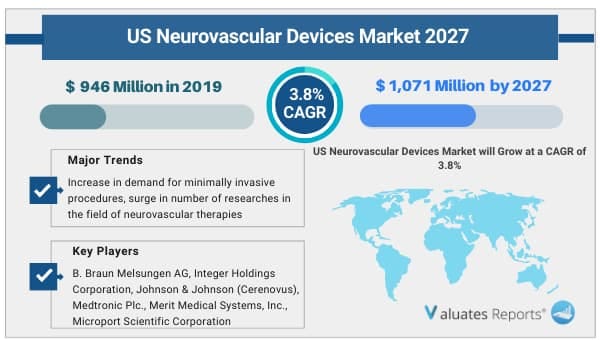
The U.S. neurovascular devices market was valued at USD 946 Million in 2019, and is projected to reach USD 1,071 Million by 2027, registering a CAGR of 3.8% from 2020 to 2027.
Neurological devices mainly use minimally invasive, image guided technology to treat complex as well as hazardous diseases of brain, neck, and spine. The neurovascular devices are used for the treatment of various neurovascular diseases including aneurysm, arteriovenous malformation, ischemic stroke, stenosis, and others. There are different types of neurovascular devices available in the market. These include embolization devices, revascularization devices, thrombectomy devices, embolic protection devices, and accessory devices. Moreover, some of the neurovascular devices used in embolization procedure include aneurysm clips, embolic coils, coil assist stent, and others. For instance, embolic coils are used in coil embolization, which is a minimally invasive procedure that involves treatment of aneurysm by filling the sac with coils to reduce risk of bleeding.
Rise in prevalence of neurovascular diseases, increase in demand for minimally invasive procedures, surge in number of researches in the field of neurovascular therapies, increase in awareness among neurosurgeons about minimally invasive surgical procedures, ongoing product development & commercialization are the major factors that drive growth of the U.S. neurovascular devices market. In addition, favorable medical reimbursements, rise in demand for effective neurovascular devices, surge in geriatric population, technological advancements related to neurovascular devices, and rise in incidences of brain/cerebral aneurysm are some other factors that contribute toward growth of the market. However, high cost of neurovascular devices restricts the growth of the U.S. neurovascular devices market. Conversely, surge in demand for minimally invasive procedures in the U.S provides lucrative opportunities for players operating in the neurovascular devices market.
The World Health Organization (WHO) on January 30, 2020 declared COVID-19 outbreak a public health emergency of international concern. COVID-19 has affected around 210 countries across the globe. Nationwide lockdown, government regulations, and continuous increase in infection rate across the country created a widespread financial impact on neurology hospitals and clinics. Large number of hospitals and clinics have witnessed a drop in number of patient visits amid COVID-19 ultimately reducing client contact. Furthermore, many neurovascular treatments have been delayed due to the Covid-19 crisis. In order to free-up limited space for people being treated for the virus, hospitals across U.S. have cancelled, or postponed, many elective operations especially those deemed to be non-essential or non-urgent. Thus, limited availability of medical care for conditions other than COVID-19 within the country has impacted the neurovascular market in a negative manner. At the same time, limited availability of healthcare staff across the country is another factor, which has an undesirable effect on the U.S. neurovascular devices market
The U.S. neurovascular devices market is segmented on the basis of product and disease pathology to provide a detailed assessment of the market. By product, the market is divided into embolization devices, revascularization devices, thrombectomy devices, embolic protection devices, and accessory devices. The embolization devices are further sub-segmented into clippings, embolic coils, coil assist stents, and coil assist balloon. In addition, the embolic coils segment is further divided into bare detachable coils and coated detachable coils. The revascularization device segment is further divided into carotid artery stents and flow diversion stents. The thrombectomy devices segment is divided into clot retrieval devices, suction & aspiration devices, and snares. The embolic protection devices segment is divided in distal filter devices and balloon occlusion devices. Similarly, the accessory devices segment is divided into microcatheters, and micro guidewires. By disease pathology, the market is classified into aneurysm, arteriovenous malformation, ischemic stroke, stenosis, and others.
Presently, on the basis of product, the embolization devices segment is the major revenue contributor, and is projected to grow significantly during the forecast period. Increase in adoption of embolization devices, surge in prevalence of neurovascular diseases, rise in R&D investment, increase in geriatric population, introduction of technologically advanced products, and surge in launch of new and advanced neurovascular devices are the key factors that boost the growth of the segment.
Depending on disease pathology, the aneurysm segment is the major shareholder in the U.S. neurovascular devices market, owing to surge in prevalence of the aneurysm, increase in demand for minimally invasive neurosurgical procedures, government initiatives to modernize healthcare infrastructure, technological advancement in neurovascular treatments, and increase in product approvals of new devices used in the treatment of aneurysm.
The key players profiled in this report include B. Braun Melsungen AG, Integer Holdings Corporation, Johnson & Johnson (Cerenovus), Medtronic Plc., Merit Medical Systems, Inc., Microport Scientific Corporation, Penumbra, Inc., SAES Getters SpA (Memry Corporation), Stryker Corporation, and Terumo Corporation (Microvention, Inc.).
CHAPTER 1:INTRODUCTION
1.1.Report description
1.2.Key benefits for stakeholders
1.3.Key market segments
1.3.1.List of key players profiled in the report
1.4.Research methodology
1.4.1.Secondary research
1.4.2.Primary research
1.4.3.Analyst tools and models
CHAPTER 2:EXECUTIVE SUMMARY
2.1.Key findings of the study
2.2.CXO perspective
CHAPTER 3:MARKET OVERVIEW
3.1.Market definition and scope
3.2.Key findings
3.2.1.Top Wining Strategies
3.2.2.Top investment pockets
3.3.Key forces shaping neurovascular devices industry/market
3.4.Market dynamics
3.4.1.Drivers
3.4.1.1.Growth in prevalence of neurovascular diseases
3.4.1.2.Upsurge in geriatric population across the U.S.
3.4.1.3.Technological developments associated with neurovascular devices
3.4.1.4.Rise in incidence of underlying disease conditions serve as risk neurovascular diseases
3.4.2.Restraint
3.4.2.1.High cost of neurovascular devices
3.4.3.Opportunity
3.4.3.1.Surge in demand for minimally invasive procedures in U.S.
3.4.4.Impact Analyses
3.5.COVID-19 Impact analysis on the market
CHAPTER 4:U.S. NEUROVASCULAR DEVICES MARKET, BY PRODUCT
4.1.Overview
4.1.1.Market size and forecast
4.2.Embolization devices
4.2.1.Key market trends, growth factors, and opportunities
4.2.2.Market size and forecast
4.2.3.Market size and forecast, by type
4.2.3.1.Clippings
4.2.3.1.1.Market size and forecast
4.2.3.2.Embolic Coils
4.2.3.2.1.Market size and forecast
4.2.3.2.2.Bare Detachable Coils
4.2.3.2.2.1.Market size and forecast
4.2.3.2.3.Coated Detachable Coil
4.2.3.2.3.1.Market size and forecast
4.2.3.3.Coil assist stent
4.2.3.3.1.Market size and forecast
4.2.3.4.Coil assist balloon
4.2.3.4.1.Market size and forecast
4.3.Revascularization devices
4.3.1.Key market trends, growth factors, and opportunities
4.3.2.Market size and forecast
4.3.3.Market size and forecast, by type
4.3.3.1.Carotid artery stents
4.3.3.1.1.Market size and forecast
4.3.3.2.Flow diversion stents
4.3.3.2.1.Market size and forecast
4.4.Thrombectomy devices
4.4.1.Key market trends, growth factors, and opportunities
4.4.2.Market size and forecast
4.4.3.Market size and forecast, by type
4.4.3.1.Clot Retrieval Devices
4.4.3.1.1.Market size and forecast
4.4.3.2.Suction and Aspiration Devices
4.4.3.2.1.Market size and forecast
4.4.3.3.Snares
4.4.3.3.1.Market size and forecast
4.5.Embolic protection devices
4.5.1.Key market trends, growth factors, and opportunities
4.5.2.Market size and forecast
4.5.3.Market size and forecast, by type
4.5.3.1.Distal filter devices
4.5.3.1.1.Market size and forecast
4.5.3.2.Balloon Occlusion Devices
4.5.3.2.1.Market size and forecast
4.6.Accessory devices
4.6.1.Key market trends, growth factors, and opportunities
4.6.2.Market size and forecast
4.6.3.Market size and forecast, by type
4.6.3.1.Microcatheters
4.6.3.1.1.Market size and forecast
4.6.3.2.Microguidewires
4.6.3.2.1.Market size and forecast
CHAPTER 5:NEUROVASCULAR DEVICES MARKET, BY DISEASE PATHOLOGY
5.1.Overview
5.1.1.Market size and forecast
5.2.Aneurysm
5.2.1.Market size and forecast
5.3.Arteriovenous malformation
5.3.1.Market size and forecast
5.4.Ischemic stroke
5.4.1.Market size and forecast
5.5.Stenosis
5.5.1.Market size and forecast
5.6.Others
5.6.1.Market size and forecast
CHAPTER 6:COMPANY PROFILES
6.1.B. BRAUN MELSUNGEN AG
6.1.1.Company overview
6.1.2.Company snapshot
6.1.3.Operating business segments
6.1.4.Product portfolio
6.1.5.Business performance
6.2.INTEGER HOLDINGS CORPORATION
6.2.1.Company overview
6.2.2.Company snapshot
6.2.3.Operating business segments
6.2.4.Product portfolio
6.2.5.Business performance
6.2.6.Key strategic moves and developments
6.3.JOHNSON & JOHNSON (CERENOVUS)
6.3.1.Company overview
6.3.2.Company snapshot
6.3.3.Operating business segments
6.3.4.Product portfolio
6.3.5.Business performance
6.3.6.Key strategic moves and developments
6.4.MEDTRONIC PLC.
6.4.1.Company overview
6.4.2.Company snapshot
6.4.3.Operating business segments
6.4.4.Product portfolio
6.4.5.Business performance
6.4.6.Key strategic moves and developments
6.5.MERIT MEDICAL SYSTEMS, INC.
6.5.1.Company overview
6.5.2.Company snapshot
6.5.3.Operating business segments
6.5.4.Product portfolio
6.5.5.Business performance
6.6.MICROPORT SCIENTIFIC CORPORATION
6.6.1.Company overview
6.6.2.Company snapshot
6.6.3.Operating business segments
6.6.4.Product portfolio
6.6.5.Business performance
6.7.PENUMBRA, INC.
6.7.1.Company overview
6.7.2.Company snapshot
6.7.3.Operating business segments
6.7.4.Product portfolio
6.7.5.Business performance
6.8.SAES GETTERS S.P.A. (MEMRY CORPORATION)
6.8.1.Company overview
6.8.2.Company snapshot
6.8.3.Operating business segments
6.8.4.Product portfolio
6.8.5.Business performance
6.9.STRYKER CORPORATION
6.9.1.Company overview
6.9.2.Company snapshot
6.9.3.Operating business segments
6.9.4.Product portfolio
6.9.5.Business performance
6.9.6.Key strategic moves and developments
6.10.TERUMO CORPORATION (MICROVENTION, INC.)
6.10.1.Company overview
6.10.2.Company snapshot
6.10.3.Operating business segments
6.10.4.Product portfolio
6.10.5.Business performance
6.10.6.Key strategic moves and developments
LIST OF TABLES
TABLE 01.HYPERTENSION AND DIABETES IN U.S.
TABLE 02.U.S. NEUROVASCULAR DEVICES MARKET, BY PRODUCT, 2019-2027 ($MILLION)
TABLE 03.EMBOLIZATION DEVICES, BY TYPE 2019–2027($MILLION)
TABLE 04.EMBOLIC COIL MARKET, BY TYPE 2019–2027($MILLION)
TABLE 05.U.S. REVASCULARIZATION DEVICES MARKET, BY TYPE 2019–2027($MILLION)
TABLE 06.U.S THROMBECTOMY DEVICES MARKET, BY TYPE 2019–2027($MILLION)
TABLE 07.U.S. EMBOLIC PROTECTION DEVICES MARKET, BY TYPE 2019–2027($MILLION)
TABLE 08.U.S ACCESSORY DEVICES MARKET, BY TYPE 2019–2027($MILLION)
TABLE 09.NEUROVASCULAR DEVICES MARKET, BY DISEASE PATHOLOGY, 2019–2027 ($MILLION)
TABLE 10.B. BRAUN: COMPANY SNAPSHOT
TABLE 11.B. BRAUN: OPERATING SEGMENTS
TABLE 12.B. BRAUN: PRODUCT PORTFOLIO
TABLE 13.INTEGER: COMPANY SNAPSHOT
TABLE 14.INTEGER: OPERATING SEGMENTS
TABLE 15.INTEGER: PRODUCT PORTFOLIO
TABLE 16.J&J: COMPANY SNAPSHOT
TABLE 17.J&J: OPERATING SEGMENTS
TABLE 18.J&J: PRODUCT PORTFOLIO
TABLE 19.MEDTRONIC: COMPANY SNAPSHOT
TABLE 20.MEDTRONIC: OPERATING SEGMENTS
TABLE 21.MEDTRONIC: PRODUCT PORTFOLIO
TABLE 22.MERIT MEDICAL SYSTEMS: COMPANY SNAPSHOT
TABLE 23.MERIT MEDICAL SYSTEMS: OERATING SEGMENT
TABLE 24.MERIT MEDICAL SYSTEMS: PRODUCT PORTFOLIO
TABLE 25.MICROPORT: COMPANY SNAPSHOT
TABLE 26.MICROPORT: OPERATING SEGMENTS
TABLE 27.MICROPORT: PRODUCT PORTFOLIO
TABLE 28.PENUMBRA: COMPANY SNAPSHOT
TABLE 29.PENUMBRA: OPERATING SEGMENTS
TABLE 30.PENUMBRA: PRODUCT PORTFOLIO
TABLE 31.SAES GETTERS: COMPANY SNAPSHOT
TABLE 32.SAES GETTERS: OERATING SEGMENT
TABLE 33.SAES GETTERS: PRODUCT PORTFOLIO
TABLE 34.STRYKER: COMPANY SNAPSHOT
TABLE 35.STRYKER: OPERATING SEGMENTS
TABLE 36.STRYKER: PRODUCT PORTFOLIO
TABLE 37.TERUMO: COMPANY SNAPSHOT
TABLE 38.TERUMO: OERATING SEGMENT
TABLE 39.TERUMO: PRODUCT PORTFOLIO
LIST OF FIGURES
FIGURE 01.U.S. NEUROVASCULAR DEVICES MARKET SEGMENTATION
FIGURE 02.TOP WINNING STRATEGIES (2018–2020)
FIGURE 03.TOP WINNING STRATEGIES: PERCENTAGE DISTRIBUTION, (2018–2020)
FIGURE 04.DETAILED STRUCTURE OF COMPANIES AND TYPE OF STRATEGIES
FIGURE 05.TOP INVESTMENT POCKETS
FIGURE 06.HIGH BARGAINING POWER OF SUPPLIER
FIGURE 07.MODERATE BARGAINING POWER OF BUYERS
FIGURE 08.HIGH THREAT OF SUBSTITUTES
FIGURE 09.MODERATE INTENSITY OF RIVALRYS
FIGURE 10.LOW THREAT OF NEW ENTRANTS
FIGURE 11.CRUDE STROKE PREVALENCE (%), 2012–2030
FIGURE 12.GERIATRIC POPULATION (MILLIONS), U.S.
FIGURE 13.IMPACT ANALYSES: U.S. NEUROVASCULAR DEVICES MARKET
FIGURE 14.U.S. EMBOLIZATION DEVICES MARKET, 2019–2027 ($MILLION)
FIGURE 15.CLIPPINGS MARKET, 2019–2027 ($MILLION)
FIGURE 16.BARE DETATCHABLE COIL MARKET, 2019–2027 ($MILLION)
FIGURE 17.COATED DETATCHABLE MARKET, 2019–2027 ($MILLION)
FIGURE 18.COIL ASSIST STENTS MARKET, 2019–2027 ($MILLION)
FIGURE 19.COIL ASSIST BALLOON MARKET, 2019–2027 ($MILLION)
FIGURE 20.U.S REVASCULARIZATION DEVICES MARKET, 2019–2027 ($MILLION)
FIGURE 21.CAROTID ARTERY STENT MARKET, 2019–2027 ($MILLION)
FIGURE 22.FLOW DIVERSION STENT MARKET, 2019–2027 ($MILLION)
FIGURE 23.U.S. THROMBECTOMY DEVICES MARKET, 2019–2027 ($MILLION)
FIGURE 24.CLOT RETRIEVAL DEVICES MARKET, 2019–2027 ($MILLION)
FIGURE 25.SUCTION AND ASPIRATION DEVICES MARKET, 2019–2027 ($MILLION)
FIGURE 26.SNARES MARKET, 2019–2027 ($MILLION)
FIGURE 27.U.S. EMBOLIC PROTECTION DEVICES MARKET, 2019–2027 ($MILLION)
FIGURE 28.DISTAL FILTER DEVICES MARKET, 2019–2027 ($MILLION)
FIGURE 29.BALLOON OCCLUSION DEVICES MARKET, 2019–2027 ($MILLION)
FIGURE 30.U.S. ACCESSORY DEVICES MARKET, 2019–2027 ($MILLION)
FIGURE 31.MICROCATHETERS DEVICES MARKET, 2019–2027 ($MILLION)
FIGURE 32.MICROGUIDEWIRES DEVICES MARKET, 2019–2027 ($MILLION)
FIGURE 33.U.S. ANEURYSM MARKET, 2019–2027 ($MILLION)
FIGURE 34.U.S. ARTERIOVENOUS MALFORMATION MARKET, 2019–2027 ($MILLION)
FIGURE 35.U.S. ISCHEMIC STROKE MARKET, 2019–2027 ($MILLION)
FIGURE 36.U.S. STENOSIS MARKET, 2019–2027 ($MILLION)
FIGURE 37.U.S. OTHERS MARKET, 2019–2027 ($MILLION)
FIGURE 38.B.BRAUN: NET SALES, 2017–2019 ($MILLION)
FIGURE 39.B.BRAUN: REVENUE SHARE, BY SEGMENT, 2019 (%)
FIGURE 40.B.BRAUN: REVENUE SHARE, BY REGION, 2019 (%)
FIGURE 41.INTEGER: NET SALES, 2017–2019 ($MILLION)
FIGURE 42.INTEGER: REVENUE SHARE, BY SEGMENT, 2019 (%)
FIGURE 43.INTEGER: REVENUE SHARE, BY REGION, 2019(%)
FIGURE 44.J&J: NET SALES, 2017–2019 ($MILLION)
FIGURE 45.J&J: REVENUE SHARE, BY SEGMENT, 2019 (%)
FIGURE 46.J&J: REVENUE SHARE, BY REGION, 2019 (%)
FIGURE 47.MEDTRONIC: NET SALES, 2017–2019 ($MILLION)
FIGURE 48.MEDTRONIC REVENUE SHARE, BY SEGMENTS, 2019 (%)
FIGURE 49.MEDTRONIC PLC: REVENUE SHARE, BY REGIONS, 2019 (%)
FIGURE 50.MERIT MEDICAL SYSTEMS: NET SALES, 2017–2019 ($MILLION)
FIGURE 51.MERIT MEDICAL SYSTEMS: REVENUE SHARE BY SEGMENT, 2019 (%)
FIGURE 52.MERIT MEDICAL SYSTEMS: REVENUE SHARE BY REGION, 2019 (%)
FIGURE 53.MICROPORT: NET SALES, 2017–2019 ($MILLION)
FIGURE 54.MICROPORT: REVENUE SHARE, BY SEGMENT, 2019 (%)
FIGURE 55.MICROPORT: REVENUE SHARE, BY REGION, 2019 (%)
FIGURE 56.PENUMBRA: NET SALES, 2017–2019 ($MILLION)
FIGURE 57.PENUMBRA: REVENUE SHARE, BY SEGMENT, 2019 (%)
FIGURE 58.PENUMBRA: REVENUE SHARE, BY REGION, 2019(%)
FIGURE 59.SAES GETTERS: NET SALES, 2017–2019 ($MILLION)
FIGURE 60.SAES GETTERS: REVENUE SHARE BY SEGMENT, 2019 (%)
FIGURE 61.STRYKER: NET SALES, 2017–2019 ($MILLION)
FIGURE 62.STRYKER: REVENUE SHARE, BY SEGMENT, 2019(%)
FIGURE 63.STRYKER: REVENUE SHARE, BY REGION, 2019(%)
FIGURE 64.TERUMO: NET SALES, 2017–2019 ($MILLION)
FIGURE 65.TERUMO: REVENUE SHARE, BY SEGMENT, 2019 (%)
FIGURE 66.TERUMO: REVENUE SHARE, BY REGION, 2019 (%)
$2762
$3423
$4331
HAVE A QUERY?
OUR CUSTOMER

SIMILAR REPORTS