List of Tables
Table 1. Lock Washer Market Trends
Table 2. Lock Washer Market Drivers & Opportunity
Table 3. Lock Washer Market Challenges
Table 4. Lock Washer Market Restraints
Table 5. Global Lock Washer Revenue by Company (2019-2024) & (US$ Million)
Table 6. Global Lock Washer Revenue Market Share by Company (2019-2024)
Table 7. Global Lock Washer Sales Volume by Company (2019-2024) & (K Units)
Table 8. Global Lock Washer Sales Volume Market Share by Company (2019-2024)
Table 9. Global Market Lock Washer Price by Company (2019-2024) & (USD/Unit)
Table 10. Key Manufacturers Lock Washer Manufacturing Base Distribution and Headquarters
Table 11. Key Manufacturers Lock Washer Product Type
Table 12. Key Manufacturers Time to Begin Mass Production of Lock Washer
Table 13. Global Lock Washer Manufacturers Market Concentration Ratio (CR5 and HHI)
Table 14. Global Top Manufacturers Market Share by Company Type (Tier 1, Tier 2, and Tier 3) & (based on the Revenue in Lock Washer as of 2023)
Table 15. Mergers & Acquisitions, Expansion Plans
Table 16. Global Lock Washer Sales Value by Type: 2019 VS 2023 VS 2030 (US$ Million)
Table 17. Global Lock Washer Sales Value by Type (2019-2024) & (US$ Million)
Table 18. Global Lock Washer Sales Value by Type (2025-2030) & (US$ Million)
Table 19. Global Lock Washer Sales Market Share in Value by Type (2019-2024) & (%)
Table 20. Global Lock Washer Sales Market Share in Value by Type (2025-2030) & (%)
Table 21. Global Lock Washer Sales Volume by Type: 2019 VS 2023 VS 2030 (K Units)
Table 22. Global Lock Washer Sales Volume by Type (2019-2024) & (K Units)
Table 23. Global Lock Washer Sales Volume by Type (2025-2030) & (K Units)
Table 24. Global Lock Washer Sales Market Share in Volume by Type (2019-2024) & (%)
Table 25. Global Lock Washer Sales Market Share in Volume by Type (2025-2030) & (%)
Table 26. Global Lock Washer Price by Type (2019-2024) & (USD/Unit)
Table 27. Global Lock Washer Price by Type (2025-2030) & (USD/Unit)
Table 28. Global Lock Washer Sales Value by Application: 2019 VS 2023 VS 2030 (US$ Million)
Table 29. Global Lock Washer Sales Value by Application (2019-2024) & (US$ Million)
Table 30. Global Lock Washer Sales Value by Application (2025-2030) & (US$ Million)
Table 31. Global Lock Washer Sales Market Share in Value by Application (2019-2024) & (%)
Table 32. Global Lock Washer Sales Market Share in Value by Application (2025-2030) & (%)
Table 33. Global Lock Washer Sales Volume by Application: 2019 VS 2023 VS 2030 (K Units)
Table 34. Global Lock Washer Sales Volume by Application (2019-2024) & (K Units)
Table 35. Global Lock Washer Sales Volume by Application (2025-2030) & (K Units)
Table 36. Global Lock Washer Sales Market Share in Volume by Application (2019-2024) & (%)
Table 37. Global Lock Washer Sales Market Share in Volume by Application (2025-2030) & (%)
Table 38. Global Lock Washer Price by Application (2019-2024) & (USD/Unit)
Table 39. Global Lock Washer Price by Application (2025-2030) & (USD/Unit)
Table 40. Global Lock Washer Sales Value by Region: 2019 VS 2023 VS 2030 (US$ Million)
Table 41. Global Lock Washer Sales Value by Region (2019-2024) & (US$ Million)
Table 42. Global Lock Washer Sales Value by Region (2025-2030) & (US$ Million)
Table 43. Global Lock Washer Sales Value by Region (2019-2024) & (%)
Table 44. Global Lock Washer Sales Value by Region (2025-2030) & (%)
Table 45. Global Lock Washer Sales Volume by Region (K Units): 2019 VS 2023 VS 2030
Table 46. Global Lock Washer Sales Volume by Region (2019-2024) & (K Units)
Table 47. Global Lock Washer Sales Volume by Region (2025-2030) & (K Units)
Table 48. Global Lock Washer Sales Volume by Region (2019-2024) & (%)
Table 49. Global Lock Washer Sales Volume by Region (2025-2030) & (%)
Table 50. Global Lock Washer Average Price by Region (2019-2024) & (USD/Unit)
Table 51. Global Lock Washer Average Price by Region (2025-2030) & (USD/Unit)
Table 52. Key Countries/Regions Lock Washer Sales Value Growth Trends, (US$ Million): 2019 VS 2023 VS 2030
Table 53. Key Countries/Regions Lock Washer Sales Value, (2019-2024) & (US$ Million)
Table 54. Key Countries/Regions Lock Washer Sales Value, (2025-2030) & (US$ Million)
Table 55. Key Countries/Regions Lock Washer Sales Volume, (2019-2024) & (K Units)
Table 56. Key Countries/Regions Lock Washer Sales Volume, (2025-2030) & (K Units)
Table 57. NORD-LOCK Company Information
Table 58. NORD-LOCK Introduction and Business Overview
Table 59. NORD-LOCK Lock Washer Sales (K Units), Revenue (US$ Million), Price (USD/Unit) and Gross Margin (2019-2024)
Table 60. NORD-LOCK Lock Washer Product Offerings
Table 61. NORD-LOCK Recent Development
Table 62. Disc-Lock Company Information
Table 63. Disc-Lock Introduction and Business Overview
Table 64. Disc-Lock Lock Washer Sales (K Units), Revenue (US$ Million), Price (USD/Unit) and Gross Margin (2019-2024)
Table 65. Disc-Lock Lock Washer Product Offerings
Table 66. Disc-Lock Recent Development
Table 67. Schnorr Company Information
Table 68. Schnorr Introduction and Business Overview
Table 69. Schnorr Lock Washer Sales (K Units), Revenue (US$ Million), Price (USD/Unit) and Gross Margin (2019-2024)
Table 70. Schnorr Lock Washer Product Offerings
Table 71. Schnorr Recent Development
Table 72. Shakeproof Company Information
Table 73. Shakeproof Introduction and Business Overview
Table 74. Shakeproof Lock Washer Sales (K Units), Revenue (US$ Million), Price (USD/Unit) and Gross Margin (2019-2024)
Table 75. Shakeproof Lock Washer Product Offerings
Table 76. Shakeproof Recent Development
Table 77. Tiger-Tight Company Information
Table 78. Tiger-Tight Introduction and Business Overview
Table 79. Tiger-Tight Lock Washer Sales (K Units), Revenue (US$ Million), Price (USD/Unit) and Gross Margin (2019-2024)
Table 80. Tiger-Tight Lock Washer Product Offerings
Table 81. Tiger-Tight Recent Development
Table 82. Midwest Acorn Nut Company Information
Table 83. Midwest Acorn Nut Introduction and Business Overview
Table 84. Midwest Acorn Nut Lock Washer Sales (K Units), Revenue (US$ Million), Price (USD/Unit) and Gross Margin (2019-2024)
Table 85. Midwest Acorn Nut Lock Washer Product Offerings
Table 86. Midwest Acorn Nut Recent Development
Table 87. Earnest Company Information
Table 88. Earnest Introduction and Business Overview
Table 89. Earnest Lock Washer Sales (K Units), Revenue (US$ Million), Price (USD/Unit) and Gross Margin (2019-2024)
Table 90. Earnest Lock Washer Product Offerings
Table 91. Earnest Recent Development
Table 92. HEICO-LOCK Company Information
Table 93. HEICO-LOCK Introduction and Business Overview
Table 94. HEICO-LOCK Lock Washer Sales (K Units), Revenue (US$ Million), Price (USD/Unit) and Gross Margin (2019-2024)
Table 95. HEICO-LOCK Lock Washer Product Offerings
Table 96. HEICO-LOCK Recent Development
Table 97. Shinedason Company Information
Table 98. Shinedason Introduction and Business Overview
Table 99. Shinedason Lock Washer Sales (K Units), Revenue (US$ Million), Price (USD/Unit) and Gross Margin (2019-2024)
Table 100. Shinedason Lock Washer Product Offerings
Table 101. Shinedason Recent Development
Table 102. Titan Fasteners Company Information
Table 103. Titan Fasteners Introduction and Business Overview
Table 104. Titan Fasteners Lock Washer Sales (K Units), Revenue (US$ Million), Price (USD/Unit) and Gross Margin (2019-2024)
Table 105. Titan Fasteners Lock Washer Product Offerings
Table 106. Titan Fasteners Recent Development
Table 107. Key Raw Materials Lists
Table 108. Raw Materials Key Suppliers Lists
Table 109. Lock Washer Downstream Customers
Table 110. Lock Washer Distributors List
Table 111. Research Programs/Design for This Report
Table 112. Key Data Information from Secondary Sources
Table 113. Key Data Information from Primary Sources
List of Figures
Figure 1. Lock Washer Product Picture
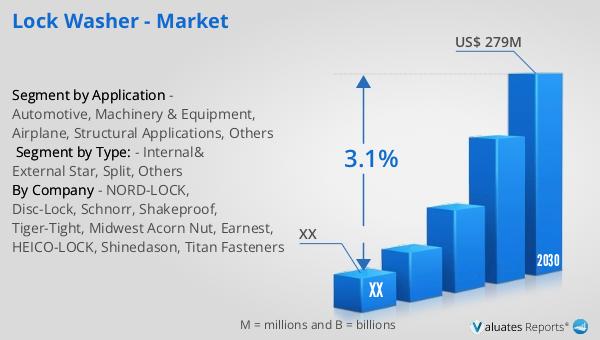
Figure 2. Global Lock Washer Sales Value, 2019 VS 2023 VS 2030 (US$ Million)
Figure 3. Global Lock Washer Sales Value (2019-2030) & (US$ Million)
Figure 4. Global Lock Washer Sales Volume (2019-2030) & (K Units)
Figure 5. Global Lock Washer Sales Price (2019-2030) & (USD/Unit)
Figure 6. Lock Washer Report Years Considered
Figure 7. Global Lock Washer Players Revenue Ranking (2023) & (US$ Million)
Figure 8. Global Lock Washer Players Sales Volume Ranking (2023) & (K Units)
Figure 9. The 5 and 10 Largest Manufacturers in the World: Market Share by Lock Washer Revenue in 2023
Figure 10. Lock Washer Market Share by Company Type (Tier 1, Tier 2, and Tier 3): 2019 VS 2023
Figure 11. Internal& External Star Picture
Figure 12. Split Picture
Figure 13. Others Picture
Figure 14. Global Lock Washer Sales Value by Type (2019 VS 2023 VS 2030) & (US$ Million)
Figure 15. Global Lock Washer Sales Value Market Share by Type, 2023 & 2030
Figure 16. Global Lock Washer Sales Volume by Type (2019 VS 2023 VS 2030) & (K Units)
Figure 17. Global Lock Washer Sales Volume Market Share by Type, 2023 & 2030
Figure 18. Global Lock Washer Price by Type (2019-2030) & (USD/Unit)
Figure 19. Product Picture of Automotive
Figure 20. Product Picture of Machinery & Equipment
Figure 21. Product Picture of Airplane
Figure 22. Product Picture of Structural Applications
Figure 23. Product Picture of Others
Figure 24. Global Lock Washer Sales Value by Application (2019 VS 2023 VS 2030) & (US$ Million)
Figure 25. Global Lock Washer Sales Value Market Share by Application, 2023 & 2030
Figure 26. Global Lock Washer Sales Volume by Application (2019 VS 2023 VS 2030) & (K Units)
Figure 27. Global Lock Washer Sales Volume Market Share by Application, 2023 & 2030
Figure 28. Global Lock Washer Price by Application (2019-2030) & (USD/Unit)
Figure 29. North America Lock Washer Sales Value (2019-2030) & (US$ Million)
Figure 30. North America Lock Washer Sales Value by Country (%), 2023 VS 2030
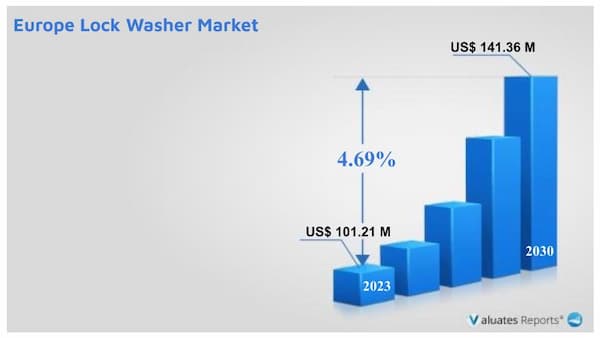
Figure 31. Europe Lock Washer Sales Value (2019-2030) & (US$ Million)
Figure 32. Europe Lock Washer Sales Value by Country (%), 2023 VS 2030
Figure 33. Asia Pacific Lock Washer Sales Value (2019-2030) & (US$ Million)
Figure 34. Asia Pacific Lock Washer Sales Value by Country (%), 2023 VS 2030
Figure 35. South America Lock Washer Sales Value (2019-2030) & (US$ Million)
Figure 36. South America Lock Washer Sales Value by Country (%), 2023 VS 2030
Figure 37. Middle East & Africa Lock Washer Sales Value (2019-2030) & (US$ Million)
Figure 38. Middle East & Africa Lock Washer Sales Value by Country (%), 2023 VS 2030
Figure 39. Key Countries/Regions Lock Washer Sales Value (%), (2019-2030)
Figure 40. Key Countries/Regions Lock Washer Sales Volume (%), (2019-2030)
Figure 41. United States Lock Washer Sales Value, (2019-2030) & (US$ Million)
Figure 42. United States Lock Washer Sales Value by Type (%), 2023 VS 2030
Figure 43. United States Lock Washer Sales Value by Application (%), 2023 VS 2030
Figure 44. Europe Lock Washer Sales Value, (2019-2030) & (US$ Million)
Figure 45. Europe Lock Washer Sales Value by Type (%), 2023 VS 2030
Figure 46. Europe Lock Washer Sales Value by Application (%), 2023 VS 2030
Figure 47. China Lock Washer Sales Value, (2019-2030) & (US$ Million)
Figure 48. China Lock Washer Sales Value by Type (%), 2023 VS 2030
Figure 49. China Lock Washer Sales Value by Application (%), 2023 VS 2030
Figure 50. Japan Lock Washer Sales Value, (2019-2030) & (US$ Million)
Figure 51. Japan Lock Washer Sales Value by Type (%), 2023 VS 2030
Figure 52. Japan Lock Washer Sales Value by Application (%), 2023 VS 2030
Figure 53. South Korea Lock Washer Sales Value, (2019-2030) & (US$ Million)
Figure 54. South Korea Lock Washer Sales Value by Type (%), 2023 VS 2030
Figure 55. South Korea Lock Washer Sales Value by Application (%), 2023 VS 2030
Figure 56. Southeast Asia Lock Washer Sales Value, (2019-2030) & (US$ Million)
Figure 57. Southeast Asia Lock Washer Sales Value by Type (%), 2023 VS 2030
Figure 58. Southeast Asia Lock Washer Sales Value by Application (%), 2023 VS 2030
Figure 59. India Lock Washer Sales Value, (2019-2030) & (US$ Million)
Figure 60. India Lock Washer Sales Value by Type (%), 2023 VS 2030
Figure 61. India Lock Washer Sales Value by Application (%), 2023 VS 2030
Figure 62. Lock Washer Industrial Chain
Figure 63. Lock Washer Manufacturing Cost Structure
Figure 64. Channels of Distribution (Direct Sales, and Distribution)
Figure 65. Bottom-up and Top-down Approaches for This Report
Figure 66. Data Triangulation
Figure 67. Key Executives Interviewed