
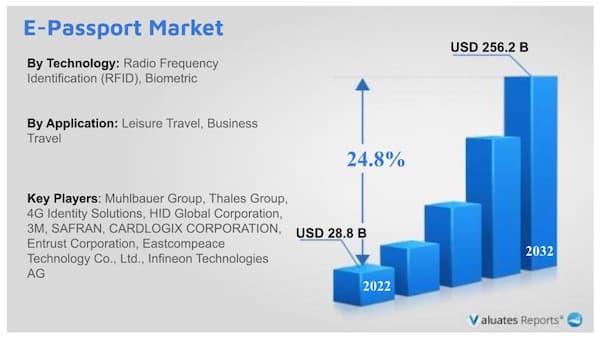
The global e-passport market was valued at $28.8 billion in 2022, and is projected to reach $256.2 billion by 2032, growing at a CAGR of 24.8% from 2023 to 2032. The increasing number of people traveling to cross-border destinations will drive the growth of the e-passport market.
Rise in advanced verification technology to detect identity frauds and presence of advanced airport infrastructure among developing nations are some the important factors that propel the e-passport market across the globe. In addition, increase in number of people traveling to cross-border destinations propels the global e-passport market growth. However, high implementation cost restrict growth of the market. On the contrary, increase in adoption of wireless communication technology among the travel industry is expected to offer remunerative opportunities for expansion of the global market during the forecast period.
The radio frequency identification (RFID) segment dominated the e-passport industry in 2022, owing to increase in deployment of RFID chip that enabled e-passport services among developing nations such as China, Japan, and India. However, biometric segment is expected to grow at a significant CAGR during the forecast period, owing to reduction in threat of identity frauds and increase in need to improve security of personal information of travelers.
Region-wise, the e-passport market share was dominated by Europe in 2022, and is expected to retain its position during the forecast period. This is attributed to presence of advance airport infrastructure in the UK and Germany and rise in use of smartphones during travelling. However, Asia-Pacific is expected to witness a significant growth rate during the forecast period, owing to increase in demand among developing nations, rise in favorable government policies regarding e-passport across the region, and introduction of e-passport smart gates at airports across various developing countries.
The key players operating in the global e-passport industry include 3M, 4G Identity Solutions, LLC, CardLogix Corporation, Eastcompeace Technology Co., Ltd., Entrust Corporation, HID Global Corporation, Infineon Technologies AG, Muhlbauer Group, Safran, and Thales Group. These players have adopted various strategies to increase their market penetration and strengthen their foothold in the e-passport market industry.
Key Benefits:
E-passport industry offer a high level of security and are equipped with advanced features, such as biometric authentication, digital signatures, and encryption, which make them much harder to forge or tamper with. This has made E-passports a preferred choice for governments worldwide as they provide a more secure and reliable way of verifying a traveler's identity. E-passports allow for more efficient and streamlined border control procedures, reducing wait times and enhancing the overall travel experience for passengers.
Moreover, they enable seamless integration with other government systems and databases, such as immigration and law enforcement, providing real-time access to crucial information that can help prevent security breaches and facilitate border management. With the rise of international terrorism and organized crime, governments and international organizations have been seeking new ways to enhance security measures and prevent fraudulent activities that drive growth in increasing security concerns. As many countries continue to invest in advanced security technologies and upgrade their border control systems, the demand for E-passports in the global e-passport market size is expected to grow during the forecast period.
End User Adoption:
October 2021: Rocket Mortgage, part of Rocket Companies formed a partnership with Salesforce, an American cloud-based software company. Under this partnership, the company aimed to provide mortgage origination technology to credit unions, banks, and other financial institutions through the financial services cloud of Salesforce. Rocket Mortgage along with Salesforce enabled credit unions and banks to offer personalized and fast customer experiences all through the complete loan process.
November 2022: Ally Bank introduced Ally Everyday Cash Back Mastercard, Ally Platinum Mastercard, and Ally Unlimited Cash Back Mastercard, three cards accessible by invitation only. Ally Everyday Cash Back Mastercard is a spending card that can be used with rewards, Ally Unlimited Cash Back Mastercard provides a flat 2% rate of cash back on all purchases, and Ally Platinum Mastercard enhances the credit and offers a higher line of credit, so the users will appreciate the automatic credit line reviews of the card.
December 2021: Ally Financial acquired Fair Square Financial, a company that provides digital-first credit cards. With this acquisition, the company aimed to enhance its range of consumer products. The acquisition also supported the company's target of being the leading full-service digital bank by incorporating the credit risk improvement and targeting services of Fair Square.
Top Impacting Factors:
Rise in advanced verification means to detect identity frauds
Companies manufacturing e-passport have added a range of additional electronic and visual security features to fight identity fraud and to increase security of personal information of travelers, which enhances growth of the market. In addition, increase in introduction of microprocessor-based passports and rapid adoption of advance microprocessor-based passport services across developed nations to increase convenience of travelers drives growth of the market. For instance, in January 2022, the Ministry of External Affairs launched microchip-based electronic passports for its citizens. The main features of the new system include the use of biometrics and artificial intelligence in passport relay services, to ensure smooth movement of citizens at all immigration posts globally. Moreover, integration of advance technology such as machine learning and artificial intelligence in e-passport have improved speed of detecting fraudulent cases in documents of travelers, which drives the e-passport market across the globe.
Presence of advanced airport infrastructure
Increase in investments by governments and private organizations to develop advance airport infrastructure across developing nations of Asia-Pacific and LAMEA countries drives growth of the market. In addition, various countries across the globe are deploying advance technologies such as biometric passport technology, geographic information system, and facial recognition technology to identify frauds and threats at airports. Furthermore, several airport development companies have been using digital technologies to improve operational performance and efficiency at airports. For instance, TAV Technologies, one of the leading management technology providers to airline industries have been using IoT technology to collect biometric data of all passengers from simple sensor devices, smartphones, and wearable connected devices. Thus, such developments across developing as well as developed nations drives growth of the market.
Restraints
High implementation cost
Innovative e-passport technology is manufactured with highly configurable data management tools, which facilitates validation, recording, updating, retrieval, certifying, and issuance of documents to citizens. This is attributed to increase in implementation cost of e-passport technology. In addition, presence of limited number of e-passport provider companies across Asia-Pacific and high cost of electronic chips and biometric sensors across the region hampers growth of the market of in this region. Furthermore, several e-passport providers have been manufacturing e-passport technology with advanced magnetic tape cards, which increases overall cost of e-passports, which, in turn, hampers growth of the market.
Opportunities
Increase in development of wireless communication technology
Increase in integration of wireless technologies such as smart card in e-passport, which offers airline industries numerous benefits such as improvement in security of biometric information such as palm scan, iris scan, fingerprints, and digital signature is expected to enhance growth of the market in the future. In addition, radio-frequency identification (RFID) reader and radio-frequency identification (RFID) tag use in e-passport technology to automatically track and identify traveler information such as name, date of birth, age and address provides lucrative opportunities for the market growth. Furthermore, radio frequency signal is integrated in e-passport technology to securely transfer travel information to airline companies, which propels the growth of the e-passport market.
Technological Advancement
Several airport companies have been using advance technologies such as augmented reality, artificial intelligence, and beacons technology to streamline their business process and to improve their revenue. For instance, in November 2022, IDEMIA launched all-new flagship travel document to showcase its most innovative security features and capacity to offer unique yet secure designs, allowing customers to better understand the extent of IDEMIA’s expertise and know-how in the conception, design, and production of innovative passports. Most airports across the UK, Germany, and France have been using blockchain technologies to improve operational efficiencies, security systems, and customer experiences, which provides lucrative opportunities for the market. For instance, Air France, one of the leading airline service providers across France have been using blockchain technology to securely store personal information of travelers such as name, date of birth, age, and address. In addition, biometrics technology is being used at airports to streamline check-in process of customers and to provide a more seamless airport international travelling services, which provides ample opportunities for the e-passport market.
| Report Metric | Details |
| Report Name | Global E-Passport Market |
| Base Year | 2022 |
| Forecasted years | 2023-2032 |
| By Company | Muhlbauer Group, Thales Group, 4G Identity Solutions, HID Global Corporation, 3M, SAFRAN, CARDLOGIX CORPORATION, Entrust Corporation, Eastcompeace Technology Co., Ltd., Infineon Technologies AG |
| Segment by Type |
|
| Segment by Application |
|
| Consumption by Region |
|
| Forecast units | USD million in value |
| Report coverage | Revenue and volume forecast, company share, competitive landscape, growth factors and trends |
LIST OF TABLES
TABLE 01. GLOBAL E-PASSPORT MARKET, BY TECHNOLOGY, 2022-2032 ($MILLION)
TABLE 02. E-PASSPORT MARKET FOR RADIO FREQUENCY IDENTIFICATION (RFID), BY REGION, 2022-2032 ($MILLION)
TABLE 03. E-PASSPORT MARKET FOR BIOMETRIC, BY REGION, 2022-2032 ($MILLION)
TABLE 04. GLOBAL E-PASSPORT MARKET, BY APPLICATION, 2022-2032 ($MILLION)
TABLE 05. E-PASSPORT MARKET FOR LEISURE TRAVEL, BY REGION, 2022-2032 ($MILLION)
TABLE 06. E-PASSPORT MARKET FOR BUSINESS TRAVEL, BY REGION, 2022-2032 ($MILLION)
TABLE 07. E-PASSPORT MARKET, BY REGION, 2022-2032 ($MILLION)
TABLE 08. NORTH AMERICA E-PASSPORT MARKET, BY TECHNOLOGY, 2022-2032 ($MILLION)
TABLE 09. NORTH AMERICA E-PASSPORT MARKET, BY APPLICATION, 2022-2032 ($MILLION)
TABLE 10. NORTH AMERICA E-PASSPORT MARKET, BY COUNTRY, 2022-2032 ($MILLION)
TABLE 11. U.S. E-PASSPORT MARKET, BY TECHNOLOGY, 2022-2032 ($MILLION)
TABLE 12. U.S. E-PASSPORT MARKET, BY APPLICATION, 2022-2032 ($MILLION)
TABLE 13. CANADA E-PASSPORT MARKET, BY TECHNOLOGY, 2022-2032 ($MILLION)
TABLE 14. CANADA E-PASSPORT MARKET, BY APPLICATION, 2022-2032 ($MILLION)
TABLE 15. EUROPE E-PASSPORT MARKET, BY TECHNOLOGY, 2022-2032 ($MILLION)
TABLE 16. EUROPE E-PASSPORT MARKET, BY APPLICATION, 2022-2032 ($MILLION)
TABLE 17. EUROPE E-PASSPORT MARKET, BY COUNTRY, 2022-2032 ($MILLION)
TABLE 18. UK E-PASSPORT MARKET, BY TECHNOLOGY, 2022-2032 ($MILLION)
TABLE 19. UK E-PASSPORT MARKET, BY APPLICATION, 2022-2032 ($MILLION)
TABLE 20. GERMANY E-PASSPORT MARKET, BY TECHNOLOGY, 2022-2032 ($MILLION)
TABLE 21. GERMANY E-PASSPORT MARKET, BY APPLICATION, 2022-2032 ($MILLION)
TABLE 22. FRANCE E-PASSPORT MARKET, BY TECHNOLOGY, 2022-2032 ($MILLION)
TABLE 23. FRANCE E-PASSPORT MARKET, BY APPLICATION, 2022-2032 ($MILLION)
TABLE 24. ITALY E-PASSPORT MARKET, BY TECHNOLOGY, 2022-2032 ($MILLION)
TABLE 25. ITALY E-PASSPORT MARKET, BY APPLICATION, 2022-2032 ($MILLION)
TABLE 26. SPAIN E-PASSPORT MARKET, BY TECHNOLOGY, 2022-2032 ($MILLION)
TABLE 27. SPAIN E-PASSPORT MARKET, BY APPLICATION, 2022-2032 ($MILLION)
TABLE 28. REST OF EUROPE E-PASSPORT MARKET, BY TECHNOLOGY, 2022-2032 ($MILLION)
TABLE 29. REST OF EUROPE E-PASSPORT MARKET, BY APPLICATION, 2022-2032 ($MILLION)
TABLE 30. ASIA-PACIFIC E-PASSPORT MARKET, BY TECHNOLOGY, 2022-2032 ($MILLION)
TABLE 31. ASIA-PACIFIC E-PASSPORT MARKET, BY APPLICATION, 2022-2032 ($MILLION)
TABLE 32. ASIA-PACIFIC E-PASSPORT MARKET, BY COUNTRY, 2022-2032 ($MILLION)
TABLE 33. CHINA E-PASSPORT MARKET, BY TECHNOLOGY, 2022-2032 ($MILLION)
TABLE 34. CHINA E-PASSPORT MARKET, BY APPLICATION, 2022-2032 ($MILLION)
TABLE 35. JAPAN E-PASSPORT MARKET, BY TECHNOLOGY, 2022-2032 ($MILLION)
TABLE 36. JAPAN E-PASSPORT MARKET, BY APPLICATION, 2022-2032 ($MILLION)
TABLE 37. AUSTRALIA E-PASSPORT MARKET, BY TECHNOLOGY, 2022-2032 ($MILLION)
TABLE 38. AUSTRALIA E-PASSPORT MARKET, BY APPLICATION, 2022-2032 ($MILLION)
TABLE 39. INDIA E-PASSPORT MARKET, BY TECHNOLOGY, 2022-2032 ($MILLION)
TABLE 40. INDIA E-PASSPORT MARKET, BY APPLICATION, 2022-2032 ($MILLION)
TABLE 41. SOUTH KOREA E-PASSPORT MARKET, BY TECHNOLOGY, 2022-2032 ($MILLION)
TABLE 42. SOUTH KOREA E-PASSPORT MARKET, BY APPLICATION, 2022-2032 ($MILLION)
TABLE 43. REST OF ASIA-PACIFIC E-PASSPORT MARKET, BY TECHNOLOGY, 2022-2032 ($MILLION)
TABLE 44. REST OF ASIA-PACIFIC E-PASSPORT MARKET, BY APPLICATION, 2022-2032 ($MILLION)
TABLE 45. LAMEA E-PASSPORT MARKET, BY TECHNOLOGY, 2022-2032 ($MILLION)
TABLE 46. LAMEA E-PASSPORT MARKET, BY APPLICATION, 2022-2032 ($MILLION)
TABLE 47. LAMEA E-PASSPORT MARKET, BY COUNTRY, 2022-2032 ($MILLION)
TABLE 48. LATIN AMERICA E-PASSPORT MARKET, BY TECHNOLOGY, 2022-2032 ($MILLION)
TABLE 49. LATIN AMERICA E-PASSPORT MARKET, BY APPLICATION, 2022-2032 ($MILLION)
TABLE 50. MIDDLE EAST E-PASSPORT MARKET, BY TECHNOLOGY, 2022-2032 ($MILLION)
TABLE 51. MIDDLE EAST E-PASSPORT MARKET, BY APPLICATION, 2022-2032 ($MILLION)
TABLE 52. AFRICA E-PASSPORT MARKET, BY TECHNOLOGY, 2022-2032 ($MILLION)
TABLE 53. AFRICA E-PASSPORT MARKET, BY APPLICATION, 2022-2032 ($MILLION)
TABLE 54. 3M: KEY EXECUTIVES
TABLE 55. 3M: COMPANY SNAPSHOT
TABLE 56. 3M: PRODUCT SEGMENTS
TABLE 57. 3M: PRODUCT PORTFOLIO
TABLE 58. 4G IDENTITY SOLUTIONS: KEY EXECUTIVES
TABLE 59. 4G IDENTITY SOLUTIONS: COMPANY SNAPSHOT
TABLE 60. 4G IDENTITY SOLUTIONS: SERVICE SEGMENTS
TABLE 61. 4G IDENTITY SOLUTIONS: PRODUCT PORTFOLIO
TABLE 62. CARDLOGIX CORPORATION: KEY EXECUTIVES
TABLE 63. CARDLOGIX CORPORATION: COMPANY SNAPSHOT
TABLE 64. CARDLOGIX CORPORATION: PRODUCT SEGMENTS
TABLE 65. CARDLOGIX CORPORATION: SERVICE SEGMENTS
TABLE 66. CARDLOGIX CORPORATION: PRODUCT PORTFOLIO
TABLE 67. EASTCOMPEACE TECHNOLOGY CO., LTD.: KEY EXECUTIVES
TABLE 68. EASTCOMPEACE TECHNOLOGY CO., LTD.: COMPANY SNAPSHOT
TABLE 69. EASTCOMPEACE TECHNOLOGY CO., LTD.: SERVICE SEGMENTS
TABLE 70. EASTCOMPEACE TECHNOLOGY CO., LTD.: PRODUCT PORTFOLIO
TABLE 71. ENTRUST CORPORATION: KEY EXECUTIVES
TABLE 72. ENTRUST CORPORATION: COMPANY SNAPSHOT
TABLE 73. ENTRUST CORPORATION: SERVICE SEGMENTS
TABLE 74. ENTRUST CORPORATION: PRODUCT PORTFOLIO
TABLE 75. ENTRUST CORPORATION: KEY STRATERGIES
TABLE 76. HID GLOBAL CORPORATION: KEY EXECUTIVES
TABLE 77. HID GLOBAL CORPORATION: COMPANY SNAPSHOT
TABLE 78. HID GLOBAL CORPORATION: SERVICE SEGMENTS
TABLE 79. HID GLOBAL CORPORATION: PRODUCT PORTFOLIO
TABLE 80. HID GLOBAL CORPORATION: KEY STRATERGIES
TABLE 81. INFINEON TECHNOLOGIES AG: KEY EXECUTIVES
TABLE 82. INFINEON TECHNOLOGIES AG: COMPANY SNAPSHOT
TABLE 83. INFINEON TECHNOLOGIES AG: SERVICE SEGMENTS
TABLE 84. INFINEON TECHNOLOGIES AG: PRODUCT PORTFOLIO
TABLE 85. INFINEON TECHNOLOGIES AG: KEY STRATERGIES
TABLE 86. MUHLBAUER GROUP: KEY EXECUTIVES
TABLE 87. MUHLBAUER GROUP: COMPANY SNAPSHOT
TABLE 88. MUHLBAUER GROUP: SERVICE SEGMENTS
TABLE 89. MUHLBAUER GROUP: PRODUCT PORTFOLIO
TABLE 90. SAFRAN: KEY EXECUTIVES
TABLE 91. SAFRAN: COMPANY SNAPSHOT
TABLE 92. SAFRAN: PRODUCT SEGMENTS
TABLE 93. SAFRAN: PRODUCT PORTFOLIO
TABLE 94. THALES GROUP: KEY EXECUTIVES
TABLE 95. THALES GROUP: COMPANY SNAPSHOT
TABLE 96. THALES GROUP: PRODUCT SEGMENTS
TABLE 97. THALES GROUP: PRODUCT PORTFOLIO
TABLE 98. THALES GROUP: KEY STRATERGIES
LIST OF FIGURES
FIGURE 01. E-PASSPORT MARKET, 2022-2032
FIGURE 02. SEGMENTATION OF E-PASSPORT MARKET,2022-2032
FIGURE 03. TOP INVESTMENT POCKETS IN E-PASSPORT MARKET (2023-2032)
FIGURE 04. LOW BARGAINING POWER OF SUPPLIERS
FIGURE 05. LOW THREAT OF NEW ENTRANTS
FIGURE 06. LOW THREAT OF SUBSTITUTES
FIGURE 07. LOW INTENSITY OF RIVALRY
FIGURE 08. LOW BARGAINING POWER OF BUYERS
FIGURE 09. GLOBAL E-PASSPORT MARKET:DRIVERS, RESTRAINTS AND OPPORTUNITIES
FIGURE 10. E-PASSPORT MARKET, BY TECHNOLOGY, 2022(%)
FIGURE 11. COMPARATIVE SHARE ANALYSIS OF E-PASSPORT MARKET FOR RADIO FREQUENCY IDENTIFICATION (RFID), BY COUNTRY 2022 AND 2032(%)
FIGURE 12. COMPARATIVE SHARE ANALYSIS OF E-PASSPORT MARKET FOR BIOMETRIC, BY COUNTRY 2022 AND 2032(%)
FIGURE 13. E-PASSPORT MARKET, BY APPLICATION, 2022(%)
FIGURE 14. COMPARATIVE SHARE ANALYSIS OF E-PASSPORT MARKET FOR LEISURE TRAVEL, BY COUNTRY 2022 AND 2032(%)
FIGURE 15. COMPARATIVE SHARE ANALYSIS OF E-PASSPORT MARKET FOR BUSINESS TRAVEL, BY COUNTRY 2022 AND 2032(%)
FIGURE 16. E-PASSPORT MARKET BY REGION, 2022(%)
FIGURE 17. U.S. E-PASSPORT MARKET, 2022-2032 ($MILLION)
FIGURE 18. CANADA E-PASSPORT MARKET, 2022-2032 ($MILLION)
FIGURE 19. UK E-PASSPORT MARKET, 2022-2032 ($MILLION)
FIGURE 20. GERMANY E-PASSPORT MARKET, 2022-2032 ($MILLION)
FIGURE 21. FRANCE E-PASSPORT MARKET, 2022-2032 ($MILLION)
FIGURE 22. ITALY E-PASSPORT MARKET, 2022-2032 ($MILLION)
FIGURE 23. SPAIN E-PASSPORT MARKET, 2022-2032 ($MILLION)
FIGURE 24. REST OF EUROPE E-PASSPORT MARKET, 2022-2032 ($MILLION)
FIGURE 25. CHINA E-PASSPORT MARKET, 2022-2032 ($MILLION)
FIGURE 26. JAPAN E-PASSPORT MARKET, 2022-2032 ($MILLION)
FIGURE 27. AUSTRALIA E-PASSPORT MARKET, 2022-2032 ($MILLION)
FIGURE 28. INDIA E-PASSPORT MARKET, 2022-2032 ($MILLION)
FIGURE 29. SOUTH KOREA E-PASSPORT MARKET, 2022-2032 ($MILLION)
FIGURE 30. REST OF ASIA-PACIFIC E-PASSPORT MARKET, 2022-2032 ($MILLION)
FIGURE 31. LATIN AMERICA E-PASSPORT MARKET, 2022-2032 ($MILLION)
FIGURE 32. MIDDLE EAST E-PASSPORT MARKET, 2022-2032 ($MILLION)
FIGURE 33. AFRICA E-PASSPORT MARKET, 2022-2032 ($MILLION)
FIGURE 34. TOP WINNING STRATEGIES, BY YEAR (2020-2023)
FIGURE 35. TOP WINNING STRATEGIES, BY DEVELOPMENT (2020-2023)
FIGURE 36. TOP WINNING STRATEGIES, BY COMPANY (2020-2023)
FIGURE 37. PRODUCT MAPPING OF TOP 10 PLAYERS
FIGURE 38. COMPETITIVE DASHBOARD
FIGURE 39. COMPETITIVE HEATMAP: E-PASSPORT MARKET
FIGURE 40. TOP PLAYER POSITIONING, 2022
FIGURE 41. 3M: NET SALES, 2020-2022 ($MILLION)
FIGURE 42. 3M: RESEARCH & DEVELOPMENT EXPENDITURE, 2020-2022 ($MILLION)
FIGURE 43. 3M: REVENUE SHARE BY SEGMENT, 2022 (%)
FIGURE 44. 3M: REVENUE SHARE BY REGION, 2022 (%)
FIGURE 45. HID GLOBAL CORPORATION: NET REVENUE, 2020-2022 ($MILLION)
FIGURE 46. HID GLOBAL CORPORATION: RESEARCH & DEVELOPMENT EXPENDITURE, 2020-2022 ($MILLION)
FIGURE 47. HID GLOBAL CORPORATION: REVENUE SHARE BY SEGMENT, 2022 (%)
FIGURE 48. HID GLOBAL CORPORATION: REVENUE SHARE BY REGION, 2022 (%)
FIGURE 49. INFINEON TECHNOLOGIES AG: RESEARCH & DEVELOPMENT EXPENDITURE, 2019-2021 ($MILLION)
FIGURE 50. INFINEON TECHNOLOGIES AG: NET SALES, 2019-2021 ($MILLION)
FIGURE 51. INFINEON TECHNOLOGIES AG: REVENUE SHARE BY SEGMENT, 2021 (%)
FIGURE 52. INFINEON TECHNOLOGIES AG: REVENUE SHARE BY REGION, 2021 (%)
FIGURE 53. SAFRAN: NET SALES, 2020-2022 ($MILLION)
FIGURE 54. SAFRAN: RESEARCH & DEVELOPMENT EXPENDITURE, 2020-2022 ($MILLION)
FIGURE 55. SAFRAN: REVENUE SHARE BY SEGMENT, 2022 (%)
FIGURE 56. SAFRAN: REVENUE SHARE BY REGION, 2022 (%)
FIGURE 57. THALES GROUP: NET REVENUE, 2020-2022 ($MILLION)
FIGURE 58. THALES GROUP: RESEARCH & DEVELOPMENT EXPENDITURE, 2020-2022 ($MILLION)
FIGURE 59. THALES GROUP: REVENUE SHARE BY REGION, 2022 (%)
FIGURE 60. THALES GROUP: REVENUE SHARE BY SEGMENT, 2022 (%)
$5730
$9600
HAVE A QUERY?
OUR CUSTOMER
