0
U.S. (TOLL FREE)
+1 (315) 215-3225
Automative

0
U.S. (TOLL FREE)
+1 (315) 215-3225
Spacesuit Market By Type (IVA suits, EVA suits), By Material (Soft shell, Hard shell, Hybrid), By End-use (Spaceflight mission, Training): Global Opportunity Analysis and Industry Forecast, 2021-2031
Published Date: March 2023
|
Report Code: ALLI-Auto-2K786
Home | Market Reports | Business & Industrial| Aerospace & Defense| Space Technology
Spacesuit Market By Type IVA suits EVA suits By Material Soft shell Hard shell Hybrid By End use Spaceflight mission Training Global Opportunity Analysis and Industry Forecast 2021 2031
BUY CHAPTERS

Spacesuit Market By Type (IVA suits, EVA suits), By Material (Soft shell, Hard shell, Hybrid), By End-use (Spaceflight mission, Training): Global Opportunity Analysis and Industry Forecast, 2021-2031

Code: ALLI-Auto-2K786
Report
March 2023
Pages:349
Allied Market Research
Buy Now with 15% Discount
DESCRIPTION
TABLE OF CONTENT
TABLES & FIGURES

Spacesuit Market Size

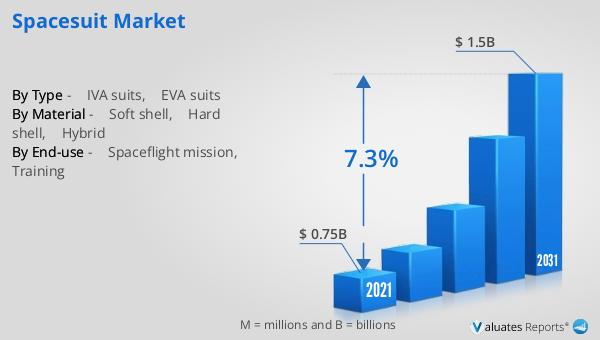
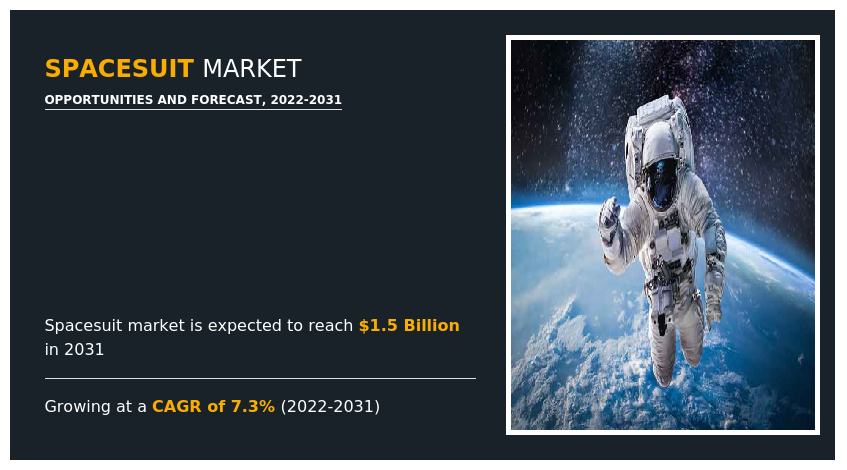
According to a new report published by , titled, “Spacesuit Market," The spacesuit market was valued at $0.75 billion in 2021, and is estimated to reach $1.5 billion by 2031, growing at a CAGR of 7.3% from 2022 to 2031.

Spacesuit Market

Spacesuit Market

Spacesuits are specially designed garments worn by astronauts during space missions to protect them from the harsh conditions of space, including extreme temperatures, radiation, and the vacuum of space. Spacesuits typically consist of multiple layers, each serving a different purpose. The outermost layer is made of a tough, durable material that can withstand extreme temperatures and harsh conditions of space. This layer also provides protection from radiation and micrometeorites.
Key factors driving the growth of the spacesuit market rise in space exploration programs, increase in the space industry budget, and advancements in material science. Continued advances in material science led to the development of more durable, flexible, and lightweight materials for spacesuits. These advances help in the creation of new and improved spacesuits that increase the quality of astronauts and can provide safety and withstand the rigors of space. Spacesuits play an important role in ensuring the safety of astronauts. Moreover, they require materials that are both durable and flexible, allowing movement while providing protection. Constant research to design a next-generation space suit for astronauts is expected to drive the growth of the market. For instance, in May 2019, researchers at the University of Colorado Boulder developed a new type of stretchy material that could be used in spacesuits. This material is a combination of two polymers that can be stretched up to 6 times its original size without breaking. Such developments in the materials of a spacesuit to improve its design and safety are expected to propel the growth of the market.
A hard-shell spacesuit is a type of spacesuit with a hard outer shell made of hard materials such as fiberglass, Kevlar, and carbon fiber. This outer shell provides a protective layer that can withstand the harsh conditions of space, including temperature extremes, radiation, and micrometeorites. There are multiple layers of insulation and other protective materials to protect astronauts from the harsh environment of space. The AX-5 high-pressure, zero pre-breathe hard suit was developed at NASA Ames Research Center in the 1980s. It provided mobility through a constant volume, using a hard metal/composite rigid exoskeleton design. The hard shell space suits are popular as they provide more protection. They can be operated at high pressures. Moreover, the hard shell suits can be completely pressurized with no requirement of pre-breathing. Such advantages are expected to drive the growth of the segment in the market.
The spacesuit market is segmented into type, material, end-use, and region. On the basis of type, the market is categorized into IVA suits, and EVA suits. On the basis of material, it is categorized into soft shell, hard shell, and hybrid. On the basis of end-use, it is fragmented into spaceflight mission, and training. Region wise, it is analyzed across North America (the U.S., Canada, and Mexico), Europe (Germany, France, UK, Russia, and rest of Europe), Asia-Pacific (China, Japan, India, South Korea, and rest of Asia-Pacific), and LAMEA (Latin America, Middle East, and Africa).
The key players profiled in the study Paragon Space Development Corporation, Oceaneering International, Inc., SpaceX, Boeing, David Clark Company Incorporated, ILC Dover LP, Vinyl Technologies, Inc., Raytheon Technologies Corporation, Pacific Spaceflight, and Sure Safety. The players in the market have been actively engaged in the adoption various strategies such as contract, acquisition, product launch and expansion to remain competitive and gain an advantage over the competitors in the market. For instance, in August 2022, Collins Aerospace a subsidiary of Raytheon Technologies inaugurated a new, 120,000 square-foot facility located at the Spaceport in Houston, Texas. The new Houston Spaceport location is expected to support the development and testing of several key space systems, including the next-generation spacesuit for the International Space Station..
Key Market Insights
By type, the IVA suits segment was the highest revenue contributor to the market, and is estimated to reach $1,264.6 million by 2031, with a CAGR of 7.1%. However, the EVA suits segment is estimated to be the fastest growing segment with the CAGR of 8.3% during the forecast period.
By material, the hard shell segment dominated the global market, and is estimated to reach $1,042.4 million by 2031, with a CAGR of 7.3%. However, the hybrid segment is expected to be the fastest growing segment during the spacesuit market forecast.
Based on end-use, the spaceflight mission segment was the highest revenue contributor to the market, with $ 503.8 million in 2021, and is estimated to reach $ 962.5 million by 2031, with a CAGR of 6.7%.
Based on region, North America was the highest revenue contributor, accounting for $ 418.4 million in 2021, and is estimated to reach $ 780.8 million by 2031, with a CAGR of 6.5%.


Overview

Spacesuits are made up of various layers such as thermal control layer, which regulates the temperature inside the suit and prevents the astronaut from overheating or getting too cold. Thermal layers are usually made of materials that can absorb and store heat such as Nomex or Goretex. The third layer is the pressure layer, which provides the pressure needed to keep astronauts alive in the vacuum of space. This layer is usually made of a rubbery material like neoprene that stretches and contracts with the astronaut's movements.
Inside the suit are additional layers that provide life support systems such as oxygen, carbon dioxide removal, and temperature regulation. The suit is also equipped with a communication system that allows the astronaut to communicate with the spacecraft and other crew members
A hybrid spacesuit has a hardshell part and a fabric part. NASA's Outboard Mobility Unit uses a fiberglass reinforced fuselage (HUT) and fabric limbs. The ILC Dover I-Suit replaces the stiff torso with a soft fabric torso to save weight and limit the use of stiff components to the pivot bearings, helmet, waist seal, and rear entry hatch.
Hybrid suits are a combination of hard material and soft material designed to provide extreme comfort and flexibility to the astronauts. In 2020, NASA developed a hybrid spacesuit intelligent architecture with soft-robotic elements to the gas-pressurized spacesuit to enable enhanced dexterity, and improve comfort to facilitate both scientific and exploration operations on planetary missions. Moreover, manufacturers provide hybrid space suits to increase flexibility and mobility. For instance, Oceaneering International offers EXploration Space Suit (EXS) which is a hybrid suit, containing design elements from both hard and soft suit designs. The upper body of the suit is made of a hard composite material, while the lower body, arms and legs are made of a soft, stretchy material that allows for greater flexibility and freedom of movement. Such developments are expected to propel the growth of the segment in the market.
The spacesuit market is segmented on the basis of type, material, end-use, and region. Based on type, it is segmented into IVA suits, and EVA suits. On the basis of material, it is classified into soft shell, hard shell and hybrid. By end-use, it is categorized into spaceflight mission, and training. By region, the market is analyzed across North America, Europe, Asia-Pacific, and LAMEA.
Some major companies operating in the market include Volkswagen AG, Daimler AG, Lexus, Infiniti, BMW AG, Volvo Car, Rolls-Royce plc, Aston Martin Lagonda, Tesla, and Ferrari N.VParagon Space Development Corporation, Oceaneering International, Inc., SpaceX, Boeing, David Clark Company Incorporated, ILC Dover LP, Vinyl Technologies, Inc., Raytheon Technologies Corporation, Pacific Spaceflight, and Sure Safety

Key Benefits For Stakeholders

●This report provides a quantitative analysis of the market segments, current trends, estimations, and dynamics of the spacesuit market analysis from 2021 to 2031 to identify the prevailing spacesuit market opportunities.
●The market research is offered along with information related to key drivers, restraints, and opportunities.
●Porter's five forces analysis highlights the potency of buyers and suppliers to enable stakeholders make profit-oriented business decisions and strengthen their supplier-buyer network.
●In-depth analysis of the spacesuit market segmentation assists to determine the prevailing market opportunities.
●Major countries in each region are mapped according to their revenue contribution to the global market.
●Market player positioning facilitates benchmarking and provides a clear understanding of the present position of the market players.
●The report includes the analysis of the regional as well as global spacesuit market trends, key players, market segments, application areas, and market growth strategies.
Key Market Segments
○ Pacific Spacefligh

Scope of Spacesuit Market Report

Report Metric Details
Report Name Spacesuit Market
Accounted market size in 2021 $ 0.75 billion
Forecasted market size in 2031 $ 1.5 billion
CAGR 7.3%
Base Year 2021
Forecasted years 2024 - 2031
By Type ● IVA suits
● EVA suits
By Material ● Soft shell
● Hard shell
● Hybrid
By End-use ● Spaceflight mission
● Training
By Region
  • North America (United States, Canada)
  • Europe (Germany, France, UK, Italy, Russia) Rest of Europe
  • Nordic Countries
  • Asia-Pacific (China, Japan, South Korea)
  • Southeast Asia (India, Australia)
  • Rest of Asia
  • Latin America (Mexico, Brazil)
  • Rest of Latin America
  • Middle East & Africa (Turkey, Saudi Arabia, UAE, Rest of MEA)
Forecast units USD million in value
Report coverage Revenue and volume forecast, company share, competitive landscape, growth factors and trends

FAQ for this report

How fast is Spacesuit Market growing?

Ans: The Spacesuit Market witnessing a CAGR of 7.3% during the forecast period 2024-2031.

What is the Spacesuit Market size in 2031?

Ans: The Spacesuit Market size in 2031 will be $ 1.5 billion.

What are the Type segmentation covered in the Spacesuit Market report?

Ans: The Types covered in the Spacesuit Market report are ● IVA suits, ● EVA suits

CHAPTER 1: INTRODUCTION
1.1. Report description
1.2. Key market segments
1.3. Key benefits to the stakeholders
1.4. Research Methodology
1.4.1. Primary research
1.4.2. Secondary research
1.4.3. Analyst tools and models
CHAPTER 2: EXECUTIVE SUMMARY
2.1. CXO Perspective
CHAPTER 3: MARKET OVERVIEW
3.1. Market definition and scope
3.2. Key findings
3.2.1. Top impacting factors
3.2.2. Top investment pockets
3.3. Porter’s five forces analysis
3.3.1. Bargaining power of suppliers
3.3.2. Bargaining power of buyers
3.3.3. Threat of substitutes
3.3.4. Threat of new entrants
3.3.5. Intensity of rivalry
3.4. Market dynamics
3.4.1. Drivers
3.4.1.1. Rise in space exploration programs
3.4.1.2. Increase in the space industry budget
3.4.1.3. Advancements in material science
3.4.2. Restraints
3.4.2.1. High manufacturing and maintenance cost
3.4.2.2. Lack of standardization
3.4.3. Opportunities
3.4.3.1. Growth in space tourism
3.5. COVID-19 Impact Analysis on the market
CHAPTER 4: SPACESUIT MARKET, BY TYPE
4.1. Overview
4.1.1. Market size and forecast
4.2. IVA suits
4.2.1. Key market trends, growth factors and opportunities
4.2.2. Market size and forecast, by region
4.2.3. Market share analysis by country
4.3. EVA suits
4.3.1. Key market trends, growth factors and opportunities
4.3.2. Market size and forecast, by region
4.3.3. Market share analysis by country
CHAPTER 5: SPACESUIT MARKET, BY MATERIAL
5.1. Overview
5.1.1. Market size and forecast
5.2. Soft shell
5.2.1. Key market trends, growth factors and opportunities
5.2.2. Market size and forecast, by region
5.2.3. Market share analysis by country
5.3. Hard shell
5.3.1. Key market trends, growth factors and opportunities
5.3.2. Market size and forecast, by region
5.3.3. Market share analysis by country
5.4. Hybrid
5.4.1. Key market trends, growth factors and opportunities
5.4.2. Market size and forecast, by region
5.4.3. Market share analysis by country
CHAPTER 6: SPACESUIT MARKET, BY END-USE
6.1. Overview
6.1.1. Market size and forecast
6.2. Spaceflight mission
6.2.1. Key market trends, growth factors and opportunities
6.2.2. Market size and forecast, by region
6.2.3. Market share analysis by country
6.3. Training
6.3.1. Key market trends, growth factors and opportunities
6.3.2. Market size and forecast, by region
6.3.3. Market share analysis by country
CHAPTER 7: SPACESUIT MARKET, BY REGION
7.1. Overview
7.1.1. Market size and forecast By Region
7.2. North America
7.2.1. Key trends and opportunities
7.2.2. Market size and forecast, by Type
7.2.3. Market size and forecast, by Material
7.2.4. Market size and forecast, by End-use
7.2.5. Market size and forecast, by country
7.2.5.1. U.S.
7.2.5.1.1. Key market trends, growth factors and opportunities
7.2.5.1.2. Market size and forecast, by Type
7.2.5.1.3. Market size and forecast, by Material
7.2.5.1.4. Market size and forecast, by End-use
7.2.5.2. Canada
7.2.5.2.1. Key market trends, growth factors and opportunities
7.2.5.2.2. Market size and forecast, by Type
7.2.5.2.3. Market size and forecast, by Material
7.2.5.2.4. Market size and forecast, by End-use
7.2.5.3. Mexico
7.2.5.3.1. Key market trends, growth factors and opportunities
7.2.5.3.2. Market size and forecast, by Type
7.2.5.3.3. Market size and forecast, by Material
7.2.5.3.4. Market size and forecast, by End-use
7.3. Europe
7.3.1. Key trends and opportunities
7.3.2. Market size and forecast, by Type
7.3.3. Market size and forecast, by Material
7.3.4. Market size and forecast, by End-use
7.3.5. Market size and forecast, by country
7.3.5.1. Germany
7.3.5.1.1. Key market trends, growth factors and opportunities
7.3.5.1.2. Market size and forecast, by Type
7.3.5.1.3. Market size and forecast, by Material
7.3.5.1.4. Market size and forecast, by End-use
7.3.5.2. France
7.3.5.2.1. Key market trends, growth factors and opportunities
7.3.5.2.2. Market size and forecast, by Type
7.3.5.2.3. Market size and forecast, by Material
7.3.5.2.4. Market size and forecast, by End-use
7.3.5.3. UK
7.3.5.3.1. Key market trends, growth factors and opportunities
7.3.5.3.2. Market size and forecast, by Type
7.3.5.3.3. Market size and forecast, by Material
7.3.5.3.4. Market size and forecast, by End-use
7.3.5.4. Russia
7.3.5.4.1. Key market trends, growth factors and opportunities
7.3.5.4.2. Market size and forecast, by Type
7.3.5.4.3. Market size and forecast, by Material
7.3.5.4.4. Market size and forecast, by End-use
7.3.5.5. Rest of Europe
7.3.5.5.1. Key market trends, growth factors and opportunities
7.3.5.5.2. Market size and forecast, by Type
7.3.5.5.3. Market size and forecast, by Material
7.3.5.5.4. Market size and forecast, by End-use
7.4. Asia-Pacific
7.4.1. Key trends and opportunities
7.4.2. Market size and forecast, by Type
7.4.3. Market size and forecast, by Material
7.4.4. Market size and forecast, by End-use
7.4.5. Market size and forecast, by country
7.4.5.1. China
7.4.5.1.1. Key market trends, growth factors and opportunities
7.4.5.1.2. Market size and forecast, by Type
7.4.5.1.3. Market size and forecast, by Material
7.4.5.1.4. Market size and forecast, by End-use
7.4.5.2. Japan
7.4.5.2.1. Key market trends, growth factors and opportunities
7.4.5.2.2. Market size and forecast, by Type
7.4.5.2.3. Market size and forecast, by Material
7.4.5.2.4. Market size and forecast, by End-use
7.4.5.3. India
7.4.5.3.1. Key market trends, growth factors and opportunities
7.4.5.3.2. Market size and forecast, by Type
7.4.5.3.3. Market size and forecast, by Material
7.4.5.3.4. Market size and forecast, by End-use
7.4.5.4. South Korea
7.4.5.4.1. Key market trends, growth factors and opportunities
7.4.5.4.2. Market size and forecast, by Type
7.4.5.4.3. Market size and forecast, by Material
7.4.5.4.4. Market size and forecast, by End-use
7.4.5.5. Rest of Asia-Pacific
7.4.5.5.1. Key market trends, growth factors and opportunities
7.4.5.5.2. Market size and forecast, by Type
7.4.5.5.3. Market size and forecast, by Material
7.4.5.5.4. Market size and forecast, by End-use
7.5. LAMEA
7.5.1. Key trends and opportunities
7.5.2. Market size and forecast, by Type
7.5.3. Market size and forecast, by Material
7.5.4. Market size and forecast, by End-use
7.5.5. Market size and forecast, by country
7.5.5.1. Latin America
7.5.5.1.1. Key market trends, growth factors and opportunities
7.5.5.1.2. Market size and forecast, by Type
7.5.5.1.3. Market size and forecast, by Material
7.5.5.1.4. Market size and forecast, by End-use
7.5.5.2. Middle East
7.5.5.2.1. Key market trends, growth factors and opportunities
7.5.5.2.2. Market size and forecast, by Type
7.5.5.2.3. Market size and forecast, by Material
7.5.5.2.4. Market size and forecast, by End-use
7.5.5.3. Africa
7.5.5.3.1. Key market trends, growth factors and opportunities
7.5.5.3.2. Market size and forecast, by Type
7.5.5.3.3. Market size and forecast, by Material
7.5.5.3.4. Market size and forecast, by End-use
CHAPTER 8: COMPETITIVE LANDSCAPE
8.1. Introduction
8.2. Top winning strategies
8.3. Product Mapping of Top 10 Player
8.4. Competitive Dashboard
8.5. Competitive Heatmap
8.6. Top player positioning, 2021
CHAPTER 9: COMPANY PROFILES
9.1. David Clark Company Incorporated
9.1.1. Company overview
9.1.2. Key Executives
9.1.3. Company snapshot
9.1.4. Operating business segments
9.1.5. Product portfolio
9.2. ILC Dover LP
9.2.1. Company overview
9.2.2. Key Executives
9.2.3. Company snapshot
9.2.4. Operating business segments
9.2.5. Product portfolio
9.2.6. Key strategic moves and developments
9.3. Oceaneering International, Inc.
9.3.1. Company overview
9.3.2. Key Executives
9.3.3. Company snapshot
9.3.4. Operating business segments
9.3.5. Product portfolio
9.3.6. Business performance
9.3.7. Key strategic moves and developments
9.4. Vinyl Technology, Inc.
9.4.1. Company overview
9.4.2. Key Executives
9.4.3. Company snapshot
9.4.4. Operating business segments
9.4.5. Product portfolio
9.5. paragon space development corporation
9.5.1. Company overview
9.5.2. Key Executives
9.5.3. Company snapshot
9.5.4. Operating business segments
9.5.5. Product portfolio
9.5.6. Key strategic moves and developments
9.6. Spacex
9.6.1. Company overview
9.6.2. Key Executives
9.6.3. Company snapshot
9.6.4. Operating business segments
9.6.5. Product portfolio
9.6.6. Key strategic moves and developments
9.7. Boeing
9.7.1. Company overview
9.7.2. Key Executives
9.7.3. Company snapshot
9.7.4. Operating business segments
9.7.5. Product portfolio
9.7.6. Business performance
9.7.7. Key strategic moves and developments
9.8. Raytheon Technologies Corporation
9.8.1. Company overview
9.8.2. Key Executives
9.8.3. Company snapshot
9.8.4. Operating business segments
9.8.5. Product portfolio
9.8.6. Business performance
9.8.7. Key strategic moves and developments
9.9. Pacific Spaceflight
9.9.1. Company overview
9.9.2. Key Executives
9.9.3. Company snapshot
9.9.4. Operating business segments
9.9.5. Product portfolio
9.10. Sure Safety
9.10.1. Company overview
9.10.2. Key Executives
9.10.3. Company snapshot
9.10.4. Operating business segments
9.10.5. Product portfoli
LIST OF TABLES
TABLE 01. GLOBAL SPACESUIT MARKET, BY TYPE, 2021-2031 ($MILLION)
TABLE 02. SPACESUIT MARKET FOR IVA SUITS, BY REGION, 2021-2031 ($MILLION)
TABLE 03. SPACESUIT MARKET FOR EVA SUITS, BY REGION, 2021-2031 ($MILLION)
TABLE 04. GLOBAL SPACESUIT MARKET, BY MATERIAL, 2021-2031 ($MILLION)
TABLE 05. SPACESUIT MARKET FOR SOFT SHELL, BY REGION, 2021-2031 ($MILLION)
TABLE 06. SPACESUIT MARKET FOR HARD SHELL, BY REGION, 2021-2031 ($MILLION)
TABLE 07. SPACESUIT MARKET FOR HYBRID, BY REGION, 2021-2031 ($MILLION)
TABLE 08. GLOBAL SPACESUIT MARKET, BY END-USE, 2021-2031 ($MILLION)
TABLE 09. SPACESUIT MARKET FOR SPACEFLIGHT MISSION, BY REGION, 2021-2031 ($MILLION)
TABLE 10. SPACESUIT MARKET FOR TRAINING, BY REGION, 2021-2031 ($MILLION)
TABLE 11. SPACESUIT MARKET, BY REGION, 2021-2031 ($MILLION)
TABLE 12. NORTH AMERICA SPACESUIT MARKET, BY TYPE, 2021-2031 ($MILLION)
TABLE 13. NORTH AMERICA SPACESUIT MARKET, BY MATERIAL, 2021-2031 ($MILLION)
TABLE 14. NORTH AMERICA SPACESUIT MARKET, BY END-USE, 2021-2031 ($MILLION)
TABLE 15. NORTH AMERICA SPACESUIT MARKET, BY COUNTRY, 2021-2031 ($MILLION)
TABLE 16. U.S. SPACESUIT MARKET, BY TYPE, 2021-2031 ($MILLION)
TABLE 17. U.S. SPACESUIT MARKET, BY MATERIAL, 2021-2031 ($MILLION)
TABLE 18. U.S. SPACESUIT MARKET, BY END-USE, 2021-2031 ($MILLION)
TABLE 19. CANADA SPACESUIT MARKET, BY TYPE, 2021-2031 ($MILLION)
TABLE 20. CANADA SPACESUIT MARKET, BY MATERIAL, 2021-2031 ($MILLION)
TABLE 21. CANADA SPACESUIT MARKET, BY END-USE, 2021-2031 ($MILLION)
TABLE 22. MEXICO SPACESUIT MARKET, BY TYPE, 2021-2031 ($MILLION)
TABLE 23. MEXICO SPACESUIT MARKET, BY MATERIAL, 2021-2031 ($MILLION)
TABLE 24. MEXICO SPACESUIT MARKET, BY END-USE, 2021-2031 ($MILLION)
TABLE 25. EUROPE SPACESUIT MARKET, BY TYPE, 2021-2031 ($MILLION)
TABLE 26. EUROPE SPACESUIT MARKET, BY MATERIAL, 2021-2031 ($MILLION)
TABLE 27. EUROPE SPACESUIT MARKET, BY END-USE, 2021-2031 ($MILLION)
TABLE 28. EUROPE SPACESUIT MARKET, BY COUNTRY, 2021-2031 ($MILLION)
TABLE 29. GERMANY SPACESUIT MARKET, BY TYPE, 2021-2031 ($MILLION)
TABLE 30. GERMANY SPACESUIT MARKET, BY MATERIAL, 2021-2031 ($MILLION)
TABLE 31. GERMANY SPACESUIT MARKET, BY END-USE, 2021-2031 ($MILLION)
TABLE 32. FRANCE SPACESUIT MARKET, BY TYPE, 2021-2031 ($MILLION)
TABLE 33. FRANCE SPACESUIT MARKET, BY MATERIAL, 2021-2031 ($MILLION)
TABLE 34. FRANCE SPACESUIT MARKET, BY END-USE, 2021-2031 ($MILLION)
TABLE 35. UK SPACESUIT MARKET, BY TYPE, 2021-2031 ($MILLION)
TABLE 36. UK SPACESUIT MARKET, BY MATERIAL, 2021-2031 ($MILLION)
TABLE 37. UK SPACESUIT MARKET, BY END-USE, 2021-2031 ($MILLION)
TABLE 38. RUSSIA SPACESUIT MARKET, BY TYPE, 2021-2031 ($MILLION)
TABLE 39. RUSSIA SPACESUIT MARKET, BY MATERIAL, 2021-2031 ($MILLION)
TABLE 40. RUSSIA SPACESUIT MARKET, BY END-USE, 2021-2031 ($MILLION)
TABLE 41. REST OF EUROPE SPACESUIT MARKET, BY TYPE, 2021-2031 ($MILLION)
TABLE 42. REST OF EUROPE SPACESUIT MARKET, BY MATERIAL, 2021-2031 ($MILLION)
TABLE 43. REST OF EUROPE SPACESUIT MARKET, BY END-USE, 2021-2031 ($MILLION)
TABLE 44. ASIA-PACIFIC SPACESUIT MARKET, BY TYPE, 2021-2031 ($MILLION)
TABLE 45. ASIA-PACIFIC SPACESUIT MARKET, BY MATERIAL, 2021-2031 ($MILLION)
TABLE 46. ASIA-PACIFIC SPACESUIT MARKET, BY END-USE, 2021-2031 ($MILLION)
TABLE 47. ASIA-PACIFIC SPACESUIT MARKET, BY COUNTRY, 2021-2031 ($MILLION)
TABLE 48. CHINA SPACESUIT MARKET, BY TYPE, 2021-2031 ($MILLION)
TABLE 49. CHINA SPACESUIT MARKET, BY MATERIAL, 2021-2031 ($MILLION)
TABLE 50. CHINA SPACESUIT MARKET, BY END-USE, 2021-2031 ($MILLION)
TABLE 51. JAPAN SPACESUIT MARKET, BY TYPE, 2021-2031 ($MILLION)
TABLE 52. JAPAN SPACESUIT MARKET, BY MATERIAL, 2021-2031 ($MILLION)
TABLE 53. JAPAN SPACESUIT MARKET, BY END-USE, 2021-2031 ($MILLION)
TABLE 54. INDIA SPACESUIT MARKET, BY TYPE, 2021-2031 ($MILLION)
TABLE 55. INDIA SPACESUIT MARKET, BY MATERIAL, 2021-2031 ($MILLION)
TABLE 56. INDIA SPACESUIT MARKET, BY END-USE, 2021-2031 ($MILLION)
TABLE 57. SOUTH KOREA SPACESUIT MARKET, BY TYPE, 2021-2031 ($MILLION)
TABLE 58. SOUTH KOREA SPACESUIT MARKET, BY MATERIAL, 2021-2031 ($MILLION)
TABLE 59. SOUTH KOREA SPACESUIT MARKET, BY END-USE, 2021-2031 ($MILLION)
TABLE 60. REST OF ASIA-PACIFIC SPACESUIT MARKET, BY TYPE, 2021-2031 ($MILLION)
TABLE 61. REST OF ASIA-PACIFIC SPACESUIT MARKET, BY MATERIAL, 2021-2031 ($MILLION)
TABLE 62. REST OF ASIA-PACIFIC SPACESUIT MARKET, BY END-USE, 2021-2031 ($MILLION)
TABLE 63. LAMEA SPACESUIT MARKET, BY TYPE, 2021-2031 ($MILLION)
TABLE 64. LAMEA SPACESUIT MARKET, BY MATERIAL, 2021-2031 ($MILLION)
TABLE 65. LAMEA SPACESUIT MARKET, BY END-USE, 2021-2031 ($MILLION)
TABLE 66. LAMEA SPACESUIT MARKET, BY COUNTRY, 2021-2031 ($MILLION)
TABLE 67. LATIN AMERICA SPACESUIT MARKET, BY TYPE, 2021-2031 ($MILLION)
TABLE 68. LATIN AMERICA SPACESUIT MARKET, BY MATERIAL, 2021-2031 ($MILLION)
TABLE 69. LATIN AMERICA SPACESUIT MARKET, BY END-USE, 2021-2031 ($MILLION)
TABLE 70. MIDDLE EAST SPACESUIT MARKET, BY TYPE, 2021-2031 ($MILLION)
TABLE 71. MIDDLE EAST SPACESUIT MARKET, BY MATERIAL, 2021-2031 ($MILLION)
TABLE 72. MIDDLE EAST SPACESUIT MARKET, BY END-USE, 2021-2031 ($MILLION)
TABLE 73. AFRICA SPACESUIT MARKET, BY TYPE, 2021-2031 ($MILLION)
TABLE 74. AFRICA SPACESUIT MARKET, BY MATERIAL, 2021-2031 ($MILLION)
TABLE 75. AFRICA SPACESUIT MARKET, BY END-USE, 2021-2031 ($MILLION)
TABLE 76. DAVID CLARK COMPANY INCORPORATED: KEY EXECUTIVES
TABLE 77. DAVID CLARK COMPANY INCORPORATED: COMPANY SNAPSHOT
TABLE 78. DAVID CLARK COMPANY INCORPORATED: PRODUCT SEGMENTS
TABLE 79. DAVID CLARK COMPANY INCORPORATED: PRODUCT PORTFOLIO
TABLE 80. ILC DOVER LP: KEY EXECUTIVES
TABLE 81. ILC DOVER LP: COMPANY SNAPSHOT
TABLE 82. ILC DOVER LP: PRODUCT SEGMENTS
TABLE 83. ILC DOVER LP: PRODUCT PORTFOLIO
TABLE 84. ILC DOVER LP: KEY STRATERGIES
TABLE 85. OCEANEERING INTERNATIONAL, INC.: KEY EXECUTIVES
TABLE 86. OCEANEERING INTERNATIONAL, INC.: COMPANY SNAPSHOT
TABLE 87. OCEANEERING INTERNATIONAL, INC.: PRODUCT SEGMENTS
TABLE 88. OCEANEERING INTERNATIONAL, INC.: PRODUCT PORTFOLIO
TABLE 89. OCEANEERING INTERNATIONAL, INC.: KEY STRATERGIES
TABLE 90. VINYL TECHNOLOGY, INC.: KEY EXECUTIVES
TABLE 91. VINYL TECHNOLOGY, INC.: COMPANY SNAPSHOT
TABLE 92. VINYL TECHNOLOGY, INC.: PRODUCT SEGMENTS
TABLE 93. VINYL TECHNOLOGY, INC.: PRODUCT PORTFOLIO
TABLE 94. PARAGON SPACE DEVELOPMENT CORPORATION: KEY EXECUTIVES
TABLE 95. PARAGON SPACE DEVELOPMENT CORPORATION: COMPANY SNAPSHOT
TABLE 96. PARAGON SPACE DEVELOPMENT CORPORATION: PRODUCT SEGMENTS
TABLE 97. PARAGON SPACE DEVELOPMENT CORPORATION: PRODUCT PORTFOLIO
TABLE 98. PARAGON SPACE DEVELOPMENT CORPORATION: KEY STRATERGIES
TABLE 99. SPACEX: KEY EXECUTIVES
TABLE 100. SPACEX: COMPANY SNAPSHOT
TABLE 101. SPACEX: PRODUCT SEGMENTS
TABLE 102. SPACEX: PRODUCT PORTFOLIO
TABLE 103. SPACEX: KEY STRATERGIES
TABLE 104. BOEING: KEY EXECUTIVES
TABLE 105. BOEING: COMPANY SNAPSHOT
TABLE 106. BOEING: PRODUCT SEGMENTS
TABLE 107. BOEING: PRODUCT PORTFOLIO
TABLE 108. BOEING: KEY STRATERGIES
TABLE 109. RAYTHEON TECHNOLOGIES CORPORATION: KEY EXECUTIVES
TABLE 110. RAYTHEON TECHNOLOGIES CORPORATION: COMPANY SNAPSHOT
TABLE 111. RAYTHEON TECHNOLOGIES CORPORATION: PRODUCT SEGMENTS
TABLE 112. RAYTHEON TECHNOLOGIES CORPORATION: PRODUCT PORTFOLIO
TABLE 113. RAYTHEON TECHNOLOGIES CORPORATION: KEY STRATERGIES
TABLE 114. PACIFIC SPACEFLIGHT: KEY EXECUTIVES
TABLE 115. PACIFIC SPACEFLIGHT: COMPANY SNAPSHOT
TABLE 116. PACIFIC SPACEFLIGHT: PRODUCT SEGMENTS
TABLE 117. PACIFIC SPACEFLIGHT: PRODUCT PORTFOLIO
TABLE 118. SURE SAFETY: KEY EXECUTIVES
TABLE 119. SURE SAFETY: COMPANY SNAPSHOT
TABLE 120. SURE SAFETY: PRODUCT SEGMENTS
TABLE 121. SURE SAFETY: SERVICE SEGMENTS
TABLE 122. SURE SAFETY: PRODUCT PORTFOLIO LIST OF FIGURES
FIGURE 01. SPACESUIT MARKET, 2021-2031
FIGURE 02. SEGMENTATION OF SPACESUIT MARKET, 2021-2031
FIGURE 03. TOP INVESTMENT POCKETS IN SPACESUIT MARKET (2022-2031)
FIGURE 04. LOW BARGAINING POWER OF SUPPLIERS
FIGURE 05. LOW BARGAINING POWER OF BUYERS
FIGURE 06. LOW THREAT OF SUBSTITUTES
FIGURE 07. LOW THREAT OF NEW ENTRANTS
FIGURE 08. LOW INTENSITY OF RIVALRY
FIGURE 09. DRIVERS, RESTRAINTS AND OPPORTUNITIES: GLOBALSPACESUIT MARKET
FIGURE 10. SPACESUIT MARKET, BY TYPE, 2021(%)
FIGURE 11. COMPARATIVE SHARE ANALYSIS OF SPACESUIT MARKET FOR IVA SUITS, BY COUNTRY 2021 AND 2031(%)
FIGURE 12. COMPARATIVE SHARE ANALYSIS OF SPACESUIT MARKET FOR EVA SUITS, BY COUNTRY 2021 AND 2031(%)
FIGURE 13. SPACESUIT MARKET, BY MATERIAL, 2021(%)
FIGURE 14. COMPARATIVE SHARE ANALYSIS OF SPACESUIT MARKET FOR SOFT SHELL, BY COUNTRY 2021 AND 2031(%)
FIGURE 15. COMPARATIVE SHARE ANALYSIS OF SPACESUIT MARKET FOR HARD SHELL, BY COUNTRY 2021 AND 2031(%)
FIGURE 16. COMPARATIVE SHARE ANALYSIS OF SPACESUIT MARKET FOR HYBRID, BY COUNTRY 2021 AND 2031(%)
FIGURE 17. SPACESUIT MARKET, BY END-USE, 2021(%)
FIGURE 18. COMPARATIVE SHARE ANALYSIS OF SPACESUIT MARKET FOR SPACEFLIGHT MISSION, BY COUNTRY 2021 AND 2031(%)
FIGURE 19. COMPARATIVE SHARE ANALYSIS OF SPACESUIT MARKET FOR TRAINING, BY COUNTRY 2021 AND 2031(%)
FIGURE 20. SPACESUIT MARKET BY REGION, 2021
FIGURE 21. U.S. SPACESUIT MARKET, 2021-2031 ($MILLION)
FIGURE 22. CANADA SPACESUIT MARKET, 2021-2031 ($MILLION)
FIGURE 23. MEXICO SPACESUIT MARKET, 2021-2031 ($MILLION)
FIGURE 24. GERMANY SPACESUIT MARKET, 2021-2031 ($MILLION)
FIGURE 25. FRANCE SPACESUIT MARKET, 2021-2031 ($MILLION)
FIGURE 26. UK SPACESUIT MARKET, 2021-2031 ($MILLION)
FIGURE 27. RUSSIA SPACESUIT MARKET, 2021-2031 ($MILLION)
FIGURE 28. REST OF EUROPE SPACESUIT MARKET, 2021-2031 ($MILLION)
FIGURE 29. CHINA SPACESUIT MARKET, 2021-2031 ($MILLION)
FIGURE 30. JAPAN SPACESUIT MARKET, 2021-2031 ($MILLION)
FIGURE 31. INDIA SPACESUIT MARKET, 2021-2031 ($MILLION)
FIGURE 32. SOUTH KOREA SPACESUIT MARKET, 2021-2031 ($MILLION)
FIGURE 33. REST OF ASIA-PACIFIC SPACESUIT MARKET, 2021-2031 ($MILLION)
FIGURE 34. LATIN AMERICA SPACESUIT MARKET, 2021-2031 ($MILLION)
FIGURE 35. MIDDLE EAST SPACESUIT MARKET, 2021-2031 ($MILLION)
FIGURE 36. AFRICA SPACESUIT MARKET, 2021-2031 ($MILLION)
FIGURE 37. TOP WINNING STRATEGIES, BY YEAR
FIGURE 38. TOP WINNING STRATEGIES, BY DEVELOPMENT
FIGURE 39. TOP WINNING STRATEGIES, BY COMPANY
FIGURE 40. PRODUCT MAPPING OF TOP 10 PLAYERS
FIGURE 41. COMPETITIVE DASHBOARD
FIGURE 42. COMPETITIVE HEATMAP: SPACESUIT MARKET
FIGURE 43. TOP PLAYER POSITIONING, 2021
FIGURE 44. OCEANEERING INTERNATIONAL, INC.: NET REVENUE, 2019-2021 ($MILLION)
FIGURE 45. OCEANEERING INTERNATIONAL, INC.: REVENUE SHARE BY SEGMENT, 2021 (%)
FIGURE 46. OCEANEERING INTERNATIONAL, INC.: REVENUE SHARE BY REGION, 2021 (%)
FIGURE 47. BOEING: RESEARCH & DEVELOPMENT EXPENDITURE, 2020-2022 ($MILLION)
FIGURE 48. BOEING: NET REVENUE, 2020-2022 ($MILLION)
FIGURE 49. BOEING: REVENUE SHARE BY SEGMENT, 2022 (%)
FIGURE 50. BOEING: REVENUE SHARE BY REGION, 2021 (%)
FIGURE 51. RAYTHEON TECHNOLOGIES CORPORATION: NET SALES, 2019-2021 ($MILLION)
FIGURE 52. RAYTHEON TECHNOLOGIES CORPORATION: RESEARCH & DEVELOPMENT EXPENDITURE, 2019-2021 ($MILLION)
FIGURE 53. RAYTHEON TECHNOLOGIES CORPORATION: REVENUE SHARE BY SEGMENT, 2021 (%)
FIGURE 54. RAYTHEON TECHNOLOGIES CORPORATION: REVENUE SHARE BY REGION, 2021 (%
SELECT A FORMAT
Added to Cart
Electronic (PDF)

$5730

This license allows only one user to access the PDF.
Electronic (PDF)

$6450

This license allows 1 - 5 user to access the PDF, license is suitable for small groups of 5 users working together
Electronic (PDF)

$9600

This license allows users/teams in a same Enterprise to use this report, various departments within an enterpise can use this report
Electronic (PDF)

$3840

This license just provides quantitative data in a excel sheet
Add to Cart
Buy Now (15% Discount)

OUR CUSTOMER

Novocure

SIMILAR REPORTS