0
  • Category
  • Region
U.S. (TOLL FREE)
+1 (315) 215-3225
0
U.S. (TOLL FREE)
+1 (315) 215-3225
Europe Sports Equipment and Apparel Market by Product Type (Sports Equipment and Sports Apparel & Footwear), Retailers (Brand Outlets and Independent Stores), and Country (Germany, France, UK, Italy, Spain, and Rest of Europe): Opportunity Analysis and Industry Forecast, 2018–2025
Published Date: November 2019
|
Report Code: ALLI-Auto-2L356
Home | Market Reports | Shopping| Apparel| Athletic Apparel
Europe Sports Equipment and Apparel Market by Product Type Sports Equipment and Sports Apparel Footwear Retailers Brand Outlets and Independent Stores and Country Germany France UK Italy Spain and Rest of Europe Opportunity Analysis and Industry Forecast 2018 2025
BUY CHAPTERS

Europe Sports Equipment and Apparel Market by Product Type (Sports Equipment and Sports Apparel & Footwear), Retailers (Brand Outlets and Independent Stores), and Country (Germany, France, UK, Italy, Spain, and Rest of Europe): Opportunity Analysis and Industry Forecast, 2018–2025

Code: ALLI-Auto-2L356
Report
November 2019
Pages:133
Allied Market Research
Buy Now with 15% Discount
DESCRIPTION
TABLE OF CONTENT
TABLES & FIGURES

Europe Sports Equipment & Apparel Market

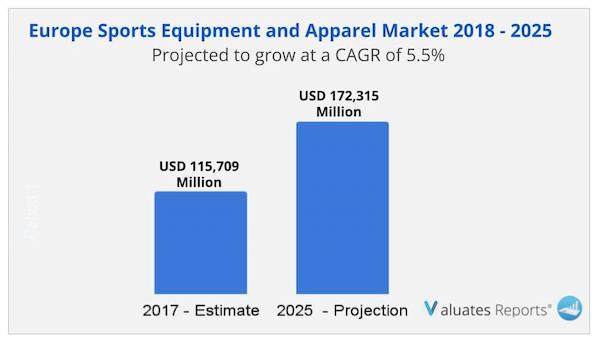
The Europe sports equipment & apparel market size was valued at USD 115,709 Million in 2017, and is projected to reach USD 172,315 Million by 2025, growing at a CAGR of 5.5% from 2018 to 2025.
 
Europe Sports Equipment and Apparel Market
 
Sports equipment and apparel are sporting goods used while engaging in sport activates. However, consumers are actively wearing sports apparel during non-sports hours. This report is an in-depth study of the sports equipment and apparel market consumed across different types of sports activities. The market is analyzed across outdoor activities such as hiking; winter & water sports; team games such as football, volleyball, & basketball; and racket sports such as tennis, squash, & others.

Rise in health awareness, increase in disposable incomes in developing countries, and popularity of physical fitness activities drive the Europe sports equipment & apparel market growth. Rise in expenditure on sports training and development among children, owing to increase in consciousness about the benefits of engaging in sports activities such as increased concentration and problem-solving ability fuel the demand for the sports equipment and apparel market. Moreover, changing paradigm of educational system supports the growth of the sports industry and industries related to it. In addition, rise in sports education and sports training in academics has significantly increased the awareness toward sports and fitness. Online retail platform is the major driver of the sport equipment and goods industry. Currently, most of the sports equipment and apparel manufacturing companies have their own web-based retail stores where users can gain excessive information about the organization such as latest news of product and company and finance-related information. The number of consumers shopping online is increasing due to availability of varied product options and price comparison on online shopping sites. This is useful for retailers due to zero expenditure on physical outlets or showrooms. Some of the major reasons behind consumers preference for shopping online are they can read reviews provided by other consumers and compare various stores & products and prices.

Increase in prevalence of obesity and rise in health awareness majorly boost the growth of the Europe sports equipment & apparel market. Furthermore, government initiatives to promote healthy life fuel the rise in participations in sport activities across the European region. However, rise in social unrest and political influence on sports events hampers the growth of Europe sports equipment & apparel market. On the contrary, improvement in lifestyle, increase in youth population, and rise in per-capita income in the European countries are the factors anticipated to provide lucrative opportunities for the Europe sports equipment & apparel market growth. Initiatives taken by various governments to promote sports, health, and fitness have led to increased consciousness about sports and sports-related products. For instance, European Non-Governmental Sports Organization (ENGSO) is a non-profit organization with a strong network with other sports organizations in Europe and a counterpart of European governmental institutions dealing directly or indirectly with sport. That is why ENGSO has been carrying out so many activities in the last decades.

The Europe sports equipment & apparel market is segmented based on product type, retailers, and country. Based on product type, the Europe sports equipment & apparel market is categorized into sports equipment and sports apparel & footwear. Based on retailers the market is categorized into brand outlets and independent stores. Based on country, the Europe sports equipment & apparel market is studied across the UK, France, Germany, Italy, Spain, and rest of Europe.
 
Based on product type, the Europe sports equipment & apparel market is categorized into sports equipment and sports apparel & footwear. The sports equipment segment occupied the highest Europe sports equipment & apparel market share. Rise in awareness regarding general health and fitness is one of the primary factor that fuels the growth of the market. In addition, development in materials used for manufacturing of sports equipment is helping enhance product performance, thereby boosting the adoption.

Based on retailers, the market is categorized into brand outlets and independent stores. The independent stores segment occupied the highest market share owing to the benefits associated with the independent stores. For instance, limited decision makers in the independent stores, decisions related to merchandise, hours of operation, and sales are taken quickly with less amount of discussion. In addition, stores also have wide range of sports equipment and apparel products available in number of brands.

As per country, the market is analyzed across Germany, France, the UK, Italy, Spain, and Rest of Europe. The penetration of the sports equipment & apparel is high across Germany followed by France. Increase in government initiatives in Europe is leading to the development of emerging sports players and new consumer base for sport events. Moreover, rise in participation of the European population fuels the growth of the football/soccer sports equipment and apparel market. In addition, the European football governing body, UEFA has taken initiative to encourage women's football by rolling out Women’s Football Development Program and participation initiatives such as Together WePlayStrong. This is anticipated to increase the female consumer base for sports equipment and apparel in this region.

Key leading players operating in the Europe sports equipment & apparel industry are Adidas AG (ADIDAS), Amer Sports Corporation, Asics Corporation, Fila Korea Ltd, New Balance, Nike, Inc, Puma Se (Kering), Sports Direct International Plc, Under Armour, Inc, and VF Corporation (VFC).

By Product Type

    • Sports Equipment
    • Sports Apparel & Footwear

By Country

    • Germany
    • France
    • UK
    • Italy
    • Spain
    • Rest of Europe

By Retailers

    • Brand outlets
    • Independent stores

Key Market Players

  • ADIDAS AG (ADIDAS)
  • AMER SPORTS CORPORATION
  • ASICS CORPORATION
  • FILA KOREA LTD.
  • NEW BALANCE
  • NIKE, INC.
  • PUMA SE (KERING)
  • SPORTS DIRECT INTERNATIONAL PLC.
  • UNDER ARMOUR, INC.
  • VF CORPORATION (VFC)
CHAPTER 1: INTRODUCTION
1.1. Report description
1.2. Key market benefits for stakeholders
1.3. Key market segments
1.4. Research methodology
1.4.1. Secondary research
1.4.2. Primary research
1.4.3. Analyst tools and models
CHAPTER 2: EXECUTIVE SUMMARY
2.1. CXO perspective
CHAPTER 3: MARKET OVERVIEW
3.1. Market definition and scope
3.2. Key findings
3.2.1. Top investment pockets
3.3. Top winning strategies
3.4. Porter's five force analysis
3.4.1. Bargaining power of suppliers
3.4.2. Bargaining power of buyers
3.4.3. Threat of new entrants
3.4.4. Threat of substitution
3.4.5. Intensity of competitive rivalry
3.5. Market dynamics
3.5.1. Drivers
3.5.1.1. Increase in sports and fitness awareness across Europe
3.5.1.2. Government initiatives toward sports activities and events
3.5.2. Restraints
3.5.2.1. Rise in Social unrest and political influence on sports events
3.5.2.2. Increase in proclivity of kids in indoor leisure activities
3.5.3. Opportunities
3.5.3.1. Growing contribution by various organizations toward donation
3.5.3.2. Rapid growth of online retail platform
3.6. List of sports equipment & apparel brands (top 100) in europe
3.7. Number of sports equipment & apparel stores per brand per country in europe
3.8. Market player positioning, 2017
CHAPTER 4: EUROPE SPORTS EQUIPMENT AND APPAREL MARKET, BY PRODUCT TYPE
4.1. Overview
4.1.1. Market size and forecast
4.2. Sports equipment
4.2.1. Key market trends, growth factors, and opportunities
4.2.2. Market size and forecast
4.2.3. Market analysis, by country
4.3. Sports apparel and footwear
4.3.1. Key market trends, growth factors, and opportunities
4.3.2. Market size and forecast
4.3.3. Market analysis, by country
CHAPTER 5: EUROPE SPORTS EQUIPMENT AND APPAREL MARKET, BY RETAILERS
5.1. Overview
5.1.1. Market size and forecast
5.2. Brand outlets
5.2.1. Key market trends, growth factors, and opportunities
5.2.2. Market size and forecast
5.2.3. Market analysis, by country
5.3. Independent stores
5.3.1. Key market trends, growth factors, and opportunities
5.3.2. Market size and forecast
5.3.3. Market analysis, by country
CHAPTER 6: EUROPE SPORTS EQUIPMENT AND APPAREL MARKET, BY COUNTRY
6.1. Overview
6.1.1. Market size and forecast, by country
6.2. Germany
6.2.1. Market size and forecast, by product type
6.2.2. Market size and forecast, by retailers
6.3. France
6.3.1. Market size and forecast, by product type
6.3.2. Market size and forecast, by retailers
6.4. UK
6.4.1. Market size and forecast, by product type
6.4.2. Market size and forecast, by retailers
6.5. Italy
6.5.1. Market size and forecast, by product type
6.5.2. Market size and forecast, by retailers
6.6. Spain
6.6.1. Market size and forecast, by product type
6.6.2. Market size and forecast, by retailers
6.7. Rest of Europe
6.7.1. Market size and forecast, by product type
6.7.2. Market size and forecast, by retailers
CHAPTER 7: COMPANY PROFILES
7.1. ADIDAS AG (ADIDAS)
7.1.1. Company overview
7.1.2. Company snapshot
7.1.3. Operating business segments
7.1.4. Product portfolio
7.1.5. Business performance
7.1.6. Key strategic moves and developments
7.2. AMER SPORTS CORPORATION
7.2.1. Company overview
7.2.2. Company snapshot
7.2.3. Operating business segments
7.2.4. Product portfolio
7.2.5. Business performance
7.2.6. Key strategic moves and developments
7.3. ASICS CORPORATION
7.3.1. Company overview
7.3.2. Company snapshot
7.3.3. Operating business segments
7.3.4. Product portfolio
7.3.5. Business performance
7.3.6. Key strategic moves and developments
7.4. FILA KOREA LTD.
7.4.1. Company overview
7.4.2. Company snapshot
7.4.3. Product portfolio
7.4.4. Business performance
7.5. NEW BALANCE
7.5.1. Company overview
7.5.2. Company snapshot
7.5.3. Product portfolio
7.5.4. Key strategic moves and developments
7.6. NIKE, INC.
7.6.1. Company overview
7.6.2. Company snapshot
7.6.3. Operating business segments
7.6.4. Product portfolio
7.6.5. Business performance
7.6.6. Key strategic moves and developments
7.7. PUMA SE (KERING)
7.7.1. Company overview
7.7.2. Company snapshot
7.7.3. Operating business segments
7.7.4. Product portfolio
7.7.5. Business performance
7.7.6. Key strategic moves and developments
7.8. SPORTS DIRECT INTERNATIONAL PLC.
7.8.1. Company overview
7.8.2. Company snapshot
7.8.3. Operating business segments
7.8.4. Product portfolio
7.8.5. Business performance
7.9. UNDER ARMOUR, INC.
7.9.1. Company overview
7.9.2. Company snapshot
7.9.3. Operating business segments
7.9.4. Product portfolio
7.9.5. Business performance
7.10. VF CORPORATION (VFC)
7.10.1. Company overview
7.10.2. Company snapshot
7.10.3. Operating business segments
7.10.4. Product portfolio
7.10.5. Business performance
7.10.6. Key strategic moves and development
LIST OF TABLES

TABLE 01. LIST OF SPORTS EQUIPMENT & APPAREL BRANDS (TOP 100) IN EUROPE
TABLE 02. EUROPE SPORTS EQUIPMENT AND APPAREL MARKET, BY PRODUCT TYPE, 2017–2025 ($MILLION)
TABLE 03. SPORTS EQUIPMENT IN EUROPE SPORTS EQUIPMENT AND APPAREL MARKET, BY COUNTRY, 2017–2025 ($MILLION)
TABLE 04. SPORTS APPAREL AND FOOTWEAR IN EUROPE SPORTS EQUIPMENT AND APPAREL MARKET, BY COUNTRY, 2017–2025 ($MILLION)
TABLE 05. EUROPE SPORTS EQUIPMENT AND APPAREL MARKET, BY RETAILERS, 2017–2025 ($MILLION)
TABLE 06. BRAND OUTLETS IN EUROPE SPORTS EQUIPMENT AND APPAREL MARKET, BY COUNTRY, 2017–2025 ($MILLION)
TABLE 07. INDEPENDENT STORES IN EUROPE SPORTS EQUIPMENT AND APPAREL MARKET, BY COUNTRY, 2017–2025 ($MILLION)
TABLE 08. EUROPE SPORTS EQUIPMENT AND APPAREL MARKET, BY COUNTRY, 2017–2025 ($MILLION)
TABLE 09. GERMANY SPORTS EQUIPMENT AND APPAREL MARKET, BY PRODUCT TYPE, 2017–2025 ($MILLION)
TABLE 10. GERMANY SPORTS EQUIPMENT AND APPAREL MARKET, BY RETAILERS, 2017–2025 ($MILLION)
TABLE 11. FRANCE SPORTS EQUIPMENT AND APPAREL MARKET, BY PRODUCT TYPE, 2017–2025 ($MILLION)
TABLE 12. FRANCE SPORTS EQUIPMENT AND APPAREL MARKET, BY RETAILERS, 2017–2025 ($MILLION)
TABLE 13. UK SPORTS EQUIPMENT AND APPAREL MARKET, BY PRODUCT TYPE, 2017–2025 ($MILLION)
TABLE 14. UK SPORTS EQUIPMENT AND APPAREL MARKET, BY RETAILERS, 2017–2025 ($MILLION)
TABLE 15. ITALY SPORTS EQUIPMENT AND APPAREL MARKET, BY PRODUCT TYPE, 2017–2025 ($MILLION)
TABLE 16. ITALY SPORTS EQUIPMENT AND APPAREL MARKET, BY RETAILERS, 2017–2025 ($MILLION)
TABLE 17. SPAIN SPORTS EQUIPMENT AND APPAREL MARKET, BY PRODUCT TYPE, 2017–2025 ($MILLION)
TABLE 18. SPAIN SPORTS EQUIPMENT AND APPAREL MARKET, BY RETAILERS, 2017–2025 ($MILLION)
TABLE 19. REST OF EUROPE SPORTS EQUIPMENT AND APPAREL MARKET, BY PRODUCT TYPE, 2017–2025 ($MILLION)
TABLE 20. REST OF EUROPE SPORTS EQUIPMENT AND APPAREL MARKET, BY RETAILERS, 2017–2025 ($MILLION)
TABLE 21. ADIDAS: COMPANY SNAPSHOT
TABLE 22. ADIDAS: OPERATING SEGMENTS
TABLE 23. ADIDAS: PRODUCT PORTFOLIO
TABLE 24. AMER SPORTS CORPORATION: COMPANY SNAPSHOT
TABLE 25. BOSTON SCIENTIFIC: OPERATING SEGMENTS
TABLE 26. AMER SPORTS CORPORATION: PRODUCT PORTFOLIO
TABLE 27. ASICS CORPORATION: COMPANY SNAPSHOT
TABLE 28. ASICS CORPORATION: OPERATING SEGMENTS
TABLE 29. ASICS CORPORATION: PRODUCT PORTFOLIO
TABLE 30. FILA KOREA LTD.: COMPANY SNAPSHOT
TABLE 31. FILA KOREA LTD.: PRODUCT PORTFOLIO
TABLE 32. NEW BALANCE: COMPANY SNAPSHOT
TABLE 33. NEW BALANCE: PRODUCT PORTFOLIO
TABLE 34. NIKE, INC.: COMPANY SNAPSHOT
TABLE 35. NIKE, INC.: OPERATING SEGMENTS
TABLE 36. NIKE, INC.: PRODUCT PORTFOLIO
TABLE 37. PUMA: COMPANY SNAPSHOT
TABLE 38. PUMA: OPERATING SEGMENTS
TABLE 39. PUMA: PRODUCT PORTFOLIO
TABLE 40. SPORTS DIRECT INTERNATIONAL PLC: COMPANY SNAPSHOT
TABLE 41. SPORTS DIRECT INTERNATIONAL PLC: OPERATING SEGMENTS
TABLE 42. SPORTS DIRECT INTERNATIONAL PLC: PRODUCT PORTFOLIO
TABLE 43. UNDER ARMOUR: COMPANY SNAPSHOT
TABLE 44. UNDER ARMOUR: PRODUCT PORTFOLIO
TABLE 45. VFC: COMPANY SNAPSHOT
TABLE 46. VFC: OPERATING SEGMENTS
TABLE 47. VFC: PRODUCT PORTFOLIO LIST OF FIGURES

FIGURE 01. SNAPSHOT: EUROPE SPORTS EQUIPMENT AND APPAREL MARKET
FIGURE 02. EUROPE SPORTS EQUIPMENT AND APPAREL MARKET SEGMENTATION
FIGURE 03. TOP INVESTMENT POCKETS, 2017–2025
FIGURE 04. TOP WINNING STRATEGIES, BY YEAR, 2016–2019*
FIGURE 05. TOP WINNING STRATEGIES, BY DEVELOPMENT, 2016–2019* (%)
FIGURE 06. TOP WINNING STRATEGIES, BY COMPANY, 2016–2019*
FIGURE 07. MODERATE BARGAINING POWER OF SUPPLIERS
FIGURE 08. HIGH BARGAINING POWER OF BUYERS
FIGURE 09. MODERATE THREAT OF NEW ENTRANTS
FIGURE 10. LOW THREAT OF SUBSTITUTION
FIGURE 11. HIGH INTENSITY OF COMPETITIVE RIVALRY
FIGURE 12. EUROPE SPORTS EQUIPMENT AND APPAREL MARKET: DRIVERS, RESTRAINTS, AND OPPORTUNITIES
FIGURE 13. MARKET PLAYER POSITIONING, 2017
FIGURE 14. EUROPE SPORTS EQUIPMENT AND APPAREL MARKET, BY PRODUCT TYPE, 2017 (%)
FIGURE 15. COMPARATIVE SHARE ANALYSIS OF SPORTS EQUIPMENT IN EUROPE SPORTS EQUIPMENT AND APPAREL MARKET, BY COUNTRY, 2017 & 2025 (%)
FIGURE 16. COMPARATIVE SHARE ANALYSIS OF SPORTS APPAREL AND FOOTWEAR IN EUROPE SPORTS EQUIPMENT AND APPAREL MARKET, BY COUNTRY, 2017 & 2025 (%)
FIGURE 17. EUROPE SPORTS EQUIPMENT AND APPAREL MARKET, BY RETAILERS, 2017 (%)
FIGURE 18. COMPARATIVE SHARE ANALYSIS OF BRAND OUTLETS IN EUROPE SPORTS EQUIPMENT AND APPAREL MARKET, BY COUNTRY, 2017 & 2025 (%)
FIGURE 19. COMPARATIVE SHARE ANALYSIS OF INDEPENDENT STORES IN EUROPE SPORTS EQUIPMENT AND APPAREL MARKET, BY COUNTRY, 2017 & 2025 (%)
FIGURE 20. EUROPE SPORTS EQUIPMENT AND APPAREL MARKET, BY COUNTRY, 2017 (%)
FIGURE 21. GERMANY SPORTS EQUIPMENT AND APPAREL MARKET, 2017–2025 ($MILLION)
FIGURE 22. FRANCE SPORTS EQUIPMENT AND APPAREL MARKET, 2017–2025 ($MILLION)
FIGURE 23. UK SPORTS EQUIPMENT AND APPAREL MARKET, 2017–2025 ($MILLION)
FIGURE 24. ITALY SPORTS EQUIPMENT AND APPAREL MARKET, 2017–2025 ($MILLION)
FIGURE 25. SPAIN SPORTS EQUIPMENT AND APPAREL MARKET, 2017–2025 ($MILLION)
FIGURE 26. REST OF EUROPE SPORTS EQUIPMENT AND APPAREL MARKET, 2017–2025 ($MILLION)
FIGURE 27. ADIDAS: NET SALES, 2016–2018 ($MILLION)
FIGURE 28. ADIDAS: REVENUE SHARE BY SEGMENT, 2018 (%)
FIGURE 29. ADIDAS: REVENUE SHARE BY PRODUCT CATEGORY, 2018 (%)
FIGURE 30. ADIDAS: REVENUE SHARE BY REGION, 2018 (%)
FIGURE 31. AMER SPORTS CORPORATION: NET SALES, 2016–2018 ($MILLION)
FIGURE 32. AMER SPORTS CORPORATION: REVENUE SHARE BY SEGMENT, 2018 (%)
FIGURE 33. AMER SPORTS CORPORATION: REVENUE SHARE BY REGION, 2018 (%)
FIGURE 34. ASICS CORPORATION: NET SALES, 2015–2017 ($MILLION)
FIGURE 35. ASICS CORPORATION: REVENUE SHARE BY SEGMENT, 2017 (%)
FIGURE 36. ASICS CORPORATION: REVENUE SHARE BY REGION, 2017 (%)
FIGURE 37. FILA KOREA LTD.: NET SALES, 2015–2017 ($MILLION)
FIGURE 38. NIKE, INC.: NET SALES, 2016–2018 ($MILLION)
FIGURE 39. NIKE, INC.: REVENUE SHARE BY SEGMENT, 2018 (%)
FIGURE 40. NIKE, INC.: REVENUE SHARE BY PRODUCT CATEGORY, 2018 (%)
FIGURE 41. PUMA: NET SALES, 2016–2018 ($MILLION)
FIGURE 42. PUMA: REVENUE SHARE BY SEGMENT, 2018 (%)
FIGURE 43. PUMA: REVENUE SHARE BY REGION, 2018 (%)
FIGURE 44. SPORTS DIRECT INTERNATIONAL PLC: NET SALES, 2016–2018 ($MILLION)
FIGURE 45. SPORTS DIRECT INTERNATIONAL PLC: REVENUE SHARE BY SEGMENT, 2018 (%)
FIGURE 46. SPORTS DIRECT INTERNATIONAL PLC: REVENUE SHARE BY REGION, 2018 (%)
FIGURE 47. UNDER ARMOUR: NET SALES, 2016–2018 ($MILLION)
FIGURE 48. UNDER ARMOUR: REVENUE SHARE BY SEGMENT, 2018 (%)
FIGURE 49. VFC: NET SALES, 2015–2017 ($MILLION)
FIGURE 50. VFC: REVENUE SHARE BY SEGMENT, 2017 (%)
FIGURE 51. VFC: REVENUE SHARE BY REGION, 2017 (%
SELECT A FORMAT
Added to Cart
Electronic (PDF)

$6038

This license allows only one user to access the PDF.
Electronic (PDF)

$10445

This license allows users/teams in a same Enterprise to use this report, various departments within an enterpise can use this report
Add to Cart
Buy Now (15% Discount)

OUR CUSTOMER

Leap India