0
U.S. (TOLL FREE)
+1 (315) 215-3225
Automative

0
U.S. (TOLL FREE)
+1 (315) 215-3225
Cloud RAN Market By Type (Centralized-RAN, Virtualized/Cloud RAN), By Component (Solutions, Services), By Network Type (3G, 4G, 5G), By Deployment (Outdoor, Indoor): Global Opportunity Analysis and Industry Forecast, 2021-2031
Published Date: February 2023
|
Report Code: ALLI-Auto-2L795
Home | Market Reports | Computers & Electronics
Cloud RAN Market By Type Centralized RAN Virtualized Cloud RAN By Component Solutions Services By Network Type 3G 4G 5G By Deployment Outdoor Indoor Global Opportunity Analysis and Industry Forecast 2021 2031
BUY CHAPTERS

Cloud RAN Market By Type (Centralized-RAN, Virtualized/Cloud RAN), By Component (Solutions, Services), By Network Type (3G, 4G, 5G), By Deployment (Outdoor, Indoor): Global Opportunity Analysis and Industry Forecast, 2021-2031

Code: ALLI-Auto-2L795
Report
February 2023
Pages:340
Allied Market Research
Buy Now with 15% Discount
DESCRIPTION
TABLE OF CONTENT
TABLES & FIGURES

Cloud RAN Market Size

According to a new report published by , titled, “Cloud RAN Market," The cloud ran market was valued at $11.1 billion in 2021, and is estimated to reach $85.9 billion by 2031, growing at a CAGR of 23.4% from 2022 to 2031.

Cloud RAN Market

Cloud RAN Market

The C-RAN (cloud radio access network) is an architecture for radio access networks (RANs) based on centralized cloud computing that offers real-time virtualization and collaborative radio technology support. It is a wireless communication system expansion that uses the most modern common public radio interface (CPRI) standard, coarse or dense wavelength division multiplexing technology, and millimeter wave (MM wave) transmission for long-distance transmissions. Future wireless technology advancements, such as 5G and the Internet of Things, depend on C-RANs.
Key factors driving the growth of the C-RAN market include the rising demand for capacity grows as internet data traffic increases, 5G promises to quadruple data transfer speed over 4G/LTE. The primary application reason driving the development of 5G is the enhancement of mobile broadband services. The network capabilities of wireless base stations may be more easily opened with C-RAN using virtualized containers. The capability opening function of the C-RAN will continue to evolve from basic APIs to sophisticated, scenario-based, and Internalized application programming interference. Mobile data transport solutions are evaluated based on characteristics such as agility, time to market, cost-effectiveness, operational and architectural simplicity, expandability, and flexibility. Power consumption and physical size are also key concerns in the development of new network designs, electricity, and space, as well as expensive and limited resources at the base.
The rollout of 5G mobile communications has significantly altered society and business. In comparison to previous cellular generations, 5G provides much higher peak data speeds that are available virtually anywhere and at any time. Despite the fact that mobile broadband services are now widely available, 5G promises the next level of human connectedness and human-to-human interaction, including widespread adoption of virtual or augmented reality, free perspective video, and telepresence. To boost 5G capabilities, three key service types have been proposed: improved mobile broadband (eMBB), massive-machine type communications (mMTC), and ultra-reliable low latency communication (uRLLC). The upgraded mobile broadband service, which employs 5G, offers faster connections, greater throughput, and more capacity than 4G LTE mobile broadband service. Cities, stadiums, and other busy areas will gain as a result. The network, on the other hand, is supposed to be used for mission-critical applications and services that require continuous and dependable data transport. Short packet data transmission is used in this case to meet the needs of trustworthy and low-latency wireless communication networks. Also, it is expected that gigantic machine-type communications would be employed to connect a range of devices, particularly the numerous connected IoT devices. These variables are expected to boost global C-RAN.
The C-RAN market is segmented into type, application, and region. On the basis of type, the market is categorized into centralized-ran and virtualized/cloud RAN. On the basis of components, it is categorized into solutions and services. On the basis of network type, it is categorized into 3G, 4G, and 5G. On the basis of deployment type, it is categorized into outdoor and indoor. Region-wise, it is analyzed across North America (the U.S., Canada, and Mexico), Europe (the UK, Germany, France, Italy, Spain, and rest of Europe), Asia-Pacific (China, India, Japan, Australia, and the rest of Asia-Pacific), and LAMEA (Brazil, Saudi Arabia, UAE, South Africa, and rest of LAMEA).
The key players profiled in the study include FUJITSU, ZTE Corporation., Intel Corporation, Telefonaktiebolaget LM Ericsson, Cisco Systems, Inc., Huawei Technologies Co., Ltd., ASOCS Ltd., SAMSUNG, NEC Corporation, and Nokia. The players in the market have been actively engaged in the adoption of various strategies such as acquisition, product launch, and expansion to remain competitive and gain an advantage over the competitors in the market. For instance, in December 2022, Telstra and Ericsson launched the first Ericsson Cloud RAN 5G data call on Telstra's commercial network. Telstra's centralized Cloud RAN architecture is made possible by the recently announced world-first commercial network deployment of Ericsson's industry-leading packet fronthaul technology based on the Ericsson Router 6673. Packet fronthaul technology connects existing site radios to the centralized Cloud RAN solution via eCPRI (enhanced CPRI).
Key Market Insights
Based on type, the Centralized-RAN sub-segment emerged as the global leader in 2021 and Virtualized/Cloud RAN sub-segment is anticipated to be the fastest-growing sub-segment during the forecast period
Based on components, the solutions sub-segment emerged as the global leader in 2021, and the services sub-segment is anticipated to be the fastest-growing sub-segment during the forecast period
Based on network type, the 4G sub-segment emerged as the global leader in 2021 and 5G sub-segment is anticipated to be fastest growing sub-segment during the forecast period
Based on deployment, the outdoor sub-segment emerged as the global leader in 2021 and the indoor sub-segment is anticipated to be fastest growing sub-segment during the forecast period.
Based on region, the North America market registered the highest market share in 2021 and is projected to maintain the position during the forecast period.

Overview

The global C-RAN market is envisioned to garner $85,899.70 million by 2031, growing from $11,128.90 million in 2021 at a CAGR of 23.4% from 2022 to 2031.
Conventional radio access networks are designed for static configuration and are deployed statically. As a result, they are inefficient in dealing with any spatiotemporal changes in the underlying traffic demand. Cloud radio access network (C-RAN) is a unique centralized solution based on software and virtualization technology that may effectively handle the difficulties of older networks. Cloud-RAN enables high data speeds as well as great network and radio adaptability over software-defined wireless networks. As base stations are virtualized rather than physically placed in different places, such architecture has the potential to save costs. In addition, compared to traditional networks, it consumes less energy and power.
However, the advantages of a C-RAN come at a cost. C-RAN architectures necessitate fronthaul networks, which have substantially higher bandwidth requirements than standard backhaul networks. The current 4G networks use 1 GbE for backhaul. Backhaul link rates will need to be increased to 10 GbE for 5G. Fronthaul with multiple RF carriers or radios at a cell site will result in larger bandwidth requirements as carriers and carrier bandwidth increase, culminating in the transition from 10 GbE to 100 GbE fronthaul connections, which adds significant cost.
The 5G cellular network is being developed as a result of the upsurge in mobile traffic. It will manage the expected monthly global mobile data traffic, which was predicted to exceed 30.6 exabytes, by increasing the system rate approximately 1000 times higher than the current systems. The vast installation of distant antenna units will result in a significant increase in the power consumption demand due to the reduction of cell sizes necessary to meet this high bandwidth requirement. C-RAN techniques are being looked into as a 5G fronthauling option to decrease this effect, tenable sustainable expansion, and narrow the geographic dispersion of maintenance sites..
Additionally, future 5G-based RAU (Remote Acquisition Unit) power requirements can be drastically lowered, especially if analog radio over fiber mobile fronthaul is taken into account, where processing is done at the Central Office. This upcoming 5G technology opens up new application niches for power-over-fiber technology, where low-power simplified antenna units are required as part of future 5G-based RAUs, along with various energy-saving techniques to reduce the impact of the power consumption of the remote antenna units, including the capacity of shifting some RAUs into sleep mode, with overall energy savings estimates of more than 30%. These factors are estimated to boost the C-RAN market share.
The spread of COVID-19 has slowed the development of 5G infrastructure. The pandemic has caused factories to close their operations, which has hampered the production of equipment needed to develop 5G infrastructure. Because investments were made prior to the pandemic outbreak, 5G technology is expected to gain traction. In addition, the COVID-19 lockdown caused many to stay home, and working from home has become the new normal. With an increase in number of business operations moving online and a significant growth in the number of individuals working from home, indoor deployment of the C-RAN architecture is expected to gain acceptance.
The key players profiled in this report include FUJITSU, ZTE Corporation., Intel Corporation, Telefonaktiebolaget LM Ericsson, Cisco Systems, Inc., Huawei Technologies Co., Ltd., ASOCS Ltd., SAMSUNG, NEC Corporation, and Nokia.

Key Benefits For Stakeholders

●This report provides a quantitative analysis of the market segments, current trends, estimations, and dynamics of the cloud ran market analysis from 2021 to 2031 to identify the prevailing cloud ran market opportunities.
●The market research is offered along with information related to key drivers, restraints, and opportunities.
●Porter's five forces analysis highlights the potency of buyers and suppliers to enable stakeholders make profit-oriented business decisions and strengthen their supplier-buyer network.
●In-depth analysis of the cloud ran market segmentation assists to determine the prevailing market opportunities.
●Major countries in each region are mapped according to their revenue contribution to the global market.
●Market player positioning facilitates benchmarking and provides a clear understanding of the present position of the market players.
●The report includes the analysis of the regional as well as global cloud ran market trends, key players, market segments, application areas, and market growth strategies.
Key Market Segments
○ Cisco Systems Inc

Scope of Cloud RAN Market Report

Report Metric Details
Report Name Cloud RAN Market
Accounted market size in 2021 $ 11.1 billion
Forecasted market size in 2031 $ 85.9 billion
CAGR 23.4%
Base Year 2021
Forecasted years 2024 - 2031
By Type ● Virtualized/Cloud RAN
● Centralized-RAN
By Component ● Solutions
● Services
By Network Type ● 3G
● 4G
● 5G
By Deployment ● Outdoor
● Indoor
By Region
  • North America (United States, Canada)
  • Europe (Germany, France, UK, Italy, Russia) Rest of Europe
  • Nordic Countries
  • Asia-Pacific (China, Japan, South Korea)
  • Southeast Asia (India, Australia)
  • Rest of Asia
  • Latin America (Mexico, Brazil)
  • Rest of Latin America
  • Middle East & Africa (Turkey, Saudi Arabia, UAE, Rest of MEA)
Forecast units USD million in value
Report coverage Revenue and volume forecast, company share, competitive landscape, growth factors and trends

FAQ for this report

How fast is Cloud RAN Market growing?

Ans: The Cloud RAN Market witnessing a CAGR of 23.4% during the forecast period 2024-2031.

What is the Cloud RAN Market size in 2031?

Ans: The Cloud RAN Market size in 2031 will be $ 85.9 billion.

What are the Type segmentation covered in the Cloud RAN Market report?

Ans: The Types covered in the Cloud RAN Market report are ● 3G, ● 4G, ● 5G

CHAPTER 1: INTRODUCTION
1.1. Report description
1.2. Key market segments
1.3. Key benefits to the stakeholders
1.4. Research Methodology
1.4.1. Primary research
1.4.2. Secondary research
1.4.3. Analyst tools and models
CHAPTER 2: EXECUTIVE SUMMARY
2.1. CXO Perspective
CHAPTER 3: MARKET OVERVIEW
3.1. Market definition and scope
3.2. Key findings
3.2.1. Top impacting factors
3.2.2. Top investment pockets
3.3. Porter’s five forces analysis
3.4. Market dynamics
3.4.1. Drivers
3.4.2. Restraints
3.4.3. Opportunities
3.5. COVID-19 Impact Analysis on the market
3.6. Key Regulation Analysis
3.7. Market Share Analysis
3.8. Patent Landscape
3.9. Regulatory Guidelines
3.10. Value Chain Analysis
CHAPTER 4: CLOUD RAN MARKET, BY TYPE
4.1. Overview
4.1.1. Market size and forecast
4.2. Centralized-RAN
4.2.1. Key market trends, growth factors and opportunities
4.2.2. Market size and forecast, by region
4.2.3. Market share analysis by country
4.3. Virtualized/Cloud RAN
4.3.1. Key market trends, growth factors and opportunities
4.3.2. Market size and forecast, by region
4.3.3. Market share analysis by country
CHAPTER 5: CLOUD RAN MARKET, BY COMPONENT
5.1. Overview
5.1.1. Market size and forecast
5.2. Solutions
5.2.1. Key market trends, growth factors and opportunities
5.2.2. Market size and forecast, by region
5.2.3. Market share analysis by country
5.3. Services
5.3.1. Key market trends, growth factors and opportunities
5.3.2. Market size and forecast, by region
5.3.3. Market share analysis by country
CHAPTER 6: CLOUD RAN MARKET, BY NETWORK TYPE
6.1. Overview
6.1.1. Market size and forecast
6.2. 3G
6.2.1. Key market trends, growth factors and opportunities
6.2.2. Market size and forecast, by region
6.2.3. Market share analysis by country
6.3. 4G
6.3.1. Key market trends, growth factors and opportunities
6.3.2. Market size and forecast, by region
6.3.3. Market share analysis by country
6.4. 5G
6.4.1. Key market trends, growth factors and opportunities
6.4.2. Market size and forecast, by region
6.4.3. Market share analysis by country
CHAPTER 7: CLOUD RAN MARKET, BY DEPLOYMENT
7.1. Overview
7.1.1. Market size and forecast
7.2. Outdoor
7.2.1. Key market trends, growth factors and opportunities
7.2.2. Market size and forecast, by region
7.2.3. Market share analysis by country
7.3. Indoor
7.3.1. Key market trends, growth factors and opportunities
7.3.2. Market size and forecast, by region
7.3.3. Market share analysis by country
CHAPTER 8: CLOUD RAN MARKET, BY REGION
8.1. Overview
8.1.1. Market size and forecast By Region
8.2. North America
8.2.1. Key trends and opportunities
8.2.2. Market size and forecast, by Type
8.2.3. Market size and forecast, by Component
8.2.4. Market size and forecast, by Network Type
8.2.5. Market size and forecast, by Deployment
8.2.6. Market size and forecast, by country
8.2.6.1. U.S.
8.2.6.1.1. Key market trends, growth factors and opportunities
8.2.6.1.2. Market size and forecast, by Type
8.2.6.1.3. Market size and forecast, by Component
8.2.6.1.4. Market size and forecast, by Network Type
8.2.6.1.5. Market size and forecast, by Deployment
8.2.6.2. Canada
8.2.6.2.1. Key market trends, growth factors and opportunities
8.2.6.2.2. Market size and forecast, by Type
8.2.6.2.3. Market size and forecast, by Component
8.2.6.2.4. Market size and forecast, by Network Type
8.2.6.2.5. Market size and forecast, by Deployment
8.2.6.3. Mexico
8.2.6.3.1. Key market trends, growth factors and opportunities
8.2.6.3.2. Market size and forecast, by Type
8.2.6.3.3. Market size and forecast, by Component
8.2.6.3.4. Market size and forecast, by Network Type
8.2.6.3.5. Market size and forecast, by Deployment
8.3. Europe
8.3.1. Key trends and opportunities
8.3.2. Market size and forecast, by Type
8.3.3. Market size and forecast, by Component
8.3.4. Market size and forecast, by Network Type
8.3.5. Market size and forecast, by Deployment
8.3.6. Market size and forecast, by country
8.3.6.1. Germany
8.3.6.1.1. Key market trends, growth factors and opportunities
8.3.6.1.2. Market size and forecast, by Type
8.3.6.1.3. Market size and forecast, by Component
8.3.6.1.4. Market size and forecast, by Network Type
8.3.6.1.5. Market size and forecast, by Deployment
8.3.6.2. UK
8.3.6.2.1. Key market trends, growth factors and opportunities
8.3.6.2.2. Market size and forecast, by Type
8.3.6.2.3. Market size and forecast, by Component
8.3.6.2.4. Market size and forecast, by Network Type
8.3.6.2.5. Market size and forecast, by Deployment
8.3.6.3. France
8.3.6.3.1. Key market trends, growth factors and opportunities
8.3.6.3.2. Market size and forecast, by Type
8.3.6.3.3. Market size and forecast, by Component
8.3.6.3.4. Market size and forecast, by Network Type
8.3.6.3.5. Market size and forecast, by Deployment
8.3.6.4. Spain
8.3.6.4.1. Key market trends, growth factors and opportunities
8.3.6.4.2. Market size and forecast, by Type
8.3.6.4.3. Market size and forecast, by Component
8.3.6.4.4. Market size and forecast, by Network Type
8.3.6.4.5. Market size and forecast, by Deployment
8.3.6.5. Italy
8.3.6.5.1. Key market trends, growth factors and opportunities
8.3.6.5.2. Market size and forecast, by Type
8.3.6.5.3. Market size and forecast, by Component
8.3.6.5.4. Market size and forecast, by Network Type
8.3.6.5.5. Market size and forecast, by Deployment
8.3.6.6. Rest of Europe
8.3.6.6.1. Key market trends, growth factors and opportunities
8.3.6.6.2. Market size and forecast, by Type
8.3.6.6.3. Market size and forecast, by Component
8.3.6.6.4. Market size and forecast, by Network Type
8.3.6.6.5. Market size and forecast, by Deployment
8.4. Asia-Pacific
8.4.1. Key trends and opportunities
8.4.2. Market size and forecast, by Type
8.4.3. Market size and forecast, by Component
8.4.4. Market size and forecast, by Network Type
8.4.5. Market size and forecast, by Deployment
8.4.6. Market size and forecast, by country
8.4.6.1. China
8.4.6.1.1. Key market trends, growth factors and opportunities
8.4.6.1.2. Market size and forecast, by Type
8.4.6.1.3. Market size and forecast, by Component
8.4.6.1.4. Market size and forecast, by Network Type
8.4.6.1.5. Market size and forecast, by Deployment
8.4.6.2. Japan
8.4.6.2.1. Key market trends, growth factors and opportunities
8.4.6.2.2. Market size and forecast, by Type
8.4.6.2.3. Market size and forecast, by Component
8.4.6.2.4. Market size and forecast, by Network Type
8.4.6.2.5. Market size and forecast, by Deployment
8.4.6.3. India
8.4.6.3.1. Key market trends, growth factors and opportunities
8.4.6.3.2. Market size and forecast, by Type
8.4.6.3.3. Market size and forecast, by Component
8.4.6.3.4. Market size and forecast, by Network Type
8.4.6.3.5. Market size and forecast, by Deployment
8.4.6.4. South Korea
8.4.6.4.1. Key market trends, growth factors and opportunities
8.4.6.4.2. Market size and forecast, by Type
8.4.6.4.3. Market size and forecast, by Component
8.4.6.4.4. Market size and forecast, by Network Type
8.4.6.4.5. Market size and forecast, by Deployment
8.4.6.5. Australia
8.4.6.5.1. Key market trends, growth factors and opportunities
8.4.6.5.2. Market size and forecast, by Type
8.4.6.5.3. Market size and forecast, by Component
8.4.6.5.4. Market size and forecast, by Network Type
8.4.6.5.5. Market size and forecast, by Deployment
8.4.6.6. Rest of Asia-Pacific
8.4.6.6.1. Key market trends, growth factors and opportunities
8.4.6.6.2. Market size and forecast, by Type
8.4.6.6.3. Market size and forecast, by Component
8.4.6.6.4. Market size and forecast, by Network Type
8.4.6.6.5. Market size and forecast, by Deployment
8.5. LAMEA
8.5.1. Key trends and opportunities
8.5.2. Market size and forecast, by Type
8.5.3. Market size and forecast, by Component
8.5.4. Market size and forecast, by Network Type
8.5.5. Market size and forecast, by Deployment
8.5.6. Market size and forecast, by country
8.5.6.1. Brazil
8.5.6.1.1. Key market trends, growth factors and opportunities
8.5.6.1.2. Market size and forecast, by Type
8.5.6.1.3. Market size and forecast, by Component
8.5.6.1.4. Market size and forecast, by Network Type
8.5.6.1.5. Market size and forecast, by Deployment
8.5.6.2. Saudi Arabia
8.5.6.2.1. Key market trends, growth factors and opportunities
8.5.6.2.2. Market size and forecast, by Type
8.5.6.2.3. Market size and forecast, by Component
8.5.6.2.4. Market size and forecast, by Network Type
8.5.6.2.5. Market size and forecast, by Deployment
8.5.6.3. UAE
8.5.6.3.1. Key market trends, growth factors and opportunities
8.5.6.3.2. Market size and forecast, by Type
8.5.6.3.3. Market size and forecast, by Component
8.5.6.3.4. Market size and forecast, by Network Type
8.5.6.3.5. Market size and forecast, by Deployment
8.5.6.4. South Africa
8.5.6.4.1. Key market trends, growth factors and opportunities
8.5.6.4.2. Market size and forecast, by Type
8.5.6.4.3. Market size and forecast, by Component
8.5.6.4.4. Market size and forecast, by Network Type
8.5.6.4.5. Market size and forecast, by Deployment
8.5.6.5. Rest of Europe
8.5.6.5.1. Key market trends, growth factors and opportunities
8.5.6.5.2. Market size and forecast, by Type
8.5.6.5.3. Market size and forecast, by Component
8.5.6.5.4. Market size and forecast, by Network Type
8.5.6.5.5. Market size and forecast, by Deployment
CHAPTER 9: COMPETITIVE LANDSCAPE
9.1. Introduction
9.2. Top winning strategies
9.3. Product Mapping of Top 10 Player
9.4. Competitive Dashboard
9.5. Competitive Heatmap
9.6. Top player positioning, 2021
CHAPTER 10: COMPANY PROFILES
10.1. Huawei Technologies Co., Ltd.
10.1.1. Company overview
10.1.2. Key Executives
10.1.3. Company snapshot
10.2. Nokia Corporation
10.2.1. Company overview
10.2.2. Key Executives
10.2.3. Company snapshot
10.3. ERICSSON
10.3.1. Company overview
10.3.2. Key Executives
10.3.3. Company snapshot
10.4. SAMSUNG
10.4.1. Company overview
10.4.2. Key Executives
10.4.3. Company snapshot
10.5. ZTE Corporation
10.5.1. Company overview
10.5.2. Key Executives
10.5.3. Company snapshot
10.6. Altiostar
10.6.1. Company overview
10.6.2. Key Executives
10.6.3. Company snapshot
10.7. ASOCS Ltd
10.7.1. Company overview
10.7.2. Key Executives
10.7.3. Company snapshot
10.8. NEC Corporation.
10.8.1. Company overview
10.8.2. Key Executives
10.8.3. Company snapshot
10.9. Fujitsu Ltd.
10.9.1. Company overview
10.9.2. Key Executives
10.9.3. Company snapshot
10.10. Cisco Systems Inc.
10.10.1. Company overview
10.10.2. Key Executives
10.10.3. Company snapsho
LIST OF TABLES
TABLE 01. GLOBAL CLOUD RAN MARKET, BY TYPE, 2021-2031 ($MILLION)
TABLE 02. CLOUD RAN MARKET FOR CENTRALIZED-RAN, BY REGION, 2021-2031 ($MILLION)
TABLE 03. CLOUD RAN MARKET FOR VIRTUALIZED/CLOUD RAN, BY REGION, 2021-2031 ($MILLION)
TABLE 04. GLOBAL CLOUD RAN MARKET, BY COMPONENT, 2021-2031 ($MILLION)
TABLE 05. CLOUD RAN MARKET FOR SOLUTIONS, BY REGION, 2021-2031 ($MILLION)
TABLE 06. CLOUD RAN MARKET FOR SERVICES, BY REGION, 2021-2031 ($MILLION)
TABLE 07. GLOBAL CLOUD RAN MARKET, BY NETWORK TYPE, 2021-2031 ($MILLION)
TABLE 08. CLOUD RAN MARKET FOR 3G, BY REGION, 2021-2031 ($MILLION)
TABLE 09. CLOUD RAN MARKET FOR 4G, BY REGION, 2021-2031 ($MILLION)
TABLE 10. CLOUD RAN MARKET FOR 5G, BY REGION, 2021-2031 ($MILLION)
TABLE 11. GLOBAL CLOUD RAN MARKET, BY DEPLOYMENT, 2021-2031 ($MILLION)
TABLE 12. CLOUD RAN MARKET FOR OUTDOOR, BY REGION, 2021-2031 ($MILLION)
TABLE 13. CLOUD RAN MARKET FOR INDOOR, BY REGION, 2021-2031 ($MILLION)
TABLE 14. CLOUD RAN MARKET, BY REGION, 2021-2031 ($MILLION)
TABLE 15. NORTH AMERICA CLOUD RAN MARKET, BY TYPE, 2021-2031 ($MILLION)
TABLE 16. NORTH AMERICA CLOUD RAN MARKET, BY COMPONENT, 2021-2031 ($MILLION)
TABLE 17. NORTH AMERICA CLOUD RAN MARKET, BY NETWORK TYPE, 2021-2031 ($MILLION)
TABLE 18. NORTH AMERICA CLOUD RAN MARKET, BY DEPLOYMENT, 2021-2031 ($MILLION)
TABLE 19. NORTH AMERICA CLOUD RAN MARKET, BY COUNTRY, 2021-2031 ($MILLION)
TABLE 20. U.S. CLOUD RAN MARKET, BY TYPE, 2021-2031 ($MILLION)
TABLE 21. U.S. CLOUD RAN MARKET, BY COMPONENT, 2021-2031 ($MILLION)
TABLE 22. U.S. CLOUD RAN MARKET, BY NETWORK TYPE, 2021-2031 ($MILLION)
TABLE 23. U.S. CLOUD RAN MARKET, BY DEPLOYMENT, 2021-2031 ($MILLION)
TABLE 24. CANADA CLOUD RAN MARKET, BY TYPE, 2021-2031 ($MILLION)
TABLE 25. CANADA CLOUD RAN MARKET, BY COMPONENT, 2021-2031 ($MILLION)
TABLE 26. CANADA CLOUD RAN MARKET, BY NETWORK TYPE, 2021-2031 ($MILLION)
TABLE 27. CANADA CLOUD RAN MARKET, BY DEPLOYMENT, 2021-2031 ($MILLION)
TABLE 28. MEXICO CLOUD RAN MARKET, BY TYPE, 2021-2031 ($MILLION)
TABLE 29. MEXICO CLOUD RAN MARKET, BY COMPONENT, 2021-2031 ($MILLION)
TABLE 30. MEXICO CLOUD RAN MARKET, BY NETWORK TYPE, 2021-2031 ($MILLION)
TABLE 31. MEXICO CLOUD RAN MARKET, BY DEPLOYMENT, 2021-2031 ($MILLION)
TABLE 32. EUROPE CLOUD RAN MARKET, BY TYPE, 2021-2031 ($MILLION)
TABLE 33. EUROPE CLOUD RAN MARKET, BY COMPONENT, 2021-2031 ($MILLION)
TABLE 34. EUROPE CLOUD RAN MARKET, BY NETWORK TYPE, 2021-2031 ($MILLION)
TABLE 35. EUROPE CLOUD RAN MARKET, BY DEPLOYMENT, 2021-2031 ($MILLION)
TABLE 36. EUROPE CLOUD RAN MARKET, BY COUNTRY, 2021-2031 ($MILLION)
TABLE 37. GERMANY CLOUD RAN MARKET, BY TYPE, 2021-2031 ($MILLION)
TABLE 38. GERMANY CLOUD RAN MARKET, BY COMPONENT, 2021-2031 ($MILLION)
TABLE 39. GERMANY CLOUD RAN MARKET, BY NETWORK TYPE, 2021-2031 ($MILLION)
TABLE 40. GERMANY CLOUD RAN MARKET, BY DEPLOYMENT, 2021-2031 ($MILLION)
TABLE 41. UK CLOUD RAN MARKET, BY TYPE, 2021-2031 ($MILLION)
TABLE 42. UK CLOUD RAN MARKET, BY COMPONENT, 2021-2031 ($MILLION)
TABLE 43. UK CLOUD RAN MARKET, BY NETWORK TYPE, 2021-2031 ($MILLION)
TABLE 44. UK CLOUD RAN MARKET, BY DEPLOYMENT, 2021-2031 ($MILLION)
TABLE 45. FRANCE CLOUD RAN MARKET, BY TYPE, 2021-2031 ($MILLION)
TABLE 46. FRANCE CLOUD RAN MARKET, BY COMPONENT, 2021-2031 ($MILLION)
TABLE 47. FRANCE CLOUD RAN MARKET, BY NETWORK TYPE, 2021-2031 ($MILLION)
TABLE 48. FRANCE CLOUD RAN MARKET, BY DEPLOYMENT, 2021-2031 ($MILLION)
TABLE 49. SPAIN CLOUD RAN MARKET, BY TYPE, 2021-2031 ($MILLION)
TABLE 50. SPAIN CLOUD RAN MARKET, BY COMPONENT, 2021-2031 ($MILLION)
TABLE 51. SPAIN CLOUD RAN MARKET, BY NETWORK TYPE, 2021-2031 ($MILLION)
TABLE 52. SPAIN CLOUD RAN MARKET, BY DEPLOYMENT, 2021-2031 ($MILLION)
TABLE 53. ITALY CLOUD RAN MARKET, BY TYPE, 2021-2031 ($MILLION)
TABLE 54. ITALY CLOUD RAN MARKET, BY COMPONENT, 2021-2031 ($MILLION)
TABLE 55. ITALY CLOUD RAN MARKET, BY NETWORK TYPE, 2021-2031 ($MILLION)
TABLE 56. ITALY CLOUD RAN MARKET, BY DEPLOYMENT, 2021-2031 ($MILLION)
TABLE 57. REST OF EUROPE CLOUD RAN MARKET, BY TYPE, 2021-2031 ($MILLION)
TABLE 58. REST OF EUROPE CLOUD RAN MARKET, BY COMPONENT, 2021-2031 ($MILLION)
TABLE 59. REST OF EUROPE CLOUD RAN MARKET, BY NETWORK TYPE, 2021-2031 ($MILLION)
TABLE 60. REST OF EUROPE CLOUD RAN MARKET, BY DEPLOYMENT, 2021-2031 ($MILLION)
TABLE 61. ASIA-PACIFIC CLOUD RAN MARKET, BY TYPE, 2021-2031 ($MILLION)
TABLE 62. ASIA-PACIFIC CLOUD RAN MARKET, BY COMPONENT, 2021-2031 ($MILLION)
TABLE 63. ASIA-PACIFIC CLOUD RAN MARKET, BY NETWORK TYPE, 2021-2031 ($MILLION)
TABLE 64. ASIA-PACIFIC CLOUD RAN MARKET, BY DEPLOYMENT, 2021-2031 ($MILLION)
TABLE 65. ASIA-PACIFIC CLOUD RAN MARKET, BY COUNTRY, 2021-2031 ($MILLION)
TABLE 66. CHINA CLOUD RAN MARKET, BY TYPE, 2021-2031 ($MILLION)
TABLE 67. CHINA CLOUD RAN MARKET, BY COMPONENT, 2021-2031 ($MILLION)
TABLE 68. CHINA CLOUD RAN MARKET, BY NETWORK TYPE, 2021-2031 ($MILLION)
TABLE 69. CHINA CLOUD RAN MARKET, BY DEPLOYMENT, 2021-2031 ($MILLION)
TABLE 70. JAPAN CLOUD RAN MARKET, BY TYPE, 2021-2031 ($MILLION)
TABLE 71. JAPAN CLOUD RAN MARKET, BY COMPONENT, 2021-2031 ($MILLION)
TABLE 72. JAPAN CLOUD RAN MARKET, BY NETWORK TYPE, 2021-2031 ($MILLION)
TABLE 73. JAPAN CLOUD RAN MARKET, BY DEPLOYMENT, 2021-2031 ($MILLION)
TABLE 74. INDIA CLOUD RAN MARKET, BY TYPE, 2021-2031 ($MILLION)
TABLE 75. INDIA CLOUD RAN MARKET, BY COMPONENT, 2021-2031 ($MILLION)
TABLE 76. INDIA CLOUD RAN MARKET, BY NETWORK TYPE, 2021-2031 ($MILLION)
TABLE 77. INDIA CLOUD RAN MARKET, BY DEPLOYMENT, 2021-2031 ($MILLION)
TABLE 78. SOUTH KOREA CLOUD RAN MARKET, BY TYPE, 2021-2031 ($MILLION)
TABLE 79. SOUTH KOREA CLOUD RAN MARKET, BY COMPONENT, 2021-2031 ($MILLION)
TABLE 80. SOUTH KOREA CLOUD RAN MARKET, BY NETWORK TYPE, 2021-2031 ($MILLION)
TABLE 81. SOUTH KOREA CLOUD RAN MARKET, BY DEPLOYMENT, 2021-2031 ($MILLION)
TABLE 82. AUSTRALIA CLOUD RAN MARKET, BY TYPE, 2021-2031 ($MILLION)
TABLE 83. AUSTRALIA CLOUD RAN MARKET, BY COMPONENT, 2021-2031 ($MILLION)
TABLE 84. AUSTRALIA CLOUD RAN MARKET, BY NETWORK TYPE, 2021-2031 ($MILLION)
TABLE 85. AUSTRALIA CLOUD RAN MARKET, BY DEPLOYMENT, 2021-2031 ($MILLION)
TABLE 86. REST OF ASIA-PACIFIC CLOUD RAN MARKET, BY TYPE, 2021-2031 ($MILLION)
TABLE 87. REST OF ASIA-PACIFIC CLOUD RAN MARKET, BY COMPONENT, 2021-2031 ($MILLION)
TABLE 88. REST OF ASIA-PACIFIC CLOUD RAN MARKET, BY NETWORK TYPE, 2021-2031 ($MILLION)
TABLE 89. REST OF ASIA-PACIFIC CLOUD RAN MARKET, BY DEPLOYMENT, 2021-2031 ($MILLION)
TABLE 90. LAMEA CLOUD RAN MARKET, BY TYPE, 2021-2031 ($MILLION)
TABLE 91. LAMEA CLOUD RAN MARKET, BY COMPONENT, 2021-2031 ($MILLION)
TABLE 92. LAMEA CLOUD RAN MARKET, BY NETWORK TYPE, 2021-2031 ($MILLION)
TABLE 93. LAMEA CLOUD RAN MARKET, BY DEPLOYMENT, 2021-2031 ($MILLION)
TABLE 94. LAMEA CLOUD RAN MARKET, BY COUNTRY, 2021-2031 ($MILLION)
TABLE 95. BRAZIL CLOUD RAN MARKET, BY TYPE, 2021-2031 ($MILLION)
TABLE 96. BRAZIL CLOUD RAN MARKET, BY COMPONENT, 2021-2031 ($MILLION)
TABLE 97. BRAZIL CLOUD RAN MARKET, BY NETWORK TYPE, 2021-2031 ($MILLION)
TABLE 98. BRAZIL CLOUD RAN MARKET, BY DEPLOYMENT, 2021-2031 ($MILLION)
TABLE 99. SAUDI ARABIA CLOUD RAN MARKET, BY TYPE, 2021-2031 ($MILLION)
TABLE 100. SAUDI ARABIA CLOUD RAN MARKET, BY COMPONENT, 2021-2031 ($MILLION)
TABLE 101. SAUDI ARABIA CLOUD RAN MARKET, BY NETWORK TYPE, 2021-2031 ($MILLION)
TABLE 102. SAUDI ARABIA CLOUD RAN MARKET, BY DEPLOYMENT, 2021-2031 ($MILLION)
TABLE 103. UAE CLOUD RAN MARKET, BY TYPE, 2021-2031 ($MILLION)
TABLE 104. UAE CLOUD RAN MARKET, BY COMPONENT, 2021-2031 ($MILLION)
TABLE 105. UAE CLOUD RAN MARKET, BY NETWORK TYPE, 2021-2031 ($MILLION)
TABLE 106. UAE CLOUD RAN MARKET, BY DEPLOYMENT, 2021-2031 ($MILLION)
TABLE 107. SOUTH AFRICA CLOUD RAN MARKET, BY TYPE, 2021-2031 ($MILLION)
TABLE 108. SOUTH AFRICA CLOUD RAN MARKET, BY COMPONENT, 2021-2031 ($MILLION)
TABLE 109. SOUTH AFRICA CLOUD RAN MARKET, BY NETWORK TYPE, 2021-2031 ($MILLION)
TABLE 110. SOUTH AFRICA CLOUD RAN MARKET, BY DEPLOYMENT, 2021-2031 ($MILLION)
TABLE 111. REST OF EUROPE CLOUD RAN MARKET, BY TYPE, 2021-2031 ($MILLION)
TABLE 112. REST OF EUROPE CLOUD RAN MARKET, BY COMPONENT, 2021-2031 ($MILLION)
TABLE 113. REST OF EUROPE CLOUD RAN MARKET, BY NETWORK TYPE, 2021-2031 ($MILLION)
TABLE 114. REST OF EUROPE CLOUD RAN MARKET, BY DEPLOYMENT, 2021-2031 ($MILLION)
TABLE 115. HUAWEI TECHNOLOGIES CO., LTD.: KEY EXECUTIVES
TABLE 116. HUAWEI TECHNOLOGIES CO., LTD.: COMPANY SNAPSHOT
TABLE 117. NOKIA CORPORATION: KEY EXECUTIVES
TABLE 118. NOKIA CORPORATION: COMPANY SNAPSHOT
TABLE 119. ERICSSON: KEY EXECUTIVES
TABLE 120. ERICSSON: COMPANY SNAPSHOT
TABLE 121. SAMSUNG: KEY EXECUTIVES
TABLE 122. SAMSUNG: COMPANY SNAPSHOT
TABLE 123. ZTE CORPORATION: KEY EXECUTIVES
TABLE 124. ZTE CORPORATION: COMPANY SNAPSHOT
TABLE 125. ALTIOSTAR: KEY EXECUTIVES
TABLE 126. ALTIOSTAR: COMPANY SNAPSHOT
TABLE 127. ASOCS LTD: KEY EXECUTIVES
TABLE 128. ASOCS LTD: COMPANY SNAPSHOT
TABLE 129. NEC CORPORATION.: KEY EXECUTIVES
TABLE 130. NEC CORPORATION.: COMPANY SNAPSHOT
TABLE 131. FUJITSU LTD.: KEY EXECUTIVES
TABLE 132. FUJITSU LTD.: COMPANY SNAPSHOT
TABLE 133. CISCO SYSTEMS INC.: KEY EXECUTIVES
TABLE 134. CISCO SYSTEMS INC.: COMPANY SNAPSHOT LIST OF FIGURES
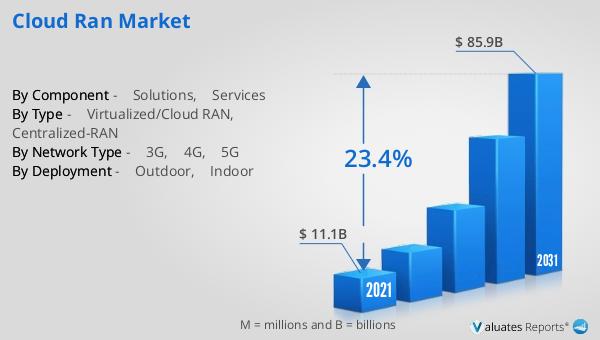
FIGURE 01. CLOUD RAN MARKET, 2021-2031
FIGURE 02. SEGMENTATION OF CLOUD RAN MARKET, 2021-2031
FIGURE 03. TOP INVESTMENT POCKETS IN CLOUD RAN MARKET (2022-2031)
FIGURE 04. PORTER FIVE-1
FIGURE 05. PORTER FIVE-2
FIGURE 06. PORTER FIVE-3
FIGURE 07. PORTER FIVE-4
FIGURE 08. PORTER FIVE-5
FIGURE 09. DRIVERS, RESTRAINTS AND OPPORTUNITIES: GLOBALCLOUD RAN MARKET
FIGURE 10. IMPACT OF KEY REGULATION: CLOUD RAN MARKET
FIGURE 11. MARKET SHARE ANALYSIS: CLOUD RAN MARKET
FIGURE 12. PATENT ANALYSIS BY COMPANY
FIGURE 13. PATENT ANALYSIS BY COUNTRY
FIGURE 14. REGULATORY GUIDELINES: CLOUD RAN MARKET
FIGURE 15. VALUE CHAIN ANALYSIS: CLOUD RAN MARKET
FIGURE 16. CLOUD RAN MARKET, BY TYPE, 2021(%)
FIGURE 17. COMPARATIVE SHARE ANALYSIS OF CLOUD RAN MARKET FOR CENTRALIZED-RAN, BY COUNTRY 2021-2031(%)
FIGURE 18. COMPARATIVE SHARE ANALYSIS OF CLOUD RAN MARKET FOR VIRTUALIZED/CLOUD RAN, BY COUNTRY 2021-2031(%)
FIGURE 19. CLOUD RAN MARKET, BY COMPONENT, 2021(%)
FIGURE 20. COMPARATIVE SHARE ANALYSIS OF CLOUD RAN MARKET FOR SOLUTIONS, BY COUNTRY 2021-2031(%)
FIGURE 21. COMPARATIVE SHARE ANALYSIS OF CLOUD RAN MARKET FOR SERVICES, BY COUNTRY 2021-2031(%)
FIGURE 22. CLOUD RAN MARKET, BY NETWORK TYPE, 2021(%)
FIGURE 23. COMPARATIVE SHARE ANALYSIS OF CLOUD RAN MARKET FOR 3G, BY COUNTRY 2021-2031(%)
FIGURE 24. COMPARATIVE SHARE ANALYSIS OF CLOUD RAN MARKET FOR 4G, BY COUNTRY 2021-2031(%)
FIGURE 25. COMPARATIVE SHARE ANALYSIS OF CLOUD RAN MARKET FOR 5G, BY COUNTRY 2021-2031(%)
FIGURE 26. CLOUD RAN MARKET, BY DEPLOYMENT, 2021(%)
FIGURE 27. COMPARATIVE SHARE ANALYSIS OF CLOUD RAN MARKET FOR OUTDOOR, BY COUNTRY 2021-2031(%)
FIGURE 28. COMPARATIVE SHARE ANALYSIS OF CLOUD RAN MARKET FOR INDOOR, BY COUNTRY 2021-2031(%)
FIGURE 29. CLOUD RAN MARKET BY REGION, 2021
FIGURE 30. U.S. CLOUD RAN MARKET, 2021-2031 ($MILLION)
FIGURE 31. CANADA CLOUD RAN MARKET, 2021-2031 ($MILLION)
FIGURE 32. MEXICO CLOUD RAN MARKET, 2021-2031 ($MILLION)
FIGURE 33. GERMANY CLOUD RAN MARKET, 2021-2031 ($MILLION)
FIGURE 34. UK CLOUD RAN MARKET, 2021-2031 ($MILLION)
FIGURE 35. FRANCE CLOUD RAN MARKET, 2021-2031 ($MILLION)
FIGURE 36. SPAIN CLOUD RAN MARKET, 2021-2031 ($MILLION)
FIGURE 37. ITALY CLOUD RAN MARKET, 2021-2031 ($MILLION)
FIGURE 38. REST OF EUROPE CLOUD RAN MARKET, 2021-2031 ($MILLION)
FIGURE 39. CHINA CLOUD RAN MARKET, 2021-2031 ($MILLION)
FIGURE 40. JAPAN CLOUD RAN MARKET, 2021-2031 ($MILLION)
FIGURE 41. INDIA CLOUD RAN MARKET, 2021-2031 ($MILLION)
FIGURE 42. SOUTH KOREA CLOUD RAN MARKET, 2021-2031 ($MILLION)
FIGURE 43. AUSTRALIA CLOUD RAN MARKET, 2021-2031 ($MILLION)
FIGURE 44. REST OF ASIA-PACIFIC CLOUD RAN MARKET, 2021-2031 ($MILLION)
FIGURE 45. BRAZIL CLOUD RAN MARKET, 2021-2031 ($MILLION)
FIGURE 46. SAUDI ARABIA CLOUD RAN MARKET, 2021-2031 ($MILLION)
FIGURE 47. UAE CLOUD RAN MARKET, 2021-2031 ($MILLION)
FIGURE 48. SOUTH AFRICA CLOUD RAN MARKET, 2021-2031 ($MILLION)
FIGURE 49. REST OF EUROPE CLOUD RAN MARKET, 2021-2031 ($MILLION)
FIGURE 50. TOP WINNING STRATEGIES, BY YEAR
FIGURE 51. TOP WINNING STRATEGIES, BY DEVELOPMENT
FIGURE 52. TOP WINNING STRATEGIES, BY COMPANY
FIGURE 53. PRODUCT MAPPING OF TOP 10 PLAYERS
FIGURE 54. COMPETITIVE DASHBOARD
FIGURE 55. COMPETITIVE HEATMAP: CLOUD RAN MARKET
FIGURE 56. TOP PLAYER POSITIONING, 202
SELECT A FORMAT
Added to Cart
Electronic (PDF)

$5730

This license allows only one user to access the PDF.
Electronic (PDF)

$6450

This license allows 1 - 5 user to access the PDF, license is suitable for small groups of 5 users working together
Electronic (PDF)

$9600

This license allows users/teams in a same Enterprise to use this report, various departments within an enterpise can use this report
Electronic (PDF)

$3840

This license just provides quantitative data in a excel sheet
Add to Cart
Buy Now (15% Discount)

OUR CUSTOMER

SecuX Technology Inc

SIMILAR REPORTS