0
U.S. (TOLL FREE)
+1 (315) 215-3225
Automative

0
U.S. (TOLL FREE)
+1 (315) 215-3225
Reishi Mushroom Market by Form (Liquid and Powder), End Use (Pharmaceutical, Nutraceutical & Dietary Supplements, and Cosmetics & Personal Care), and Nature (Organic and Conventional): Global Opportunity Analysis and Industry Forecast, 2021-2027
Published Date: March 2021
|
Report Code: ALLI-Auto-2M469
Home | Market Reports | Health| Nutrition| Vitamins & Supplements
Reishi Mushroom Market by Form Liquid and Powder End Use Pharmaceutical Nutraceutical Dietary Supplements and Cosmetics Personal Care and Nature Organic and Conventional Global Opportunity Analysis and Industry Forecast 2021 2027
BUY CHAPTERS

Reishi Mushroom Market by Form (Liquid and Powder), End Use (Pharmaceutical, Nutraceutical & Dietary Supplements, and Cosmetics & Personal Care), and Nature (Organic and Conventional): Global Opportunity Analysis and Industry Forecast, 2021-2027

Code: ALLI-Auto-2M469
Report
March 2021
Pages:235
Allied Market Research
Buy Now with 15% Discount
DESCRIPTION
TABLE OF CONTENT
TABLES & FIGURES

Reishi Mushroom Market 

The global Reishi mushroom market was valued at $3,096.9 million in 2019 and is projected to reach $5,059.4 million by 2027, registering a CAGR of 8.1% from 2021 to 2027.

Reishi Mushroom Market

In 2019, the powderreishi mushroom segment accounted for the highest share in the reishi mushroom market size. Reishi mushroom is a type of mushroom that has been used in Chinese medicine for approximately 2000 years. It has a bright surface, a woody texture, and a deep red color.These mushrooms, are generally cultivated on oak trees and plum trees, and are commonly used in Chinese medicine, however now have expanded geographical presence.

Reishi mushroom is a fungus, which belongs to the family Polyporaceae (or Ganodermaceae) of class Basidiomycetes. It grows on dead wood and various parts of the fungus namely, mycelia, spores and its fruiting body is consumed and sold in various forms as powder, capsule, tea, coffee, and others. The plant is intensively cultivated in countries all around the world, especially South-east Asian countries.
Reishi mushroom exhibits presence of various bioactive chemical constituents which reflects different biological properties, and is thus an important medicinal mushroom, used as cure of various diseases, as health tonics, and in cosmetics. This has been one of the major driving factors for the reishi mushroom market. Furthermore, the application of reishi mushroom powder as an ingredient in cosmetics & personal care products has gained high traction. This is due to its exceptional antioxidant, anti-aging, anti-wrinkle, skin whitening, and moisturizing effects, which make them ideal ingredient for cosmetics products. Hence, several multinational brands are gradually developing and launching personal care products manufactured using reishi mushroom as a chief ingredient. This is regarded as another driving factor of the reishi mushroom market. However, there are several problems with reishi mushroom based products due to their low reproducibility and poor-quality control. Various reasons such as seasonal variations, different soil conditions, and stage of fruiting body development, lead to weakened product quality. Hence, these factors are expected to hinder the growth of the market.
 
On the contrary, there has been an exponential growth in demand for organic food & beverage products owing to rise in health concerns. This can be regarded as an opportunity by manufacturers for further growth and expansion of the market through product diversification and innovation.
 
Owing to the outspread of COVID-19, the reishi mushroom market has been largely impacted due to lack of availability of workers, which in turn affected the production capacity. Furthermore, due to closures of wholesale markets, producers had to solely rely on supermarkets and e-commerce traders to market the mushroom products. Hence, the market for reishi mushrooms was largely impacted during the pandemic. However, since it is regarded as a therapeutic product, the demand for reishi mushroom is anticipated to gain higher traction in the near future. This is due to increase in consumption of dietary supplements and nutraceutical products by consumers as a means to stay healthier and gain immunity.
 
According to reishi mushroom market analysis, the market is segmented on the basis of form, end use, nature, and region. By form, the market is bifurcated into liquid and powder. By end use, the market is classified into food & beverages, pharmaceutical, nutraceutical & dietary supplements and cosmetics & personal care. By nature, the market is categorized into organic and conventional. Region wise, the market is studied across North America, Europe, Asia-Pacific and LAMEA.

Key Companies

The key players operating in the reishi mushroom market include Alphay International, Inc. (China), Bio Botanica, Inc. (U.S.), Bristol Botanicals Limited (UK), Ron Teeguarden Enterprises, Inc. (U.S.), DXN Holdings Bhd. (Malaysia), Shanghai Gubao Edible Mushroom Co., Ltd. (China), Xi'an Greena Biotech Co., Ltd (China), Fujian Xianzhilou Biological Technology Co., Ltd. (China), Hokkaido Reishi Co., Ltd. (Japan), and Nammex (North American Medicinal Mushroom Extracts).
 
By Form
  • Liquid
  • Powder

Reishi Mushroom Market By Form

By End Use

  • Food & beverages
  • Pharmaceutical, nutraceutical & dietary supplements
  • Cosmetics and personal care

Reishi Mushroom Market by End Use

By Nature

  • Organic
  • Conventional

Reishi Mushroom Market by Natural

By Region

  • North America
  • Europe
  • Asia-Pacific
  • LAMEA

Scope of Reishi Mushroom Market Report

Report Metric

Details

Report Name

Reishi Mushroom Market

Market size value in 2019

$3,096.9 million

Revenue forecast in 2027

$5,059.4 million

Growth Rate

CAGR of 8.1%

Base year considered

2019

Forecast Period

2020-2027

By Form

Liquid and Powder

By End Use

(Pharmaceutical, Nutraceutical & Dietary Supplements, and Cosmetics & Personal Care

Report Coverage

Revenue & volume forecast, company share, competitive landscape, growth factors, and trends

Segments Covered

By Type, Application, and Region

Geographic Regions Covered

North America, Europe, Asia Pacific, Latin America, Middle East & Africa

Frequently Asked Questions About This Report 

1. Do you provide chapter wise report data? 

Ans. Yes, we do provide the option to buy chapters in a report. We also can customize the report based on your specific requirements.

2. How big is the Reishi Mushroom Market?

Ans. The global reishi mushroom market was valued at $3,096.9 million in 2019, and is projected to reach $5,059.4 million by 2027, registering a CAGR of 8.1% from 2021 to 2027.

3. Does the report provides covid-19 impact analysis?

Ans. Yes, the report includes a COVID-19 impact analysis. Also, it is further extended into every individual segment of the report.

CHAPTER 1:INTRODUCTION
1.1.Report description
1.2.Key market segments
1.3.Key market benefits for stakeholders
1.4.Research methodology
1.4.1.Primary research
1.4.2.Secondary research
1.4.3.Analyst tools and models
CHAPTER 2:EXECUTIVE SUMMARY
2.1.Key findings of the study
2.1.1.Top investment pocket
2.2.CXO perspective
CHAPTER 3:MARKET OVERVIEW
3.1.Market definition and scope
3.2.Porter's five forces analysis
3.2.1.Bargaining power of suppliers
3.2.2.Bargaining power of buyer
3.2.3.Threat of new entrants
3.2.4.Threat of substitute
3.2.5.Intensity of competitive rivalry
3.3.Market dynamics snapshot
3.3.1.Drivers
3.3.1.1.Rise in functional food & beverage product applications
3.3.1.2.Increase in usage of plant-based ingredients in personal care & cosmetics
3.3.1.3.Rise in prevalence of reishi mushroom in healthcare industry
3.3.2.Restraint
3.3.2.1.High price of the products, poor quality and low reproducibility
3.3.3.Opportunity
3.3.3.1.Surge in demand for organic reishi mushroom products
3.4.COVID-19 impact on reishi mushroom market
3.5.Value chain analysis
3.6.Parent market analysis
3.7.Market share analysis
CHAPTER 4:REISHI MUSHROOM MARKET, BY FORM
4.1.Overview
4.1.1.Market size and forecast
4.2.Liquid
4.2.1.Key market trends, growth factors, and opportunities
4.2.2.Market size and forecast
4.2.3.Market analysis by country
4.3.Powder
4.3.1.Key market trends, growth factors, and opportunities
4.3.2.Market size and forecast
4.3.3.Market analysis by country
CHAPTER 5:REISHI MUSHROOM MARKET, BY END USE
5.1.Overview
5.1.1.Market size and forecast
5.2.Food & Beverages
5.2.1.Key market trends, growth factors, and opportunities
5.2.2.Market size and forecast
5.2.3.Market analysis by country
5.3.Pharmaceutical, nutraceutical & dietary supplement
5.3.1.Key market trends, growth factors, and opportunities
5.3.2.Market size and forecast
5.3.3.Market analysis by country
5.4.Cosmetics & personal care
5.4.1.Key market trends, growth factors, and opportunities
5.4.2.Market size and forecast
5.4.3.Market analysis by country
CHAPTER 6:REISHI MUSHROOM MARKET, BY NATURE
6.1.Overview
6.1.1.Market size and forecast
6.2.Organic
6.2.1.Key market trends, growth factors, and opportunities
6.2.2.Market size and forecast
6.2.3.Market analysis by country
6.3.Conventional
6.3.1.Key market trends, growth factors, and opportunities
6.3.2.Market size and fore cast
6.3.3.Market analysis by country
CHAPTER 7:REISHI MUSHROOM MARKET, BY REGION
7.1.Overview
7.1.1.Market size and forecast
7.2.North America
7.2.1.Overview
7.2.2.Key market trends, growth factors, and opportunities
7.2.3.Market size and forecast by form
7.2.4.Market size and forecast by end use
7.2.5.Market size and forecast by nature
7.2.6.Market size and forecast by country
7.2.6.1.U.S.
7.2.6.1.1.Market size and forecast, by form
7.2.6.1.2.Market size and forecast, by end use
7.2.6.1.3.Market size and forecast, by nature
7.2.6.2.Canada
7.2.6.2.1.Market size and forecast, by form
7.2.6.2.2.Market size and forecast, by end use
7.2.6.2.3.Market size and forecast, by nature
7.2.6.3.Mexico
7.2.6.3.1.Market size and forecast, by form
7.2.6.3.2.Market size and forecast, by end use
7.2.6.3.3.Market size and forecast, by nature
7.3.Europe
7.3.1.Overview
7.3.2.Key market trends, growth factors, and opportunities
7.3.3.Market size and forecast by form
7.3.4.Market size and forecast by end use
7.3.5.Market size and forecast by nature
7.3.6.Market size and forecast by country
7.3.6.1.Germany
7.3.6.1.1.Market size and forecast, by form
7.3.6.1.2.Market size and forecast, by end use
7.3.6.1.3.Market size and forecast, by nature
7.3.6.2.France
7.3.6.2.1.Market size and forecast, by form
7.3.6.2.2.Market size and forecast, by end use
7.3.6.2.3.Market size and forecast, by nature
7.3.6.3.UK
7.3.6.3.1.Market size and forecast, by form
7.3.6.3.2.Market size and forecast, by end use
7.3.6.3.3.Market size and forecast, by nature
7.3.6.4.Italy
7.3.6.4.1.Market size and forecast, by form
7.3.6.4.2.Market size and forecast, by end use
7.3.6.4.3.Market size and forecast, by nature
7.3.6.5.Spain
7.3.6.5.1.Market size and forecast, by form
7.3.6.5.2.Market size and forecast, by end use
7.3.6.5.3.Market size and forecast, by nature
7.3.6.6.Rest of Europe
7.3.6.6.1.Market size and forecast, by form
7.3.6.6.2.Market size and forecast, by end use
7.3.6.6.3.Market size and forecast, by nature
7.4.Asia-Pacific
7.4.1.Overview
7.4.2.Key market trends, growth factors, and opportunities
7.4.3.Market size and forecast by form
7.4.4.Market size and forecast by end use
7.4.5.Market size and forecast by nature
7.4.6.Market size and forecast by country
7.4.6.1.China
7.4.6.1.1.Market size and forecast, by form
7.4.6.1.2.Market size and forecast, by end use
7.4.6.1.3.Market size and forecast, by nature
7.4.6.2.India
7.4.6.2.1.Market size and forecast, by form
7.4.6.2.2.Market size and forecast, by end use
7.4.6.2.3.Market size and forecast, by nature
7.4.6.3.Japan
7.4.6.3.1.Market size and forecast, by form
7.4.6.3.2.Market size and forecast, by end use
7.4.6.3.3.Market size and forecast, by nature
7.4.6.4.Australia
7.4.6.4.1.Market size and forecast, by form
7.4.6.4.2.Market size and forecast, by end use
7.4.6.4.3.Market size and forecast, by nature
7.4.6.5.New Zealand
7.4.6.5.1.Market size and forecast, by form
7.4.6.5.2.Market size and forecast, by end use
7.4.6.5.3.Market size and forecast, by nature
7.4.6.6.Rest of Asia-Pacific
7.4.6.6.1.Market size and forecast, by form
7.4.6.6.2.Market size and forecast, by end use
7.4.6.6.3.Market size and forecast, by nature
7.5.LAMEA
7.5.1.Overview
7.5.2.Key market trends, growth factors, and opportunities
7.5.3.Market size and forecast by form
7.5.4.Market size and forecast by end use
7.5.5.Market size and forecast by nature
7.5.6.Market size and forecast by country
7.5.6.1.Colombia
7.5.6.1.1.Market size and forecast, by form
7.5.6.1.2.Market size and forecast, by end use
7.5.6.1.3.Market size and forecast, by nature
7.5.6.2.Saudi Arabia
7.5.6.2.1.Market size and forecast, by form
7.5.6.2.2.Market size and forecast, by end use
7.5.6.2.3.Market size and forecast, by nature
7.5.6.3.South Africa
7.5.6.3.1.Market size and forecast, by form
7.5.6.3.2.Market size and forecast, by end use
7.5.6.3.3.Market size and forecast, by nature
7.5.6.4.UAE
7.5.6.4.1.Market size and forecast, by form
7.5.6.4.2.Market size and forecast, by end use
7.5.6.4.3.Market size and forecast, by nature
7.5.6.5.Rest of LAMEA
7.5.6.5.1.Market size and forecast, by form
7.5.6.5.2.Market size and forecast, by end use
7.5.6.5.3.Market size and forecast, by nature
CHAPTER 8:COMPETITION LANDSCAPE
8.1.Top winning strategies
8.2.Product mapping
8.3.Competitive dashboard
8.4.Competitive heat map
8.5.Key developments
8.5.1.Agreement
8.5.2.Product Launch
CHAPTER 9:COMPANY PROFILES
9.1.ALPHAY INTERNATIONAL, INC. (CHINA)
9.1.1.Company overview
9.1.2.Key Executives
9.1.3.Company snapshot
9.1.4.Product portfolio
9.2.BIO BOTANICA, INC. (U.S.)
9.2.1.Company overview
9.2.2.Key Executives
9.2.3.Company snapshot
9.2.4.Product portfolio
9.3.BRISTOL BOTANICALS LIMITED (UK)
9.3.1.Company overview
9.3.2.Key Executives
9.3.3.Company snapshot
9.3.4.Product portfolio
9.4.RON TEEGUARDEN ENTERPRISES, INC. (U.S.)
9.4.1.Company overview
9.4.2.Key Executives
9.4.3.Company snapshot
9.4.4.Product portfolio
9.5.DXN HOLDINGS BHD. (MALAYSIA)
9.5.1.Company overview
9.5.2.Key Executives
9.5.3.Company snapshot
9.5.4.Product portfolio
9.5.5.Key strategic moves and developments
9.6.XI'AN GREENA BIOTECH CO., LTD (CHINA)
9.6.1.Company overview
9.6.2.Key Executives
9.6.3.Company snapshot
9.6.4.Product portfolio
9.7.FUJIAN XIANZHILOU BIOLOGICAL TECHNOLOGY CO., LTD. (CHINA)
9.7.1.Company overview
9.7.2.Key Executives
9.7.3.Company snapshot
9.7.4.Product portfolio
9.8.HOKKAIDO REISHI CO., LTD. (JAPAN)
9.8.1.Company overview
9.8.2.Key Executives
9.8.3.Company snapshot
9.8.4.Product portfolio
9.9.NAMMEX (NORTH AMERICAN MEDICINAL MUSHROOM EXTRACTS)
9.9.1.Company overview
9.9.2.Key Executives
9.9.3.Company snapshot
9.9.4.Product portfolio
9.10.MUSHROOM SCIENCE
9.10.1.Company overview
9.10.2.Key Executives
9.10.3.Company snapshot
9.10.4.Product portfoli
LIST OF TABLES

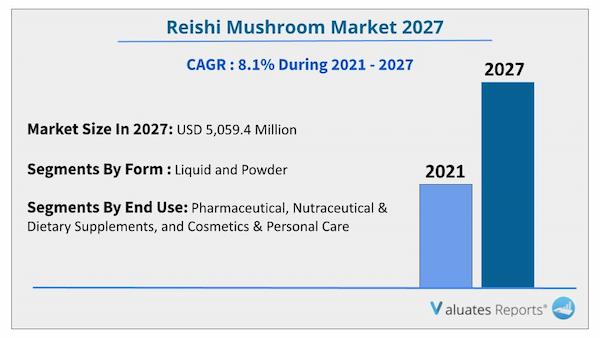
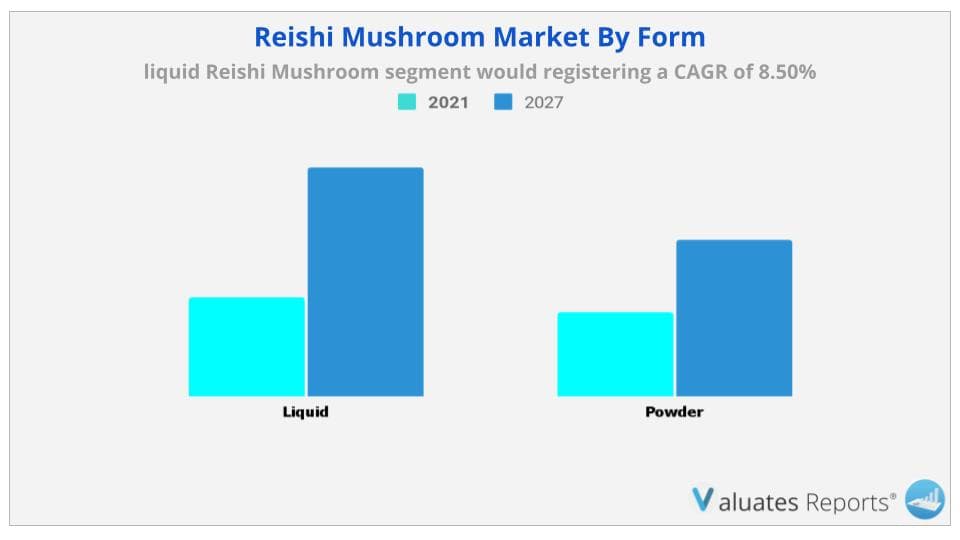
TABLE 01.GLOBAL REISHI MUSHROOM MARKET, BY FORM, 2019-2027 ($MILLION)
TABLE 02.REISHI MUSHROOM MARKET REVENUE FOR LIQUID, BY REGION, 2019–2027 ($MILLION)
TABLE 03.REISHI MUSHROOM MARKET REVENUEFOR POWDER, BY REGION, 2019–2027 ($MILLION)
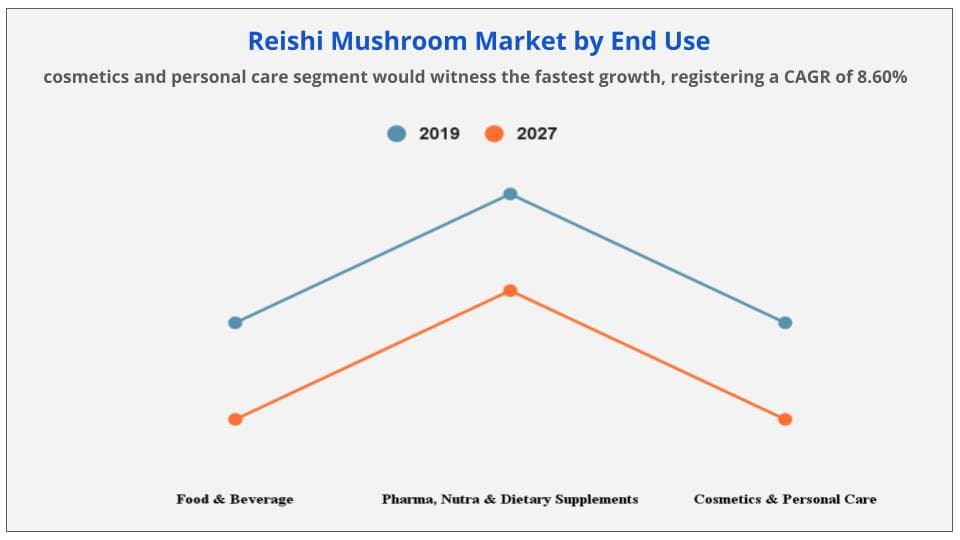
TABLE 04.REISHI MUSHROOM MARKET, BY END USE, 2019-2027 ($MILLION)
TABLE 05.REISHI MUSHROOM MARKET REVENUE FOR FOOD & BEVERAGE, BY REGION, 2019–2027 ($MILLION)
TABLE 06.REISHI MUSHROOM MARKET REVENUE FOR PHARMACEUTICAL, NUTRACEUTICAL & DIETARY SUPPLEMENTS, BY REGION, 2019–2027 ($MILLION)
TABLE 07.REISHI MUSHROOM MARKET REVENUE FOR COSMETICS AND PERSONAL CARE, BY REGION, 2019–2027 ($MILLION)
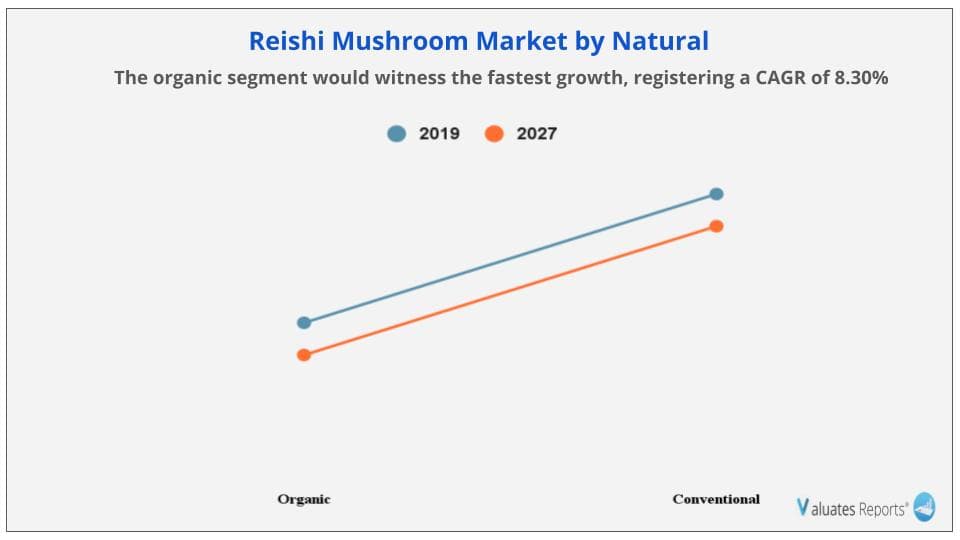
TABLE 08.REISHI MUSHROOM MARKET, BY NATURE, 2019-2027 ($MILLION)
TABLE 09.ORGANIC REISHI MUSHROOM MARKET REVENUE, BY REGION, 2019–2027 ($MILLION)
TABLE 10.CONVENTIONAL REISHI MUSHROOM MARKET REVENUE, BY REGION, 2019–2027 ($MILLION)
TABLE 11.REISHI MUSHROOM MARKET, BY REGION, 2019–2027 ($MILLION)
TABLE 12.NORTH AMERICA REISHI MUSHROOM MARKET, BY FORM, 2019–2027($MILLION)
TABLE 13.NORTH AMERICA REISHI MUSHROOM MARKET, BY END USE, 2019–2027 ($MILLION)
TABLE 14.NORTH AMERICA REISHI MUSHROOM MARKET, BY NATURE, 2019–2027 ($MILLION)
TABLE 15.NORTH AMERICA REISHI MUSHROOM MARKET, BY COUNTRY, 2019–2027 ($MILLION)
TABLE 16.U.S. REISHI MUSHROOM MARKET, BY FORM, 2019–2027 ($MILLION)
TABLE 17.U.S. REISHI MUSHROOM MARKET, BY END USE, 2019–2027 ($MILLION)
TABLE 18.U.S. REISHI MUSHROOM MARKET, BY NATURE, 2019–2027 ($MILLION)
TABLE 19.CANADA REISHI MUSHROOM MARKET, BY FORM, 2019–2027 ($MILLION)
TABLE 20.CANADA REISHI MUSHROOM MARKET, BY END USE, 2019–2027 ($MILLION)
TABLE 21.CANADA REISHI MUSHROOM MARKET, BY NATURE, 2019–2027 ($MILLION)
TABLE 22.MEXICO REISHI MUSHROOM MARKET, BY FORM, 2019–2027 ($MILLION)
TABLE 23.MEXICO REISHI MUSHROOM MARKET, BY END USE, 2019–2027 ($MILLION)
TABLE 24.MEXICO REISHI MUSHROOM MARKET, BY NATURE, 2019–2027 ($MILLION)
TABLE 25.EUROPE REISHI MUSHROOM MARKET, BY FORM, 2019–2027($MILLION)
TABLE 26.EUROPE REISHI MUSHROOM MARKET, BY END USE, 2019–2027 ($MILLION)
TABLE 27.EUROPE REISHI MUSHROOM MARKET, BY NATURE, 2019–2027 ($MILLION)
TABLE 28.EUROPE REISHI MUSHROOM MARKET, BY COUNTRY, 2019–2027 ($MILLION)
TABLE 29.GERMANY REISHI MUSHROOM MARKET, BY FORM, 2019–2027 ($MILLION)
TABLE 30.GERMANY REISHI MUSHROOM MARKET, BY END USE, 2019–2027 ($MILLION)
TABLE 31.GERMANY REISHI MUSHROOM MARKET, BY NATURE, 2019–2027 ($MILLION)
TABLE 32.FRANCE REISHI MUSHROOM MARKET, BY FORM, 2019–2027 ($MILLION)
TABLE 33.FRANCE REISHI MUSHROOM MARKET, BY END USE, 2019–2027 ($MILLION)
TABLE 34.FRANCE REISHI MUSHROOM MARKET, BY NATURE, 2019–2027 ($MILLION)
TABLE 35.UK REISHI MUSHROOM MARKET, BY FORM, 2019–2027 ($MILLION)
TABLE 36.UK REISHI MUSHROOM MARKET, BY END USE, 2019–2027 ($MILLION)
TABLE 37.UK REISHI MUSHROOM MARKET, BY NATURE, 2019–2027 ($MILLION)
TABLE 38.ITALY REISHI MUSHROOM MARKET, BY FORM, 2019–2027 ($MILLION)
TABLE 39.ITALY REISHI MUSHROOM MARKET, BY END USE, 2019–2027 ($MILLION)
TABLE 40.ITALY REISHI MUSHROOM MARKET, BY NATURE, 2019–2027 ($MILLION)
TABLE 41.SPAIN REISHI MUSHROOM MARKET, BY FORM, 2019–2027 ($MILLION)
TABLE 42.SPAIN REISHI MUSHROOM MARKET, BY END USE, 2019–2027 ($MILLION)
TABLE 43.SPAIN REISHI MUSHROOM MARKET, BY NATURE, 2019–2027 ($MILLION)
TABLE 44.REST OF EUROPE REISHI MUSHROOM MARKET, BY FORM, 2019–2027 ($MILLION)
TABLE 45.REST OF EUROPE REISHI MUSHROOM MARKET, BY END USE, 2019–2027 ($MILLION)
TABLE 46.REST OF EUROPE REISHI MUSHROOM MARKET, BY NATURE, 2019–2027 ($MILLION)
TABLE 47.ASIA-PACIFIC REISHI MUSHROOM MARKET, BY FORM, 2019–2027($MILLION)
TABLE 48.ASIA-PACIFIC REISHI MUSHROOM MARKET, BY END USE, 2019–2027 ($MILLION)
TABLE 49.ASIA-PACIFIC REISHI MUSHROOM MARKET, BY NATURE, 2019–2027 ($MILLION)
TABLE 50.ASIA-PACIFIC REISHI MUSHROOM MARKET, BY COUNTRY, 2019-2027 ($MILLION)
TABLE 51.CHINA REISHI MUSHROOM MARKET, BY FORM, 2019–2027 ($MILLION)
TABLE 52.CHINA REISHI MUSHROOM MARKET, BY END USE, 2019–2027 ($MILLION)
TABLE 53.CHINA REISHI MUSHROOM MARKET, BY NATURE, 2019–2027 ($MILLION)
TABLE 54.INDIA REISHI MUSHROOM MARKET, BY FORM, 2019–2027 ($MILLION)
TABLE 55.INDIA REISHI MUSHROOM MARKET, BY END USE, 2019–2027 ($MILLION)
TABLE 56.INDIA REISHI MUSHROOM MARKET, BY NATURE, 2019–2027 ($MILLION)
TABLE 57.JAPAN REISHI MUSHROOM MARKET, BY FORM, 2019–2027 ($MILLION)
TABLE 58.JAPAN REISHI MUSHROOM MARKET, BY END USE, 2019–2027 ($MILLION)
TABLE 59.JAPAN REISHI MUSHROOM MARKET, BY NATURE, 2019–2027 ($MILLION)
TABLE 60.AUSTRALIA REISHI MUSHROOM MARKET, BY FORM, 2019–2027 ($MILLION)
TABLE 61.AUSTRALIA REISHI MUSHROOM MARKET, BY END USE, 2019–2027 ($MILLION)
TABLE 62.AUSTRALIA REISHI MUSHROOM MARKET, BY NATURE, 2019–2027 ($MILLION)
TABLE 63.NEW ZEALAND REISHI MUSHROOM MARKET, BY FORM, 2019–2027 ($MILLION)
TABLE 64.NEW ZEALAND REISHI MUSHROOM MARKET, BY END USE, 2019–2027 ($MILLION)
TABLE 65.NEW ZEALAND REISHI MUSHROOM MARKET, BY NATURE, 2019–2027 ($MILLION)
TABLE 66.REST OF ASIA-PACIFIC REISHI MUSHROOM MARKET, BY FORM, 2019–2027 ($MILLION)
TABLE 67.REST OF ASIA-PACIFIC REISHI MUSHROOM MARKET, BY END USE, 2019–2027 ($MILLION)
TABLE 68.REST OF ASIA-PACIFIC REISHI MUSHROOM MARKET, BY NATURE, 2019–2027 ($MILLION)
TABLE 69.LAMEA REISHI MUSHROOM MARKET, BY FORM, 2019–2027($MILLION)
TABLE 70.LAMEA REISHI MUSHROOM MARKET, BY END USE, 2019–2027 ($MILLION)
TABLE 71.LAMEA REISHI MUSHROOM MARKET, BY NATURE, 2019–2027 ($MILLION)
TABLE 72.LAMEA REISHI MUSHROOM MARKET, BY COUNTRY, 2019-2027 ($MILLION)
TABLE 73.COLOMBIA REISHI MUSHROOM MARKET, BY FORM, 2019–2027 ($MILLION)
TABLE 74.COLOMBIA REISHI MUSHROOM MARKET, BY END USE, 2019–2027 ($MILLION)
TABLE 75.COLOMBIA REISHI MUSHROOM MARKET, BY NATURE, 2019–2027 ($MILLION)
TABLE 76.SAUDI ARABIA REISHI MUSHROOM MARKET, BY FORM, 2019–2027 ($MILLION)
TABLE 77.SAUDI ARABIA REISHI MUSHROOM MARKET, BY END USE, 2019–2027 ($MILLION)
TABLE 78.SAUDI ARABIA REISHI MUSHROOM MARKET, BY NATURE, 2019–2027 ($MILLION)
TABLE 79.SOUTH AFRICA REISHI MUSHROOM MARKET, BY FORM, 2019–2027 ($MILLION)
TABLE 80.SOUTH AFRICA REISHI MUSHROOM MARKET, BY END USE, 2019–2027 ($MILLION)
TABLE 81.SOUTH AFRICA REISHI MUSHROOM MARKET, BY NATURE, 2019–2027 ($MILLION)
TABLE 82.UAE REISHI MUSHROOM MARKET, BY FORM, 2019–2027 ($MILLION)
TABLE 83.UAE REISHI MUSHROOM MARKET, BY END USE, 2019–2027 ($MILLION)
TABLE 84.UAE REISHI MUSHROOM MARKET, BY NATURE, 2019–2027 ($MILLION)
TABLE 85.REST OF LAMEA REISHI MUSHROOM MARKET, BY FORM, 2019–2027 ($MILLION)
TABLE 86.REST OF LAMEA REISHI MUSHROOM MARKET, BY END USE, 2019–2027 ($MILLION)
TABLE 87.REST OF LAMEA REISHI MUSHROOM MARKET, BY NATURE, 2019–2027 ($MILLION)
TABLE 88.ALPHAY INTERNATIONAL, INC. (CHINA): KEY EXECUTIVES
TABLE 89.ALPHAY INTERNATIONAL, INC. (CHINA): COMPANY SNAPSHOT
TABLE 90.LIXIL GROUP CORPORATION: PRODUCT PORTFOLIO
TABLE 91.BIO-BOTANICA INC. (U.S.): KEY EXECUTIVES
TABLE 92.BIO-BOTANICA INC. (U.S.): COMPANY SNAPSHOT
TABLE 93.BIO-BOTANICA INC. (U.S.): PRODUCT PORTFOLIO
TABLE 94.BRISTOL BOTANICAL LIMITED: KEY EXECUTIVES
TABLE 95.BRISTOL BOTANICAL LIMITED: COMPANY SNAPSHOT
TABLE 96.BRISTOL BOTANICAL LIMITED: PRODUCT PORTFOLIO
TABLE 97.RON TEEGUARDEN ENTERPRISES, INC.: KEY EXECUTIVES
TABLE 98.RON TEEGUARDEN ENTERPRISES, INC.: COMPANY SNAPSHOT
TABLE 99.RON TEEGUARDEN ENTERPRISES, INC.: PRODUCT PORTFOLIO
TABLE 100.DXN HOLDINGS BHD.: KEY EXECUTIVES
TABLE 101.DXN HOLDINGS BHD.: COMPANY SNAPSHOT
TABLE 102.DXN HOLDINGS BHD.: PRODUCT PORTFOLIO
TABLE 103.XI'AN GREENA BIOTECH CO.,LTD.: KEY EXECUTIVES
TABLE 104.XI'AN GREENA BIOTECH CO.,LTD.: COMPANY SNAPSHOT
TABLE 105.XI'AN GREENA BIOTECH CO.,LTD.: PRODUCT PORTFOLIO
TABLE 106.FUJIAN XIANZHILOU BIOLOGICAL TECHNOLOGY CO., LTD.: KEY EXECUTIVES
TABLE 107.FUJIAN XIANZHILOU BIOLOGICAL TECHNOLOGY CO., LTD.: COMPANY SNAPSHOT
TABLE 108.FUJIAN XIANZHILOU BIOLOGICAL TECHNOLOGY CO., LTD.: PRODUCT PORTFOLIO
TABLE 109.HOKKAIDO REISHI CO., LTD.: KEY EXECUTIVES
TABLE 110.HOKKAIDO REISHI CO., LTD.: COMPANY SNAPSHOT
TABLE 111.HOKKAIDO REISHI CO., LTD.: PRODUCT PORTFOLIO
TABLE 112.NAMMEX: KEY EXECUTIVES
TABLE 113.NAMMEX: COMPANY SNAPSHOT
TABLE 114.NAMMEX: PRODUCT PORTFOLIO
TABLE 115.MUSHROOM SCIENCE: KEY EXECUTIVES
TABLE 116.MUSHROOM SCIENCE: COMPANY SNAPSHOT
TABLE 117.MUSHROOM SCIENCE: PRODUCT PORTFOLIO LIST OF FIGURES

FIGURE 01.KEY MARKET SEGMENTS
FIGURE 02.MARKET EXECUTIVE SNAPSHOT
FIGURE 03.TOP INVESTMENT POCKETS, BY NATURE
FIGURE 04.BARGAINING POWER OF SUPPLIERS
FIGURE 05.MODERATE BARGAINING POWER OF BUYERS
FIGURE 06.MODERATE THREAT OF NEW ENTRANTS
FIGURE 07.MODERATE THREAT OF SUBSTITUTION
FIGURE 08.HIGH INTENSITY OF COMPETITIVE RIVALRY
FIGURE 09.IMPACT OF COVID 19 ON REISHI MUSHROOM MARKET (%)
FIGURE 10.REISHI MUSHROOM - VALUE CHAIN ANALYSIS
FIGURE 11.REISHI MUSHROOM – PARENT MARKET ANALYSIS
FIGURE 12.BY FORM
FIGURE 13.BY END USE
FIGURE 14.BY NATURE
FIGURE 15.BY REGION
FIGURE 16.GLOBAL REISHI MUSHROOM MARKET SHARE, BY FORM, 2019(%)
FIGURE 17.COMPARATIVE SHARE ANALYSIS FOR REISHI MUSHROOM MARKET REVENUE FOR LIQUID, BY COUNTRY, 2019 & 2027 (%)
FIGURE 18.COMPARATIVE SHARE ANALYSIS FOR REISHI MUSHROOM MARKET REVENUE FOR POWDER, BY COUNTRY, 2019 & 2027 (%)
FIGURE 19.REISHI MUSHROOM MARKET SHARE, BY END USE, 2019(%)
FIGURE 20.COMPARATIVE SHARE ANALYSIS OF REISHI MUSHROOM MARKET REVENUE FOR FOOD & BEVERAGES, BY COUNTRY, 2019 & 2027 (%)
FIGURE 21.COMPARATIVE SHARE ANALYSIS REISHI MUSHROOM MARKET REVENUE FOR PHARMACEUTICAL, NUTRACEUTICAL & DIETARY SUPPLEMENTS, BY COUNTRY, 2019 & 2027 (%)
FIGURE 22.COMPARATIVE SHARE ANALYSIS REISHI MUSHROOM MARKET REVENUE FOR COSMETICS AND PERSONAL CARE, BY COUNTRY, 2019 & 2027 (%)
FIGURE 23.REISHI MUSHROOM MARKET SHARE, BY NATURE, 2019(%)
FIGURE 24.COMPARATIVE SHARE ANALYSIS OF ORGANIC REISHI MUSHROOM MARKET REVENUE, BY COUNTRY, 2019 & 2027 (%)
FIGURE 25.COMPARATIVE SHARE ANALYSIS OF CONVENTIONAL REISHI MUSHROOM MARKET REVENUE, BY COUNTRY, 2019 & 2027 (%)
FIGURE 26.REISHI MUSHROOM MARKET SHARE, BY REGION, 2019(%)
FIGURE 27.U.S. REISHI MUSHROOM MARKET, 2019–2027 ($MILLION)
FIGURE 28.CANADA REISHI MUSHROOM MARKET, 2019–2027 ($MILLION)
FIGURE 29.MEXICO REISHI MUSHROOM MARKET, 2019–2027 ($MILLION)
FIGURE 30.GERMANY REISHI MUSHROOM MARKET, 2019-2027 ($MILLION)
FIGURE 31.FRANCE REISHI MUSHROOM MARKET, 2019-2027 ($MILLION)
FIGURE 32.UK REISHI MUSHROOM MARKET, 2019-2027 ($MILLION)
FIGURE 33.ITALY REISHI MUSHROOM MARKET, 2019-2027 ($MILLION)
FIGURE 34.SPAIN REISHI MUSHROOM MARKET, 2019-2027 ($MILLION)
FIGURE 35.REST OF EUROPE REISHI MUSHROOM MARKET, 2019-2027 ($MILLION)
FIGURE 36.CHINA REISHI MUSHROOM MARKET, 2019-2027 ($MILLION)
FIGURE 37.INDIA REISHI MUSHROOM MARKET, 2019-2027 ($MILLION)
FIGURE 38.JAPAN REISHI MUSHROOM MARKET, 2019-2027 ($MILLION)
FIGURE 39.AUSTRALIA REISHI MUSHROOM MARKET, 2019-2027 ($MILLION)
FIGURE 40.NEW ZEALAND REISHI MUSHROOM MARKET, 2019-2027 ($MILLION)
FIGURE 41.REST OF ASIA-PACIFIC REISHI MUSHROOM MARKET, 2019-2027 ($MILLION)
FIGURE 42.COLOMBIA REISHI MUSHROOM MARKET, 2019-2027 ($MILLION)
FIGURE 43.SAUDI ARABIA REISHI MUSHROOM MARKET, 2019-2027 ($MILLION)
FIGURE 44.SOUTH AFRICA REISHI MUSHROOM MARKET, 2019-2027 ($MILLION)
FIGURE 45.UAEREISHI MUSHROOM MARKET, 2019-2027 ($MILLION)
FIGURE 46.REST OF LAMEA REISHI MUSHROOM MARKET, 2019-2027 ($MILLION)
FIGURE 47.TOP WINNING STRATEGIES, BY YEAR, 2017–2018*
FIGURE 48.TOP WINNING STRATEGIES, BY DEVELOPMENT, 2017–2018* (%)
FIGURE 49.PRODUCT MAPPING OF TOP 10 KEY PLAYERS
FIGURE 50.COMPETITIVE DASHBOARD OF TOP 10 KEY PLAYERS
FIGURE 51.COMPETITIVE HEATMAP OF TOP 10 KEY PLAYER
SELECT A FORMAT
Added to Cart
Electronic (PDF)

$5769

This license allows only one user to access the PDF.
Electronic (PDF)

$10995

This license allows users/teams in a same Enterprise to use this report, various departments within an enterpise can use this report
Add to Cart
Buy Now (15% Discount)

OUR CUSTOMER

Nano String

SIMILAR REPORTS