0
U.S. (TOLL FREE)
+1 (315) 215-3225
Automative

0
U.S. (TOLL FREE)
+1 (315) 215-3225
Travel Retail Market by Product Type (Perfumes & Cosmetics, Wine & Spirit, Electronics, Luxury Goods, Food, Confectionery, Catering, Tobacco) and Sales Channel (Airports, Cruise liners, Railway Stations, Border, Down-Town & Hotel Shop): Global Opportunity Analysis and Industry Forecast, 2021 - 2028
Published Date: November 2019
|
Report Code: ALLI-Auto-2Q300
Home | Market Reports | Shopping| Consumer Resources
Travel Retail Market by Product Perfume Cosmetics Wine Spirit Electronics Luxury Goods Food Confectionery Catering Tobacco and Others and Channel Airport Cruise Liner Railway Station and Border Downtown Hotel Shop Global Opportunity Analysis and Industry Forecast 2018 2025
BUY CHAPTERS

Travel Retail Market by Product Type (Perfumes & Cosmetics, Wine & Spirit, Electronics, Luxury Goods, Food, Confectionery, Catering, Tobacco) and Sales Channel (Airports, Cruise liners, Railway Stations, Border, Down-Town & Hotel Shop): Global Opportunity Analysis and Industry Forecast, 2021 - 2028

Code: ALLI-Auto-2Q300
Report
November 2019
Pages:237
Allied Market Research
Buy Now with 15% Discount
DESCRIPTION
TABLE OF CONTENT
TABLES & FIGURES

Travel Retail Market 

The global travel retail market size is expected to reach USD 145.0 Billion by 2028, registering a CAGR of 14.9% during the forecast period. The rise in travel and tourism has raised consumer demand for apparel, cosmetics, food, and technology in the travel retail sector. Additionally, the expansion of the travel retail market is predicted to be fueled by the acceleration of urbanization and changes in lifestyle throughout the course of the forecast year.
Travel Retail Market
Additionally, the market is expanding as a result of improving economic conditions and rising middle-class disposable income. Technical advancements and other factors also contribute to the expansion of the travel retail business. The sector is also predicted to grow as the number of millennials increases.

Trends Influencing the Growth of the Travel Retail Market 

The increase in domestic and international travelers' desire for goods will lead to growth in the travel retail industry. According to the "Indian Tourism and Hospitality Industry Analysis" study by the Indian Brand Equity Foundation (IBEF), 10.89 million foreign tourists visited India in 2019, a 3.2% rise from the previous year. Retailers now provide customized loyalty programs and discounts to cater to travelers' shifting purchasing tastes. As shops raise their earnings from duty-free items as a result of this provision, the industry is expanding.

The increased number of millennial consumers will spend more on travel and tourism, which will boost product sales. The increased number of millennial consumers will spend more on travel and tourism, which will boost product sales. The travel retail market is anticipated to develop as a result of this aspect. In airports that are arranged as inviting retail spaces, travelers have more time to shop, which increases their propensity to spend while traveling. Travel retailers use data insights including in-depth knowledge of the customer's origin and destination to cater to specific wants. Staff and product displays are organized according to the language and cultural sensitivity of arrival passenger groups to ensure that the pertinent products are prominently presented for targeted customers.

Due to minimal advertising and marketing costs, the industry allows SMEs to promote their products to tourists from around the world. The rise in domestic and foreign traveler foot traffic, particularly when it comes to air travel, has had a considerable impact on the expansion of the travel retail business. The development of retail options and infrastructure is another factor promoting rising market trends. 

The travel retail industry has huge development potential thanks to technological advancements that make it easier to detect and analyze customer patterns. In order to cater to the majority of travelers, brand retailers have the opportunity to deploy a loyalty management system to track and assess their clients. Loyalty management systems assist companies in making money in the travel retail market by monitoring customer behavior and enhancing client tracking.

Travel Retail Market Share

The Asia Pacific region would have the highest CAGR of 17.2% between 2021 and 2028. The Asia-Pacific region is anticipated to lead the global market during the course of the analysis since China, India, Thailand, and other nations have a large number of retail enterprises. The market in Asia-Pacific is also predicted to grow at the highest rate due to an increase in the population of high-net-worth individuals and the expansion of the tourism industry.

By Product Type

  • Perfumes & Cosmetics
  • Wine & Spirit
  • Electronics
  • Luxury Goods
  • Food, Confectionery, & Catering
  • Tobacco 

Travel Retail Market By Product

Luxury goods segment would exhibit the highest CAGR of 19.4% during 2021 - 2028.

Based on product type, the luxury goods segment is anticipated to register the highest growth rate during the forecast period in the travel retail market. The purchase of these goods is totally dependent on the economic stability of any region, as the goods are majorly procured by the upper economic classes. Owing to early adoption of a premium lifestyle. Rise in disposable income, exposure to social media, urbanization and preference toward investments on personal luxury goods are some of the factors that further drive the market growth.

By Channel

  • Airport
  • Cruise Liner
  • Railway Station
  • Border, Downtown, & Hotel Shop

Travel Retail Market By Product Type

 Airport segment would exhibit the highest CAGR of 16.4% during 2021-2028.

Railway stations have also witnessed considerable growth over the years. For instance, London's King's Cross Station established an airy-bar restaurant with wooden floors and vintage leather sofas, with an aim to provide comfort to travelers. The station also has various branded stores with different product categories such as clothing and accessories for both men and women, sportswear, music stores with products including audio equipment, CD & vinyl, accessories and others. These factors boost the growth of the travel retail market at railway stations.

By Region

  • North America
  • Asia-Pacific
  • Europe
  • LAMEA

Key Companies

  • DFS Group
  • Dufry,
  • LS travel retail
  • Lotte Duty Free
  • King Power International Group
  • The Shilla Duty Free
  • Gebr
  • Heinemann
  • China Duty Free Group
  • AerRianta International
  • The Naunace Group 

Scope of Travel Retail Market Report

Report Metric

Details

Report Name

Travel Retail Market

Market size value in 2028

145.0 Billion

Growth Rate

CAGR 14.9%

By Product Type

Perfumes & Cosmetics, Wine & Spirit, Electronics, Luxury Goods, Food, Confectionery,  Catering, Tobacco 

By Sales Channel

Airports, Cruise liners, Railway Stations, Border, Down-Town & Hotel Shop

Report Coverage

Revenue & volume forecast, company share, competitive landscape, growth factors, and trends

Segments Covered

By Type, Application, and Region

Geographic Regions Covered

North America, Europe, Asia Pacific, Latin America, Middle East & Africa

Frequently Asked Questions About This Report 

1. Do you provide chapter wise report data? 

Ans. Yes, we do provide the option to buy chapters in a report. We also can customize the report based on your specific requirements.

2. How big is the Travel Retail Market?

Ans. The global travel retail market size is expected to reach USD 145.0 Billion by 2028, registering a CAGR of 14.9% during the forecast period.

3. Does the report provides covid-19 impact analysis?

Ans. Yes, the report includes a COVID-19 impact analysis. Also, it is further extended into every individual segment of the report.

CHAPTER 1 INTRODUCTION
1.1. REPORT DESCRIPTION
1.2. KEY BENEFITS FOR STAKEHOLDERS
1.3. KEY MARKET SEGMENTS
1.4. RESEARCH METHODOLOGY
1.4.1. Secondary research
1.4.2. Primary research
1.4.3. Analyst tools and models
CHAPTER 2 EXECUTIVE SUMMARY
2.1. CXO PERSPECTIVE
CHAPTER 3 MARKET OVERVIEW
3.1. MARKET DEFINITION AND SCOPE
3.2. KEY FINDINGS
3.2.1. Top impacting factors
3.2.2. Top winning strategies
3.2.3. Top investment pockets
3.3. PORTERS FIVE FORCES ANALYSIS
3.3.1. Low bargaining powers of suppliers
3.3.2. High bargaining powers of buyers
3.3.3. Low threat of substitution
3.3.4. Low threat of new entrant
3.3.5. High competitive rivalry
3.4. MARKET SHARE ANALYSIS, 2017 (%)
3.5. MARKET DYNAMICS
3.5.1. Drivers
3.5.1.1. Development of the travel & tourism industry
3.5.1.2. Rapid growth in urbanization
3.5.1.3. Rise in disposable income
3.5.2. Restraints
3.5.2.1. Unorganized local markets
3.5.2.2. Stringent government rules, particularly for airport retailing
3.5.3. Opportunities
3.5.3.1. Growth in Asia-Pacific and LAMEA economies
CHAPTER 4 TRAVEL RETAIL MARKET, BY PRODUCT
4.1. OVERVIEW
4.1.1. Market size and forecast
4.2. PERFUMES & COSMETICS
4.2.1. Key market trends, growth factors and opportunities
4.2.2. Market size and forecast, by region
4.2.3. Market size and forecast, by country
4.3. FOOD, CONFECTIONERY & CATERING
4.3.1. Key market trends, growth factors and opportunities
4.3.2. Market size and forecast, by region
4.3.3. Market size and forecast, by country
4.4. ELECTRONICS
4.4.1. Key market trends, growth factors and opportunities
4.4.2. Market size and forecast, by region
4.4.3. Market size and forecast, by country
4.5. WINE & SPIRITS
4.5.1. Key market trends, growth factors and opportunities
4.5.2. Market size and forecast, by region
4.5.3. Market size and forecast, by country
4.6. LUXURY GOODS
4.6.1. Key market trends, growth factors and opportunities
4.6.2. Market size and forecast, by region
4.6.3. Market size and forecast, by country
4.7. TOBACCO
4.7.1. Key market trends, growth factors and opportunities
4.7.2. Market size and forecast, by region
4.7.3. Market size and forecast, by country
4.8. OTHERS
4.8.1. Key market trends, growth factors and opportunities
4.8.2. Market size and forecast, by region
4.8.3. Market size and forecast, by country
CHAPTER 5 TRAVEL RETAIL MARKET, BY CHANNEL
5.1. OVERVIEW
5.1.1. Market size and forecast
5.2. AIRPORTS
5.2.1. Key market trends, growth factors and opportunities
5.2.2. Market size and forecast, by region
5.2.3. Market size and forecast, by country
5.3. CRUISE LINERS
5.3.1. Key market trends, growth factors and opportunities
5.3.2. Market size and forecast, by region
5.3.3. Market size and forecast, by country
5.4. RAILWAY STATIONS
5.4.1. Key market trends, growth factors and opportunities
5.4.2. Market size and forecast, by region
5.4.3. Market size and forecast, by country
5.5. BORDER, DOWNTOWN, & HOTEL SHOPS
5.5.1. Key market trends, growth factors and opportunities
5.5.2. Market size and forecast, by region
5.5.3. Market size and forecast, by country
CHAPTER 6 TRAVEL RETAIL MARKET, BY GEOGRAPHY
6.1. OVERVIEW
6.1.1. Market size and forecast
6.2. NORTH AMERICA
6.2.1. Key market trends, growth factors and opportunities
6.2.2. Market size and forecast
6.2.2.1. U.S.
6.2.2.2. Canada
6.2.2.3. Mexico
6.3. EUROPE
6.3.1. Key market trends, growth factors and opportunities
6.3.2. Market size and forecast
6.3.2.1. UK
6.3.2.2. Germany
6.3.2.3. Italy
6.3.2.4. France
6.3.2.5. Rest of Europe
6.4. ASIA-PACIFIC
6.4.1. Key market trends, growth factors and opportunities
6.4.2. Market size and forecast
6.4.2.1. China
6.4.2.2. India
6.4.2.3. Japan
6.4.2.4. Rest of Asia-Pacific
6.5. LAMEA
6.5.1. Key market trends, growth factors and opportunities
6.5.2. Market size and forecast
6.5.2.1. Latin America
6.5.2.2. Middle East
6.5.2.3. Africa
CHAPTER 7 COMPANY PROFILES
7.1. DFS GROUP
7.1.1. Company overview
7.1.2. Company snapshot
7.1.3. Operating business segments
7.1.4. Product portfolio
7.1.5. Business performance
7.1.6. Key strategic moves & developments, 2015-2017
7.2. DUFRY
7.2.1. Company overview
7.2.2. Company snapshot
7.2.3. Operating business segments
7.2.4. Product portfolio
7.2.5. Business performance
7.2.6. Key strategic moves & developments, 2015-2017
7.3. LS TRAVEL RETAIL
7.3.1. Company overview
7.3.2. Company snapshot
7.3.3. Operating business segments
7.3.4. Product portfolio
7.3.5. Business performance
7.3.6. Key strategic moves & developments, 2015-2017
7.4. LOTTE DUTY FREE
7.4.1. Company overview
7.4.2. Company snapshot
7.4.3. Operating business segments
7.4.4. Product portfolio
7.4.5. Business performance
7.4.6. Key strategic moves & developments, 2015-2017
7.5. KING POWER INTERNATIONAL GROUP
7.5.1. Company overview
7.5.2. Company snapshot
7.5.3. Operating business segments
7.5.4. Product portfolio
7.5.5. Business performance
7.5.6. Key strategic moves & developments, 2015-2017
7.6. THE SHILLA DUTY FREE
7.6.1. Company overview
7.6.2. Company snapshot
7.6.3. Operating business segments
7.6.4. Product portfolio
7.6.5. Business performance
7.6.6. Key strategic moves & developments, 2015-2017
7.7. GEBR. HEINEMANN
7.7.1. Company overview
7.7.2. Company snapshot
7.7.3. Operating business segments
7.7.4. Product portfolio
7.7.5. Business performance
7.7.6. Key strategic moves & developments, 2015-2017
7.8. CHINA DUTY FREE GROUP (CDFG)
7.8.1. Company overview
7.8.2. Company snapshot
7.8.3. Operating business segments
7.8.4. Product portfolio
7.8.5. Business performance
7.8.6. Key strategic moves & developments, 2015-2017
7.9. AER RIANTA INTERNATIONAL (ARI)
7.9.1. Company overview
7.9.2. Company snapshot
7.9.3. Operating business segments
7.9.4. Product portfolio
7.9.5. Business performance
7.9.6. Key strategic moves & developments, 2015-2017
7.10. THE NAUNACE GROUP
7.10.1. Company overview
7.10.2. Company snapshot
7.10.3. Operating business segments
7.10.4. Product portfolio
7.10.5. Business performance
7.10.6. Key strategic moves & developments, 2015-201
LIST OF TABLES

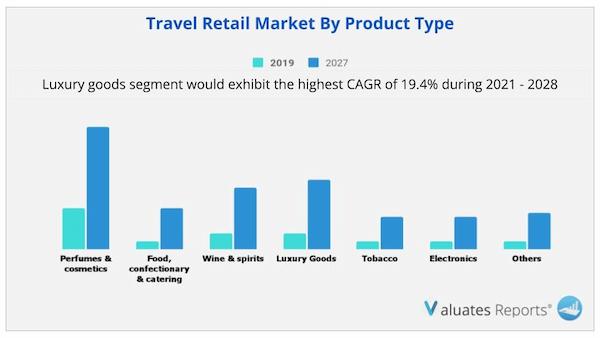
TABLE 1. TRAVEL RETAIL MARKET, BY PRODUCT, 2017-2025 ($BILLION)
TABLE 2. TRAVEL RETAIL MARKET REVENUE FROM PERFUMES & COSMETICS, BY REGION, 2017-2025 ($BILLION)
TABLE 3. NORTH AMERICA PERFUMES AND COSMETICS TRAVEL RETAIL MARKET BY COUNTRY, 2017-2025 ($BILLION)
TABLE 4. EUROPE PERFUMES AND COSMETICS TRAVEL RETAIL MARKET BY COUNTRY, 2017-2025 ($BILLION)
TABLE 5. ASIA-PACIFIC PERFUMES AND COSMETICS TRAVEL RETAIL MARKET BY COUNTRY, 2017-2025 ($BILLION)
TABLE 6. LAMEA PERFUMES AND COSMETICS TRAVEL RETAIL MARKET BY COUNTRY, 2017-2025 ($BILLION)
TABLE 7. TRAVEL RETAIL MARKET REVENUE FROM FOOD, CONFECTIONERY & CATERING, BY REGION, 2017-2025 ($BILLION)
TABLE 8. NORTH AMERICA FOOD, CONFECTIONERY & CATERING TRAVEL RETAIL MARKET BY COUNTRY, 2017-2025 ($BILLION)
TABLE 9. EUROPE FOOD, CONFECTIONERY & CATERING TRAVEL RETAIL MARKET BY COUNTRY, 2017-2025 ($BILLION)
TABLE 10. ASIA-PACIFIC FOOD, CONFECTIONERY & CATERING TRAVEL RETAIL MARKET BY COUNTRY, 2017-2025 ($BILLION)
TABLE 11. LAMEA FOOD, CONFECTIONERY & CATERING TRAVEL RETAIL MARKET BY COUNTRY, 2017-2025 ($BILLION)
TABLE 12. TRAVEL RETAIL MARKET REVENUE FROM ELECTRONICS TRAVEL RETAIL, BY REGION, 2017-2025 ($BILLION)
TABLE 13. NORTH AMERICA ELECTRONICS TRAVEL RETAIL MARKET BY COUNTRY, 2017-2025 ($BILLION)
TABLE 14. EUROPE ELECTRONICS TRAVEL RETAIL MARKET BY COUNTRY, 2017-2025 ($BILLION)
TABLE 15. ASIA-PACIFIC ELECTRONICS TRAVEL RETAIL MARKET BY COUNTRY, 2017-2025 ($BILLION)
TABLE 16. LAMEA ELECTRONICS TRAVEL RETAIL MARKET BY COUNTRY, 2017-2025 ($BILLION)
TABLE 17. TRAVEL RETAIL MARKET REVENUE FROM WINES & SPIRITS TRAVEL RETAIL, BY REGION, 2017-2025 ($BILLION)
TABLE 18. NORTH AMERICA WINES & SPIRITS MARKET BY COUNTRY, 2017-2025 ($BILLION)
TABLE 19. EUROPE WINES & SPIRITS TRAVEL RETAIL MARKET BY COUNTRY, 2017-2025 ($BILLION)
TABLE 20. ASIA-PACIFIC WINES & SPIRITS TRAVEL RETAIL MARKET BY COUNTRY, 2017-2025 ($BILLION)
TABLE 21. LAMEA WINES & SPIRITS TRAVEL RETAIL MARKET BY COUNTRY, 2017-2025 ($BILLION)
TABLE 22. TRAVEL RETAIL MARKET REVENUE FROM LUXURY GOODS, BY REGION, 2017-2025 ($BILLION)
TABLE 23. NORTH AMERICA LUXURY GOODS TRAVEL RETAIL MARKET BY COUNTRY, 2017-2025 ($BILLION)
TABLE 24. EUROPE LUXURY GOODS TRAVEL RETAIL MARKET BY COUNTRY, 2017-2025 ($BILLION)
TABLE 25. ASIA-PACIFIC LUXURY GOODS TRAVEL RETAIL MARKET BY COUNTRY, 2017-2025 ($BILLION)
TABLE 26. LAMEA LUXURY GOODS TRAVEL RETAIL MARKET BY COUNTRY, 2017-2025 ($BILLION)
TABLE 27. TRAVEL RETAIL MARKET REVENUE FROM TOBACCO, BY REGION, 2017-2025 ($BILLION)
TABLE 28. NORTH AMERICA TOBACCO TRAVEL RETAIL MARKET BY COUNTRY, 2017-2025 ($BILLION)
TABLE 29. EUROPE TOBACCO TRAVEL RETAIL MARKET BY COUNTRY, 2017-2025 ($BILLION)
TABLE 30. ASIA-PACIFIC TOBACCO TRAVEL RETAIL MARKET BY COUNTRY, 2017-2025 ($BILLION)
TABLE 31. LAMEA TOBACCO TRAVEL RETAIL MARKET BY COUNTRY, 2017-2025 ($BILLION)
TABLE 32. TRAVEL RETAIL MARKET REVENUE FROM WINES & SPIRITS, BY REGION, 2017-2025 ($BILLION)
TABLE 33. NORTH AMERICA OTHERS TRAVEL RETAIL MARKET BY COUNTRY, 2017-2025 ($BILLION)
TABLE 34. EUROPE OTHERS TRAVEL RETAIL MARKET BY COUNTRY, 2017-2025 ($BILLION)
TABLE 35. ASIA-PACIFIC OTHERS TRAVEL RETAIL MARKET BY COUNTRY, 2017-2025 ($BILLION)
TABLE 36. LAMEA OTHERS TRAVEL RETAIL MARKET BY COUNTRY, 2017-2025 ($BILLION)
TABLE 37. TRAVEL RETAIL MARKET, BY CHANNEL, 2017-2025 ($BILLION)
TABLE 38. AIRPORT TRAVEL RETAIL MARKET REVENUE, BY REGION, 2017-2025 ($BILLION)
TABLE 39. NORTH AMERICA AIRPORTS TRAVEL RETAIL MARKET BY COUNTRY, 2017-2025 ($BILLION)
TABLE 40. EUROPE AIRPORTS TRAVEL RETAIL MARKET BY COUNTRY, 2017-2025 ($BILLION)
TABLE 41. ASIA-PACIFIC AIRPORTS TRAVEL RETAIL MARKET BY COUNTRY, 2017-2025 ($BILLION)
TABLE 42. LAMEA AIRPORTS TRAVEL RETAIL MARKET BY COUNTRY, 2017-2025 ($BILLION)
TABLE 43. CRUISE LINERS TRAVEL RETAIL MARKET REVENUE, BY REGION, 2017-2025 ($BILLION)
TABLE 44. NORTH AMERICA CRUISE LINERS TRAVEL RETAIL MARKET BY COUNTRY, 2017-2025 ($BILLION)
TABLE 45. EUROPE CRUISE LINERS TRAVEL RETAIL MARKET BY COUNTRY, 2017-2025 ($BILLION)
TABLE 46. ASIA-PACIFIC CRUISE LINERS TRAVEL RETAIL MARKET BY COUNTRY, 2017-2025 ($BILLION)
TABLE 47. LAMEA CRUISE LINERS TRAVEL RETAIL MARKET BY COUNTRY, 2017-2025 ($BILLION)
TABLE 48. RAILWAY STATIONS TRAVEL RETAIL MARKET REVENUE, BY REGION, 2017-2025 ($BILLION)
TABLE 49. NORTH AMERICA RAILWAY STATIONS TRAVEL RETAIL MARKET BY COUNTRY, 2017-2025 ($BILLION)
TABLE 50. EUROPE RAILWAY STATIONS TRAVEL RETAIL MARKET BY COUNTRY, 2017-2025 ($BILLION)
TABLE 51. ASIA-PACIFIC RAILWAY STATIONS TRAVEL RETAIL MARKET BY COUNTRY, 2017-2025 ($BILLION)
TABLE 52. LAMEA RAILWAY STATIONS TRAVEL RETAIL MARKET BY COUNTRY, 2017-2025 ($BILLION)
TABLE 53. BORDER, DOWNTOWN, & HOTEL SHOPS TRAVEL RETAIL MARKET REVENUE, BY REGION, 2017-2025 ($BILLION)
TABLE 54. NORTH AMERICA BORDER, DOWNTOWN, & HOTEL SHOPS TRAVEL RETAIL MARKET BY COUNTRY, 2017-2025 ($BILLION)
TABLE 55. EUROPE BORDER, DOWNTOWN, & HOTEL SHOPS TRAVEL RETAIL MARKET BY COUNTRY, 2017-2025 ($BILLION)
TABLE 56. ASIA-PACIFIC BORDER, DOWNTOWN, & HOTEL SHOPS TRAVEL RETAIL MARKET BY COUNTRY, 2017-2025 ($BILLION)
TABLE 57. LAMEA BORDER, DOWNTOWN, & HOTEL SHOPS TRAVEL RETAIL MARKET BY COUNTRY, 2017-2025 ($BILLION)
TABLE 58. GLOBAL TRAVEL RETAIL MARKET, BY REGION, 2017-2025 ($BILLION)
TABLE 59. NORTH AMERICAN TRAVEL RETAIL MARKET REVENUE, BY PRODUCT, 2017-2025 ($BILLION)
TABLE 60. NORTH AMERICAN TRAVEL RETAIL MARKET REVENUE, BY CHANNEL, 2017-2025 ($BILLION)
TABLE 61. NORTH AMERICAN TRAVEL RETAIL MARKET REVENUE, BY COUNTRY, 2017-2025 ($BILLION)
TABLE 62. U.S. TRAVEL RETAIL MARKET, BY PRODUCT, 20162023 ($BILLION)
TABLE 63. U.S. TRAVEL RETAIL MARKET, BY CHANNEL, 20162023 ($BILLION)
TABLE 64. CANADA TRAVEL RETAIL MARKET, BY PRODUCT, 20162023 ($BILLION)
TABLE 65. CANADA TRAVEL RETAIL MARKET, BY CHANNEL, 20162023 ($BILLION)
TABLE 66. MEXICO TRAVEL RETAIL MARKET, BY PRODUCT, 20162023 ($BILLION)
TABLE 67. MEXICO TRAVEL RETAIL MARKET, BY CHANNEL, 20162023 ($BILLION)
TABLE 68. EUROPEAN TRAVEL RETAIL MARKET REVENUE, BY PRODUCT, 2017-2025 ($BILLION)
TABLE 69. EUROPEAN TRAVEL RETAIL MARKET REVENUE, BY CHANNEL, 2017-2025 ($BILLION)
TABLE 70. EUROPEAN TRAVEL RETAIL MARKET REVENUE, BY COUNTRY, 2017-2025 ($BILLION)
TABLE 71. UK TRAVEL RETAIL MARKET, BY PRODUCT, 20162023 ($BILLION)
TABLE 72. UK TRAVEL RETAIL MARKET, BY CHANNEL, 20162023 ($BILLION)
TABLE 73. GERMANY TRAVEL RETAIL MARKET, BY PRODUCT, 20162023 ($BILLION)
TABLE 74. GERMANY TRAVEL RETAIL MARKET, BY CHANNEL, 20162023 ($BILLION)
TABLE 75. ITALY TRAVEL RETAIL MARKET, BY PRODUCT, 20162023 ($BILLION)
TABLE 76. ITALY TRAVEL RETAIL MARKET, BY CHANNEL, 20162023 ($BILLION)
TABLE 77. FRANCE TRAVEL RETAIL MARKET, BY PRODUCT, 20162023 ($BILLION)
TABLE 78. FRANCE TRAVEL RETAIL MARKET, BY CHANNEL, 20162023 ($BILLION)
TABLE 79. REST OF EUROPE TRAVEL RETAIL MARKET, BY PRODUCT, 20162023 ($BILLION)
TABLE 80. REST OF EUROPE TRAVEL RETAIL MARKET, BY CHANNEL, 20162023 ($BILLION)
TABLE 81. ASIA-PACIFIC TRAVEL RETAIL MARKET REVENUE, BY PRODUCT, 2017-2025 ($BILLION)
TABLE 82. ASIA-PACIFIC TRAVEL RETAIL MARKET REVENUE, BY CHANNEL, 2017-2025 ($BILLION)
TABLE 83. ASIA-PACIFIC TRAVEL RETAIL MARKET REVENUE, BY COUNTRY, 2017-2025 ($BILLION)
TABLE 84. CHINA TRAVEL RETAIL MARKET, BY PRODUCT, 20162023 ($BILLION)
TABLE 85. CHINA TRAVEL RETAIL MARKET, BY CHANNEL, 20162023 ($BILLION)
TABLE 86. INDIA TRAVEL RETAIL MARKET, BY PRODUCT, 20162023 ($BILLION)
TABLE 87. INDIA TRAVEL RETAIL MARKET, BY CHANNEL, 20162023 ($BILLION)
TABLE 88. JAPAN TRAVEL RETAIL MARKET, BY PRODUCT, 20162023 ($BILLION)
TABLE 89. JAPAN TRAVEL RETAIL MARKET, BY CHANNEL, 20162023 ($BILLION)
TABLE 90. REST OF ASIA-PACIFIC TRAVEL RETAIL MARKET, BY PRODUCT, 20162023 ($BILLION)
TABLE 91. REST OF ASIA-PACIFIC TRAVEL RETAIL MARKET, BY CHANNEL, 20162023 ($BILLION)
TABLE 92. LAMEA TRAVEL RETAIL MARKET REVENUE, BY PRODUCT, 2017-2025 ($BILLION)
TABLE 93. LAMEA TRAVEL RETAIL MARKET REVENUE, BY CHANNEL, 2017-2025 ($BILLION)
TABLE 94. LAMEA TRAVEL RETAIL MARKET REVENUE, BY REGION, 2017-2025 ($BILLION)
TABLE 95. LATIN AMERICA TRAVEL RETAIL MARKET, BY PRODUCT, 20162023 ($BILLION)
TABLE 96. LATIN AMERICA TRAVEL RETAIL MARKET, BY CHANNEL, 20162023 ($BILLION)
TABLE 97. MIDDLE EAST TRAVEL RETAIL MARKET, BY PRODUCT, 20162023 ($BILLION)
TABLE 98. MIDDLE EAST TRAVEL RETAIL MARKET, BY CHANNEL, 20162023 ($BILLION)
TABLE 99. AFRICA TRAVEL RETAIL MARKET, BY PRODUCT, 20162023 ($BILLION)
TABLE 100. AFRICA TRAVEL RETAIL MARKET, BY CHANNEL, 20162023 ($BILLION)
TABLE 101. DFS GROUP: COMPANY SNAPSHOT
TABLE 102. DFS GROUP: OPERATING SEGMENTS
TABLE 103. DFS GROUP: PRODUCT PORTFOLIO
TABLE 104. DUFRY: COMPANY SNAPSHOT
TABLE 105. DUFRY: OPERATING SEGMENTS
TABLE 106. DUFRY: PRODUCT PORTFOLIO
TABLE 107. LS TRAVEL RETAIL: COMPANY SNAPSHOT
TABLE 108. LS TRAVEL RETAIL: OPERATING SEGMENTS
TABLE 109. LS TRAVEL RETAIL: PRODUCT PORTFOLIO
TABLE 110. LOTTE DUTY FREE: COMPANY SNAPSHOT
TABLE 111. LOTTE DUTY FREE: OPERATING SEGMENTS
TABLE 112. LOTTE DUTY FREE: PRODUCT PORTFOLIO
TABLE 113. KING POWER INTERNATIONAL GROUP: COMPANY SNAPSHOT
TABLE 114. KING POWER INTERNATIONAL GROUP: OPERATING SEGMENTS
TABLE 115. KING POWER INTERNATIONAL GROUP: PRODUCT PORTFOLIO
TABLE 116. THE SHILLA DUTY FREE: COMPANY SNAPSHOT
TABLE 117. THE SHILLA DUTY FREE: OPERATING SEGMENTS
TABLE 118. THE SHILLA DUTY FREE: PRODUCT PORTFOLIO
TABLE 119. GEBR. HEINEMANN: COMPANY SNAPSHOT
TABLE 120. GEBR. HEINEMANN: OPERATING SEGMENTS
TABLE 121. GEBR. HEINEMANN: PRODUCT PORTFOLIO
TABLE 122. CHINA DUTY FREE GROUP (CDFG): COMPANY SNAPSHOT
TABLE 123. CHINA DUTY FREE GROUP (CDFG): OPERATING SEGMENTS
TABLE 124. CHINA DUTY FREE GROUP (CDFG): PRODUCT PORTFOLIO
TABLE 125. AER RIANTA INTERNATIONAL (ARI): COMPANY SNAPSHOT
TABLE 126. AER RIANTA INTERNATIONAL (ARI): OPERATING SEGMENTS
TABLE 127. AER RIANTA INTERNATIONAL (ARI): PRODUCT PORTFOLIO
TABLE 128. THE NAUNACE GROUP: COMPANY SNAPSHOT
TABLE 129. THE NAUNACE GROUP: OPERATING SEGMENTS
TABLE 130. THE NAUNACE GROUP: PRODUCT PORTFOLIO LIST OF FIGURES

FIGURE 1. TRAVEL RETAIL MARKET SEGMENTATION
FIGURE 2. GLOBAL TRAVEL RETAIL MARKET: EXECUTIVE SUMMARY
FIGURE 3. TOP IMPACTING FACORS OF TRAVEL RETAIL MARKET
FIGURE 4. TOP INVESTMENT POCKETS
FIGURE 5. LOW BARGAINING POWER OF SUPPLIERS
FIGURE 6. HIGH BARGAINING POWER OF BUYERS
FIGURE 7. LOW THREAT OF SUBSTITUTION
FIGURE 8. LOW THREAT OF NEW ENTRANT
FIGURE 9. HIGH COMPETITIVE RIVALRY
FIGURE 10. MARKET DYNAMICS
FIGURE 11. INTERNATIONAL TOURIST ARRIVALS, 1995-2030 (BILLION)
FIGURE 12. DEGREE OF URBANIZATION, BY REGION, 2017 (%)
FIGURE 13. GLOBAL TRAVEL RETAIL MARKET, BY REGION, 2017 (%)
FIGURE 14. U.S. TRAVEL RETAIL MARKET REVENUE, 2017-2025 ($BILLION)
FIGURE 15. CANADA TRAVEL RETAIL MARKET REVENUE, 2017-2025 ($BILLION)
FIGURE 16. MEXICO TRAVEL RETAIL MARKET REVENUE, 2017-2025 ($BILLION)
FIGURE 17. UK TRAVEL RETAIL MARKET REVENUE, 2017-2025 ($BILLION)
FIGURE 18. GERMANY TRAVEL RETAIL MARKET REVENUE, 2017-2025 ($BILLION)
FIGURE 19. ITALY TRAVEL RETAIL MARKET REVENUE, 2017-2025 ($BILLION)
FIGURE 20. FRANCE TRAVEL RETAIL MARKET REVENUE, 2017-2025 ($BILLION)
FIGURE 21. REST OF EUROPE TRAVEL RETAIL MARKET REVENUE, 2017-2025 ($BILLION)
FIGURE 22. CHINA TRAVEL RETAIL MARKET REVENUE, 2017-2025 ($BILLION)
FIGURE 23. INDIA TRAVEL RETAIL MARKET REVENUE, 2017-2025 ($BILLION)
FIGURE 24. JAPAN TRAVEL RETAIL MARKET REVENUE, 2017-2025 ($BILLION)
FIGURE 25. REST OF ASIA-PACIFIC TRAVEL RETAIL MARKET REVENUE, 2017-2025 ($BILLION)
FIGURE 26. LATIN AMERICA TRAVEL RETAIL MARKET REVENUE, 2017-2025 ($BILLION)
FIGURE 27. MIDDLE EAST TRAVEL RETAIL MARKET REVENUE, 2017-2025 ($BILLION)
FIGURE 28. AFRICA TRAVEL RETAIL MARKET REVENUE, 2017-2025 ($BILLION)
FIGURE 29. DFS GROUP: REVENUE, 20152017 ($MILLION)
FIGURE 30. DFS GROUP: REVENUE SHARE BY SEGMENT, 2017 (%)
FIGURE 31. DFS GROUP: REVENUE SHARE BY GEOGRAPHY, 2017 (%)
FIGURE 32. DUFRY: REVENUE, 20152017 ($MILLION)
FIGURE 33. DUFRY: REVENUE SHARE BY SEGMENT, 2017 (%)
FIGURE 34. DUFRY: REVENUE SHARE BY GEOGRAPHY, 2017 (%)
FIGURE 35. LS TRAVEL RETAIL: REVENUE, 20152017 ($MILLION)
FIGURE 36. LS TRAVEL RETAIL: REVENUE SHARE BY SEGMENT, 2017 (%)
FIGURE 37. LS TRAVEL RETAIL: REVENUE SHARE BY GEOGRAPHY, 2017 (%)
FIGURE 38. LOTTE DUTY FREE: REVENUE, 20152017 ($MILLION)
FIGURE 39. LOTTE DUTY FREE: REVENUE SHARE BY SEGMENT, 2017 (%)
FIGURE 40. LOTTE DUTY FREE: REVENUE SHARE BY GEOGRAPHY, 2017 (%)
FIGURE 41. KING POWER INTERNATIONAL GROUP: REVENUE, 20152017 ($MILLION)
FIGURE 42. KING POWER INTERNATIONAL GROUP: REVENUE SHARE BY SEGMENT, 2017 (%)
FIGURE 43. KING POWER INTERNATIONAL GROUP: REVENUE SHARE BY GEOGRAPHY, 2017 (%)
FIGURE 44. THE SHILLA DUTY FREE: REVENUE, 20152017 ($MILLION)
FIGURE 45. THE SHILLA DUTY FREE: REVENUE SHARE BY SEGMENT, 2017 (%)
FIGURE 46. THE SHILLA DUTY FREE: REVENUE SHARE BY GEOGRAPHY, 2017 (%)
FIGURE 47. GEBR. HEINEMANN: REVENUE, 20152017 ($MILLION)
FIGURE 48. GEBR. HEINEMANN: REVENUE SHARE BY SEGMENT, 2017 (%)
FIGURE 49. GEBR. HEINEMANN: REVENUE SHARE BY GEOGRAPHY, 2017 (%)
FIGURE 50. CHINA DUTY FREE GROUP (CDFG): REVENUE, 20152017 ($MILLION)
FIGURE 51. CHINA DUTY FREE GROUP (CDFG): REVENUE SHARE BY SEGMENT, 2017 (%)
FIGURE 52. CHINA DUTY FREE GROUP (CDFG): REVENUE SHARE BY GEOGRAPHY, 2017 (%)
FIGURE 53. AER RIANTA INTERNATIONAL (ARI): REVENUE, 20152017 ($MILLION)
FIGURE 54. AER RIANTA INTERNATIONAL (ARI): REVENUE SHARE BY SEGMENT, 2017 (%)
FIGURE 55. AER RIANTA INTERNATIONAL (ARI): REVENUE SHARE BY GEOGRAPHY, 2017 (%)
FIGURE 56. THE NAUNACE GROUP: REVENUE, 20152017 ($MILLION)
FIGURE 57. THE NAUNACE GROUP: REVENUE SHARE BY SEGMENT, 2017 (%)
FIGURE 58. THE NAUNACE GROUP: REVENUE SHARE BY GEOGRAPHY, 2017 (%
SELECT A FORMAT
Added to Cart
Electronic (PDF)

$5769

This license allows only one user to access the PDF.
Electronic (PDF)

$10663

This license allows users/teams in a same Enterprise to use this report, various departments within an enterpise can use this report
Add to Cart
Buy Now (15% Discount)

OUR CUSTOMER

SecuX Technology Inc

SIMILAR REPORTS


RELATED REPORTS

Global Desk Calendar Market Research Report 2024

120 Pages
Type: Report
Code: QYRE-Auto-34V7562
Sat May 11 00:00:00 UTC 2024

Add to Cart

Global Pre-engineered Metal Buildings Market Research Report 2024

120 Pages
Type: Report
Code: QYRE-Auto-5D4428
Sat May 11 00:00:00 UTC 2024

Add to Cart

Global Chef Uniform Market Research Report 2024

120 Pages
Type: Report
Code: QYRE-Auto-16W7829
Sat May 11 00:00:00 UTC 2024

Add to Cart

Global Calendar Market Research Report 2024

120 Pages
Type: Report
Code: QYRE-Auto-3L8045
Sat May 11 00:00:00 UTC 2024

Add to Cart