0
U.S. (TOLL FREE)
+1 (315) 215-3225
Automative

0
U.S. (TOLL FREE)
+1 (315) 215-3225
Unmanned Aerial Vehicles (UAVs) Simulation Market By Component (Hardware, Software), By Drone Type (Fixed wing, Rotary wing), By End Use (Military, Civil and Commercial): Global Opportunity Analysis and Industry Forecast, 2021-2031
Published Date: October 2022
|
Report Code: ALLI-Auto-2Q902
Home | Market Reports | Business & Industrial| Aerospace & Defense
Unmanned Aerial Vehicles UAVs Simulation Market By Component Hardware Software By Drone Type Fixed wing Rotary wing By End Use Military Civil and Commercial Global Opportunity Analysis and Industry Forecast 2021 2031
BUY CHAPTERS

Unmanned Aerial Vehicles (UAVs) Simulation Market By Component (Hardware, Software), By Drone Type (Fixed wing, Rotary wing), By End Use (Military, Civil and Commercial): Global Opportunity Analysis and Industry Forecast, 2021-2031

Code: ALLI-Auto-2Q902
Report
October 2022
Pages:246
Allied Market Research
Buy Now with 15% Discount
DESCRIPTION
TABLE OF CONTENT
TABLES & FIGURES

Unmanned Aerial Vehicles (UAVs) Simulation Market Size

According to a new report published by , titled, “Unmanned Aerial Vehicles (UAVs) Simulation Market," The unmanned aerial vehicles (UAVs) simulation market was valued at $0.6 billion in 2021, and is estimated to reach $2.5 billion by 2031, growing at a CAGR of 14.6% from 2022 to 2031.

Unmanned Aerial Vehicles (UAVs) Simulation Market

Unmanned Aerial Vehicles (UAVs) Simulation Market

North America is expected to dominate the global unmanned aerial vehicles simulation market. The region has seen a significant surge in the use of advanced UAVs simulation technologies to reduce human labor and improve output quality in military and agriculture sector. The North American countries are investing heavily toward the advancement of UAVs simulation to augment the performance of their operations and improve the time management in security and supply chain. The increase in investment by the North American countries propel the development of advanced drone equipment and software across the North American region.
Helicopter drones can carry a wide variety of payloads, including daytime and IR cameras, environmental sensors, LiDAR scanning systems and radio relay equipment, as well as missiles and other offensive capabilities. In addition, companies are introducing virtual reality based simulation systems to reduce the training period of pilot, supplementing the growth of the UAV simulation market. For instance, in 2021, Indra developed a virtual reality-based simulation system, namely, SIMCUI. It is a new multi-purpose and inter-operable simulation system which can halve the time required to train a civil or military pilot of any type of plane or unmanned aerial vehicles.
The global unmanned aerial vehicles (UAVs) simulation market is experiencing growth, due to rising adoption of UAVs in military and commercial applications, and less number of skilled and trained pilots. However, high cost of UAV simulation systems hampers the growth of the market. Furthermore, rise in defense expenditure globally, and contracts & agreements with military forces are expected to offer growth opportunities during the forecast period.
COVID-19 Impact Analysis
The spread of the COVID-19 pandemic has impacted the global unmanned aerial vehicle (UAV) simulation market, owing to disruption in the supply chain, tighten budgets of the end users and is expected to weaken the financial performance of the market players in 2020. In addition, governments of several countries such as the U.S. and Canada have maintained their defense spending levels. For instance, the U.S. defense spending reached $778 billion in 2020, with a yearly increase on 4.4%. This led numerous UAV manufacturers, weapon and combat system manufacturers to expedite the procurement rate of simulation systems.
Various countries with the foundations of a drone-friendly environment, such as the U.S., the UK, China, Germany, and others, were able to quickly mobilize the technology from the start of the pandemic. These countries were able to incorporate unmanned aerial vehicle (UAV) into the COVID-19 response activities, due to enabling factors such as favourable regulations, skilled workforce, presence of vital resources, high adoption, and others.
KEY FINDINGS OF THE STUDY
By component, the software segment is anticipated to exhibit significant growth in the near future.
By drone type, the rotary wing segment is anticipated to exhibit significant growth in the near future.
By end-use, the civil and commercial segment is anticipated to exhibit significant growth in the near future.
By region, Asia-Pacific is anticipated to register the highest CAGR during the forecast period.
Key players operating in the global unmanned aerial vehicle (UAV) simulation market include Bluehalo, CAE Inc., General Atomic Aeronautical System Inc., Havelsan A.S., Indra Sistemas, Israel Aerospace Industries Ltd., Leonardo S.P.A, L3Harris Technologies Inc., Quantum 3D, Raytheon Technologies Corporation, Simlat UAS Simulation, and Singapore Technologies Electronic Limited.

Overview

Unmanned aerial vehicle (UAV) is an aerial transportation medium that operates without on-board crew or passengers guided by remote control, autonomously, or both. UAV is the next generation aircraft technology utilized for surveillance, assessment, logistics, and photography. It has applications in various industries including military & defense, agricultural, civil & commercial, logistics & transportation, healthcare, construction & mining, and others. For effective working of UAVs in several sectors its simulation is utilized to train operators. UAV simulation is used to train operators or pilots to control an unmanned aircraft or its payload from a control station. UAV simulation systems plays an important role in the training of personnel as these systems artificially recreate aircraft flight environment for pilot training or other purposes.
Several key players operating in unmanned aerial vehicles simulation market are developing and launching simulation software for UAV testing, which fuels the growth of the market. For instance, in March 2019, UAVOS introduced a simulator for different types of drones and unmanned systems offering a wide range of learning experiences. The software has been integrated with drones weighing from 1 kg to 1200 kg.
The global unmanned aerial vehicles simulation market is experiencing growth, due to rising adoption of UAVs in military and commercial applications, and a smaller number of skilled and trained pilots. However, high cost of UAV simulation systems hampers the growth of the market. Furthermore, rise in defense expenditure globally, and contracts & agreements with military forces are expected to offer growth opportunities during the forecast period.
The unmanned aerial vehicles (UAVs) simulation market is segmented on the basis of component, drone type, end use, and region. By component, it is bifurcated into hardware, and software. By drone type, it is classified into fixed-wing, and rotary wing. By end use, it is categorized into military, and civil & commercial. By region, the report is analyzed across North America, Europe, Asia-Pacific, and LAMEA. 

Key Benefits For Stakeholders

●This report provides a quantitative analysis of the market segments, current trends, estimations, and dynamics of the unmanned aerial vehicles (uavs) simulation market analysis from 2021 to 2031 to identify the prevailing unmanned aerial vehicles (uavs) simulation market opportunities.
●The market research is offered along with information related to key drivers, restraints, and opportunities.
●Porter's five forces analysis highlights the potency of buyers and suppliers to enable stakeholders make profit-oriented business decisions and strengthen their supplier-buyer network.
●In-depth analysis of the unmanned aerial vehicles (uavs) simulation market segmentation assists to determine the prevailing market opportunities.
●Major countries in each region are mapped according to their revenue contribution to the global market.
●Market player positioning facilitates benchmarking and provides a clear understanding of the present position of the market players.
●The report includes the analysis of the regional as well as global unmanned aerial vehicles (uavs) simulation market trends, key players, market segments, application areas, and market growth strategies.
Key Market Segments
○ Indra Sistem

Scope of Unmanned Aerial Vehicles (UAVs) Simulation Market Report

Report Metric Details
Report Name Unmanned Aerial Vehicles (UAVs) Simulation Market
Accounted market size in 2021 $ 0.6 billion
Forecasted market size in 2031 $ 2.5 billion
CAGR 14.6%
Base Year 2021
Forecasted years 2024 - 2031
By Component ● Hardware
● Software
By Drone Type ● Rotary wing
● Fixed wing
By End Use ● Military
● Civil and Commercial
By Region
  • North America (United States, Canada)
  • Europe (Germany, France, UK, Italy, Russia) Rest of Europe
  • Nordic Countries
  • Asia-Pacific (China, Japan, South Korea)
  • Southeast Asia (India, Australia)
  • Rest of Asia
  • Latin America (Mexico, Brazil)
  • Rest of Latin America
  • Middle East & Africa (Turkey, Saudi Arabia, UAE, Rest of MEA)
Forecast units USD million in value
Report coverage Revenue and volume forecast, company share, competitive landscape, growth factors and trends

FAQ for this report

How fast is Unmanned Aerial Vehicles (UAVs) Simulation Market growing?

Ans: The Unmanned Aerial Vehicles (UAVs) Simulation Market witnessing a CAGR of 14.6% during the forecast period 2024-2031.

What is the Unmanned Aerial Vehicles (UAVs) Simulation Market size in 2031?

Ans: The Unmanned Aerial Vehicles (UAVs) Simulation Market size in 2031 will be $ 2.5 billion.

What are the Type segmentation covered in the Unmanned Aerial Vehicles (UAVs) Simulation Market report?

Ans: The Types covered in the Unmanned Aerial Vehicles (UAVs) Simulation Market report are ● Rotary wing, ● Fixed wing

CHAPTER 1:INTRODUCTION
1.1.Report description
1.2.Key market segments
1.3.Key benefits to the stakeholders
1.4.Research Methodology
1.4.1.Secondary research
1.4.2.Primary research
1.4.3.Analyst tools and models
CHAPTER 2:EXECUTIVE SUMMARY
2.1.Key findings of the study
2.2.CXO Perspective
CHAPTER 3:MARKET OVERVIEW
3.1.Market definition and scope
3.2.Key findings
3.2.1.Top investment pockets
3.3.Porter’s five forces analysis
3.4.Top player positioning
3.5.Market dynamics
3.5.1.Drivers
3.5.2.Restraints
3.5.3.Opportunities
3.6.COVID-19 Impact Analysis on the market
CHAPTER 4: UNMANNED AERIAL VEHICLES (UAVS) SIMULATION MARKET, BY COMPONENT
4.1 Overview
4.1.1 Market size and forecast
4.2 Hardware
4.2.1 Key market trends, growth factors and opportunities
4.2.2 Market size and forecast, by region
4.2.3 Market analysis by country
4.3 Software
4.3.1 Key market trends, growth factors and opportunities
4.3.2 Market size and forecast, by region
4.3.3 Market analysis by country
CHAPTER 5: UNMANNED AERIAL VEHICLES (UAVS) SIMULATION MARKET, BY DRONE TYPE
5.1 Overview
5.1.1 Market size and forecast
5.2 Fixed wing
5.2.1 Key market trends, growth factors and opportunities
5.2.2 Market size and forecast, by region
5.2.3 Market analysis by country
5.3 Rotary wing
5.3.1 Key market trends, growth factors and opportunities
5.3.2 Market size and forecast, by region
5.3.3 Market analysis by country
CHAPTER 6: UNMANNED AERIAL VEHICLES (UAVS) SIMULATION MARKET, BY END USE
6.1 Overview
6.1.1 Market size and forecast
6.2 Military
6.2.1 Key market trends, growth factors and opportunities
6.2.2 Market size and forecast, by region
6.2.3 Market analysis by country
6.3 Civil and Commercial
6.3.1 Key market trends, growth factors and opportunities
6.3.2 Market size and forecast, by region
6.3.3 Market analysis by country
CHAPTER 7: UNMANNED AERIAL VEHICLES (UAVS) SIMULATION MARKET, BY REGION
7.1 Overview
7.1.1 Market size and forecast
7.2 North America
7.2.1 Key trends and opportunities
7.2.2 North America Market size and forecast, by Component
7.2.3 North America Market size and forecast, by Drone Type
7.2.4 North America Market size and forecast, by End Use
7.2.5 North America Market size and forecast, by country
7.2.5.1 U.S.
7.2.5.1.1 Market size and forecast, by Component
7.2.5.1.2 Market size and forecast, by Drone Type
7.2.5.1.3 Market size and forecast, by End Use
7.2.5.2 Canada
7.2.5.2.1 Market size and forecast, by Component
7.2.5.2.2 Market size and forecast, by Drone Type
7.2.5.2.3 Market size and forecast, by End Use
7.2.5.3 Mexico
7.2.5.3.1 Market size and forecast, by Component
7.2.5.3.2 Market size and forecast, by Drone Type
7.2.5.3.3 Market size and forecast, by End Use
7.3 Europe
7.3.1 Key trends and opportunities
7.3.2 Europe Market size and forecast, by Component
7.3.3 Europe Market size and forecast, by Drone Type
7.3.4 Europe Market size and forecast, by End Use
7.3.5 Europe Market size and forecast, by country
7.3.5.1 Germany
7.3.5.1.1 Market size and forecast, by Component
7.3.5.1.2 Market size and forecast, by Drone Type
7.3.5.1.3 Market size and forecast, by End Use
7.3.5.2 UK
7.3.5.2.1 Market size and forecast, by Component
7.3.5.2.2 Market size and forecast, by Drone Type
7.3.5.2.3 Market size and forecast, by End Use
7.3.5.3 France
7.3.5.3.1 Market size and forecast, by Component
7.3.5.3.2 Market size and forecast, by Drone Type
7.3.5.3.3 Market size and forecast, by End Use
7.3.5.4 Italy
7.3.5.4.1 Market size and forecast, by Component
7.3.5.4.2 Market size and forecast, by Drone Type
7.3.5.4.3 Market size and forecast, by End Use
7.3.5.5 Rest of Europe
7.3.5.5.1 Market size and forecast, by Component
7.3.5.5.2 Market size and forecast, by Drone Type
7.3.5.5.3 Market size and forecast, by End Use
7.4 Asia-Pacific
7.4.1 Key trends and opportunities
7.4.2 Asia-Pacific Market size and forecast, by Component
7.4.3 Asia-Pacific Market size and forecast, by Drone Type
7.4.4 Asia-Pacific Market size and forecast, by End Use
7.4.5 Asia-Pacific Market size and forecast, by country
7.4.5.1 China
7.4.5.1.1 Market size and forecast, by Component
7.4.5.1.2 Market size and forecast, by Drone Type
7.4.5.1.3 Market size and forecast, by End Use
7.4.5.2 Japan
7.4.5.2.1 Market size and forecast, by Component
7.4.5.2.2 Market size and forecast, by Drone Type
7.4.5.2.3 Market size and forecast, by End Use
7.4.5.3 India
7.4.5.3.1 Market size and forecast, by Component
7.4.5.3.2 Market size and forecast, by Drone Type
7.4.5.3.3 Market size and forecast, by End Use
7.4.5.4 South Korea
7.4.5.4.1 Market size and forecast, by Component
7.4.5.4.2 Market size and forecast, by Drone Type
7.4.5.4.3 Market size and forecast, by End Use
7.4.5.5 Rest of Asia-Pacific
7.4.5.5.1 Market size and forecast, by Component
7.4.5.5.2 Market size and forecast, by Drone Type
7.4.5.5.3 Market size and forecast, by End Use
7.5 LAMEA
7.5.1 Key trends and opportunities
7.5.2 LAMEA Market size and forecast, by Component
7.5.3 LAMEA Market size and forecast, by Drone Type
7.5.4 LAMEA Market size and forecast, by End Use
7.5.5 LAMEA Market size and forecast, by country
7.5.5.1 Latin America
7.5.5.1.1 Market size and forecast, by Component
7.5.5.1.2 Market size and forecast, by Drone Type
7.5.5.1.3 Market size and forecast, by End Use
7.5.5.2 Middle East
7.5.5.2.1 Market size and forecast, by Component
7.5.5.2.2 Market size and forecast, by Drone Type
7.5.5.2.3 Market size and forecast, by End Use
7.5.5.3 Africa
7.5.5.3.1 Market size and forecast, by Component
7.5.5.3.2 Market size and forecast, by Drone Type
7.5.5.3.3 Market size and forecast, by End Use
CHAPTER 8: COMPANY LANDSCAPE
8.1. Introduction
8.2. Top winning strategies
8.3. Product Mapping of Top 10 Player
8.4. Competitive Dashboard
8.5. Competitive Heatmap
8.6. Key developments
CHAPTER 9: COMPANY PROFILES
9.1 SIMLAT UAS SIMULATION
9.1.1 Company overview
9.1.2 Company snapshot
9.1.3 Operating business segments
9.1.4 Product portfolio
9.1.5 Business performance
9.1.6 Key strategic moves and developments
9.2 SINGAPORE TECHNOLOGIES ELECTRONICS LIMITED
9.2.1 Company overview
9.2.2 Company snapshot
9.2.3 Operating business segments
9.2.4 Product portfolio
9.2.5 Business performance
9.2.6 Key strategic moves and developments
9.3 BLUEHALO
9.3.1 Company overview
9.3.2 Company snapshot
9.3.3 Operating business segments
9.3.4 Product portfolio
9.3.5 Business performance
9.3.6 Key strategic moves and developments
9.4 Quantum3D
9.4.1 Company overview
9.4.2 Company snapshot
9.4.3 Operating business segments
9.4.4 Product portfolio
9.4.5 Business performance
9.4.6 Key strategic moves and developments
9.5 Raytheon Technologies
9.5.1 Company overview
9.5.2 Company snapshot
9.5.3 Operating business segments
9.5.4 Product portfolio
9.5.5 Business performance
9.5.6 Key strategic moves and developments
9.6 L3Harris Technologies, Inc.
9.6.1 Company overview
9.6.2 Company snapshot
9.6.3 Operating business segments
9.6.4 Product portfolio
9.6.5 Business performance
9.6.6 Key strategic moves and developments
9.7 CAE Inc.
9.7.1 Company overview
9.7.2 Company snapshot
9.7.3 Operating business segments
9.7.4 Product portfolio
9.7.5 Business performance
9.7.6 Key strategic moves and developments
9.8 General Atomics Aeronautical Systems, Inc.
9.8.1 Company overview
9.8.2 Company snapshot
9.8.3 Operating business segments
9.8.4 Product portfolio
9.8.5 Business performance
9.8.6 Key strategic moves and developments
9.9 Israel Aerospace Industries Ltd.
9.9.1 Company overview
9.9.2 Company snapshot
9.9.3 Operating business segments
9.9.4 Product portfolio
9.9.5 Business performance
9.9.6 Key strategic moves and developments
9.10 Leonardo S.p.A.
9.10.1 Company overview
9.10.2 Company snapshot
9.10.3 Operating business segments
9.10.4 Product portfolio
9.10.5 Business performance
9.10.6 Key strategic moves and developments
9.11 HAVELSAN A.S.
9.11.1 Company overview
9.11.2 Company snapshot
9.11.3 Operating business segments
9.11.4 Product portfolio
9.11.5 Business performance
9.11.6 Key strategic moves and developments
9.12 Indra Sistema
9.12.1 Company overview
9.12.2 Company snapshot
9.12.3 Operating business segments
9.12.4 Product portfolio
9.12.5 Business performance
9.12.6 Key strategic moves and development
LIST OF TABLES
TABLE 1. GLOBAL UNMANNED AERIAL VEHICLES (UAVS) SIMULATION MARKET, BY COMPONENT, 2021-2031 ($MILLION)
TABLE 2. UNMANNED AERIAL VEHICLES (UAVS) SIMULATION MARKET, FOR HARDWARE, BY REGION, 2021-2031 ($MILLION)
TABLE 3. UNMANNED AERIAL VEHICLES (UAVS) SIMULATION MARKET FOR HARDWARE, BY COUNTRY, 2021-2031 ($MILLION)
TABLE 4. UNMANNED AERIAL VEHICLES (UAVS) SIMULATION MARKET, FOR SOFTWARE, BY REGION, 2021-2031 ($MILLION)
TABLE 5. UNMANNED AERIAL VEHICLES (UAVS) SIMULATION MARKET FOR SOFTWARE, BY COUNTRY, 2021-2031 ($MILLION)
TABLE 6. GLOBAL UNMANNED AERIAL VEHICLES (UAVS) SIMULATION MARKET, BY DRONE TYPE, 2021-2031 ($MILLION)
TABLE 7. UNMANNED AERIAL VEHICLES (UAVS) SIMULATION MARKET, FOR FIXED WING, BY REGION, 2021-2031 ($MILLION)
TABLE 8. UNMANNED AERIAL VEHICLES (UAVS) SIMULATION MARKET FOR FIXED WING, BY COUNTRY, 2021-2031 ($MILLION)
TABLE 9. UNMANNED AERIAL VEHICLES (UAVS) SIMULATION MARKET, FOR ROTARY WING, BY REGION, 2021-2031 ($MILLION)
TABLE 10. UNMANNED AERIAL VEHICLES (UAVS) SIMULATION MARKET FOR ROTARY WING, BY COUNTRY, 2021-2031 ($MILLION)
TABLE 11. GLOBAL UNMANNED AERIAL VEHICLES (UAVS) SIMULATION MARKET, BY END USE, 2021-2031 ($MILLION)
TABLE 12. UNMANNED AERIAL VEHICLES (UAVS) SIMULATION MARKET, FOR MILITARY, BY REGION, 2021-2031 ($MILLION)
TABLE 13. UNMANNED AERIAL VEHICLES (UAVS) SIMULATION MARKET FOR MILITARY, BY COUNTRY, 2021-2031 ($MILLION)
TABLE 14. UNMANNED AERIAL VEHICLES (UAVS) SIMULATION MARKET, FOR CIVIL AND COMMERCIAL, BY REGION, 2021-2031 ($MILLION)
TABLE 15. UNMANNED AERIAL VEHICLES (UAVS) SIMULATION MARKET FOR CIVIL AND COMMERCIAL, BY COUNTRY, 2021-2031 ($MILLION)
TABLE 16. UNMANNED AERIAL VEHICLES (UAVS) SIMULATION MARKET, BY REGION, 2021-2031 ($MILLION)
TABLE 17. NORTH AMERICA UNMANNED AERIAL VEHICLES (UAVS) SIMULATION MARKET, BY COMPONENT, 2021-2031 ($MILLION)
TABLE 18. NORTH AMERICA UNMANNED AERIAL VEHICLES (UAVS) SIMULATION MARKET, BY DRONE TYPE, 2021-2031 ($MILLION)
TABLE 19. NORTH AMERICA UNMANNED AERIAL VEHICLES (UAVS) SIMULATION MARKET, BY END USE, 2021-2031 ($MILLION)
TABLE 20. NORTH AMERICA UNMANNED AERIAL VEHICLES (UAVS) SIMULATION MARKET, BY COUNTRY, 2021-2031 ($MILLION)
TABLE 21. U.S. UNMANNED AERIAL VEHICLES (UAVS) SIMULATION MARKET, BY COMPONENT, 2021-2031 ($MILLION)
TABLE 22. U.S. UNMANNED AERIAL VEHICLES (UAVS) SIMULATION MARKET, BY DRONE TYPE, 2021-2031 ($MILLION)
TABLE 23. U.S. UNMANNED AERIAL VEHICLES (UAVS) SIMULATION MARKET, BY END USE, 2021-2031 ($MILLION)
TABLE 24. CANADA UNMANNED AERIAL VEHICLES (UAVS) SIMULATION MARKET, BY COMPONENT, 2021-2031 ($MILLION)
TABLE 25. CANADA UNMANNED AERIAL VEHICLES (UAVS) SIMULATION MARKET, BY DRONE TYPE, 2021-2031 ($MILLION)
TABLE 26. CANADA UNMANNED AERIAL VEHICLES (UAVS) SIMULATION MARKET, BY END USE, 2021-2031 ($MILLION)
TABLE 27. MEXICO UNMANNED AERIAL VEHICLES (UAVS) SIMULATION MARKET, BY COMPONENT, 2021-2031 ($MILLION)
TABLE 28. MEXICO UNMANNED AERIAL VEHICLES (UAVS) SIMULATION MARKET, BY DRONE TYPE, 2021-2031 ($MILLION)
TABLE 29. MEXICO UNMANNED AERIAL VEHICLES (UAVS) SIMULATION MARKET, BY END USE, 2021-2031 ($MILLION)
TABLE 30. EUROPE UNMANNED AERIAL VEHICLES (UAVS) SIMULATION MARKET, BY COMPONENT, 2021-2031 ($MILLION)
TABLE 31. EUROPE UNMANNED AERIAL VEHICLES (UAVS) SIMULATION MARKET, BY DRONE TYPE, 2021-2031 ($MILLION)
TABLE 32. EUROPE UNMANNED AERIAL VEHICLES (UAVS) SIMULATION MARKET, BY END USE, 2021-2031 ($MILLION)
TABLE 33. EUROPE UNMANNED AERIAL VEHICLES (UAVS) SIMULATION MARKET, BY COUNTRY, 2021-2031 ($MILLION)
TABLE 34. GERMANY UNMANNED AERIAL VEHICLES (UAVS) SIMULATION MARKET, BY COMPONENT, 2021-2031 ($MILLION)
TABLE 35. GERMANY UNMANNED AERIAL VEHICLES (UAVS) SIMULATION MARKET, BY DRONE TYPE, 2021-2031 ($MILLION)
TABLE 36. GERMANY UNMANNED AERIAL VEHICLES (UAVS) SIMULATION MARKET, BY END USE, 2021-2031 ($MILLION)
TABLE 37. UK UNMANNED AERIAL VEHICLES (UAVS) SIMULATION MARKET, BY COMPONENT, 2021-2031 ($MILLION)
TABLE 38. UK UNMANNED AERIAL VEHICLES (UAVS) SIMULATION MARKET, BY DRONE TYPE, 2021-2031 ($MILLION)
TABLE 39. UK UNMANNED AERIAL VEHICLES (UAVS) SIMULATION MARKET, BY END USE, 2021-2031 ($MILLION)
TABLE 40. FRANCE UNMANNED AERIAL VEHICLES (UAVS) SIMULATION MARKET, BY COMPONENT, 2021-2031 ($MILLION)
TABLE 41. FRANCE UNMANNED AERIAL VEHICLES (UAVS) SIMULATION MARKET, BY DRONE TYPE, 2021-2031 ($MILLION)
TABLE 42. FRANCE UNMANNED AERIAL VEHICLES (UAVS) SIMULATION MARKET, BY END USE, 2021-2031 ($MILLION)
TABLE 43. ITALY UNMANNED AERIAL VEHICLES (UAVS) SIMULATION MARKET, BY COMPONENT, 2021-2031 ($MILLION)
TABLE 44. ITALY UNMANNED AERIAL VEHICLES (UAVS) SIMULATION MARKET, BY DRONE TYPE, 2021-2031 ($MILLION)
TABLE 45. ITALY UNMANNED AERIAL VEHICLES (UAVS) SIMULATION MARKET, BY END USE, 2021-2031 ($MILLION)
TABLE 46. REST OF EUROPE UNMANNED AERIAL VEHICLES (UAVS) SIMULATION MARKET, BY COMPONENT, 2021-2031 ($MILLION)
TABLE 47. REST OF EUROPE UNMANNED AERIAL VEHICLES (UAVS) SIMULATION MARKET, BY DRONE TYPE, 2021-2031 ($MILLION)
TABLE 48. REST OF EUROPE UNMANNED AERIAL VEHICLES (UAVS) SIMULATION MARKET, BY END USE, 2021-2031 ($MILLION)
TABLE 49. ASIA-PACIFIC UNMANNED AERIAL VEHICLES (UAVS) SIMULATION MARKET, BY COMPONENT, 2021-2031 ($MILLION)
TABLE 50. ASIA-PACIFIC UNMANNED AERIAL VEHICLES (UAVS) SIMULATION MARKET, BY DRONE TYPE, 2021-2031 ($MILLION)
TABLE 51. ASIA-PACIFIC UNMANNED AERIAL VEHICLES (UAVS) SIMULATION MARKET, BY END USE, 2021-2031 ($MILLION)
TABLE 52. ASIA-PACIFIC UNMANNED AERIAL VEHICLES (UAVS) SIMULATION MARKET, BY COUNTRY, 2021-2031 ($MILLION)
TABLE 53. CHINA UNMANNED AERIAL VEHICLES (UAVS) SIMULATION MARKET, BY COMPONENT, 2021-2031 ($MILLION)
TABLE 54. CHINA UNMANNED AERIAL VEHICLES (UAVS) SIMULATION MARKET, BY DRONE TYPE, 2021-2031 ($MILLION)
TABLE 55. CHINA UNMANNED AERIAL VEHICLES (UAVS) SIMULATION MARKET, BY END USE, 2021-2031 ($MILLION)
TABLE 56. JAPAN UNMANNED AERIAL VEHICLES (UAVS) SIMULATION MARKET, BY COMPONENT, 2021-2031 ($MILLION)
TABLE 57. JAPAN UNMANNED AERIAL VEHICLES (UAVS) SIMULATION MARKET, BY DRONE TYPE, 2021-2031 ($MILLION)
TABLE 58. JAPAN UNMANNED AERIAL VEHICLES (UAVS) SIMULATION MARKET, BY END USE, 2021-2031 ($MILLION)
TABLE 59. INDIA UNMANNED AERIAL VEHICLES (UAVS) SIMULATION MARKET, BY COMPONENT, 2021-2031 ($MILLION)
TABLE 60. INDIA UNMANNED AERIAL VEHICLES (UAVS) SIMULATION MARKET, BY DRONE TYPE, 2021-2031 ($MILLION)
TABLE 61. INDIA UNMANNED AERIAL VEHICLES (UAVS) SIMULATION MARKET, BY END USE, 2021-2031 ($MILLION)
TABLE 62. SOUTH KOREA UNMANNED AERIAL VEHICLES (UAVS) SIMULATION MARKET, BY COMPONENT, 2021-2031 ($MILLION)
TABLE 63. SOUTH KOREA UNMANNED AERIAL VEHICLES (UAVS) SIMULATION MARKET, BY DRONE TYPE, 2021-2031 ($MILLION)
TABLE 64. SOUTH KOREA UNMANNED AERIAL VEHICLES (UAVS) SIMULATION MARKET, BY END USE, 2021-2031 ($MILLION)
TABLE 65. REST OF ASIA-PACIFIC UNMANNED AERIAL VEHICLES (UAVS) SIMULATION MARKET, BY COMPONENT, 2021-2031 ($MILLION)
TABLE 66. REST OF ASIA-PACIFIC UNMANNED AERIAL VEHICLES (UAVS) SIMULATION MARKET, BY DRONE TYPE, 2021-2031 ($MILLION)
TABLE 67. REST OF ASIA-PACIFIC UNMANNED AERIAL VEHICLES (UAVS) SIMULATION MARKET, BY END USE, 2021-2031 ($MILLION)
TABLE 68. LAMEA UNMANNED AERIAL VEHICLES (UAVS) SIMULATION MARKET, BY COMPONENT, 2021-2031 ($MILLION)
TABLE 69. LAMEA UNMANNED AERIAL VEHICLES (UAVS) SIMULATION MARKET, BY DRONE TYPE, 2021-2031 ($MILLION)
TABLE 70. LAMEA UNMANNED AERIAL VEHICLES (UAVS) SIMULATION MARKET, BY END USE, 2021-2031 ($MILLION)
TABLE 71. LAMEA UNMANNED AERIAL VEHICLES (UAVS) SIMULATION MARKET, BY COUNTRY, 2021-2031 ($MILLION)
TABLE 72. LATIN AMERICA UNMANNED AERIAL VEHICLES (UAVS) SIMULATION MARKET, BY COMPONENT, 2021-2031 ($MILLION)
TABLE 73. LATIN AMERICA UNMANNED AERIAL VEHICLES (UAVS) SIMULATION MARKET, BY DRONE TYPE, 2021-2031 ($MILLION)
TABLE 74. LATIN AMERICA UNMANNED AERIAL VEHICLES (UAVS) SIMULATION MARKET, BY END USE, 2021-2031 ($MILLION)
TABLE 75. MIDDLE EAST UNMANNED AERIAL VEHICLES (UAVS) SIMULATION MARKET, BY COMPONENT, 2021-2031 ($MILLION)
TABLE 76. MIDDLE EAST UNMANNED AERIAL VEHICLES (UAVS) SIMULATION MARKET, BY DRONE TYPE, 2021-2031 ($MILLION)
TABLE 77. MIDDLE EAST UNMANNED AERIAL VEHICLES (UAVS) SIMULATION MARKET, BY END USE, 2021-2031 ($MILLION)
TABLE 78. AFRICA UNMANNED AERIAL VEHICLES (UAVS) SIMULATION MARKET, BY COMPONENT, 2021-2031 ($MILLION)
TABLE 79. AFRICA UNMANNED AERIAL VEHICLES (UAVS) SIMULATION MARKET, BY DRONE TYPE, 2021-2031 ($MILLION)
TABLE 80. AFRICA UNMANNED AERIAL VEHICLES (UAVS) SIMULATION MARKET, BY END USE, 2021-2031 ($MILLION)
TABLE 81.SIMLAT UAS SIMULATION: COMPANY SNAPSHOT
TABLE 82.SIMLAT UAS SIMULATION: OPERATING SEGMENTS
TABLE 83.SIMLAT UAS SIMULATION: PRODUCT PORTFOLIO
TABLE 84.SIMLAT UAS SIMULATION: NET SALES,
TABLE 85.SIMLAT UAS SIMULATION: KEY STRATERGIES
TABLE 86.SINGAPORE TECHNOLOGIES ELECTRONICS LIMITED: COMPANY SNAPSHOT
TABLE 87.SINGAPORE TECHNOLOGIES ELECTRONICS LIMITED: OPERATING SEGMENTS
TABLE 88.SINGAPORE TECHNOLOGIES ELECTRONICS LIMITED: PRODUCT PORTFOLIO
TABLE 89.SINGAPORE TECHNOLOGIES ELECTRONICS LIMITED: NET SALES,
TABLE 90.SINGAPORE TECHNOLOGIES ELECTRONICS LIMITED: KEY STRATERGIES
TABLE 91.BLUEHALO: COMPANY SNAPSHOT
TABLE 92.BLUEHALO: OPERATING SEGMENTS
TABLE 93.BLUEHALO: PRODUCT PORTFOLIO
TABLE 94.BLUEHALO: NET SALES,
TABLE 95.BLUEHALO: KEY STRATERGIES
TABLE 96.QUANTUM3D: COMPANY SNAPSHOT
TABLE 97.QUANTUM3D: OPERATING SEGMENTS
TABLE 98.QUANTUM3D: PRODUCT PORTFOLIO
TABLE 99.QUANTUM3D: NET SALES,
TABLE 100.QUANTUM3D: KEY STRATERGIES
TABLE 101.RAYTHEON TECHNOLOGIES: COMPANY SNAPSHOT
TABLE 102.RAYTHEON TECHNOLOGIES: OPERATING SEGMENTS
TABLE 103.RAYTHEON TECHNOLOGIES: PRODUCT PORTFOLIO
TABLE 104.RAYTHEON TECHNOLOGIES: NET SALES,
TABLE 105.RAYTHEON TECHNOLOGIES: KEY STRATERGIES
TABLE 106.L3HARRIS TECHNOLOGIES, INC.: COMPANY SNAPSHOT
TABLE 107.L3HARRIS TECHNOLOGIES, INC.: OPERATING SEGMENTS
TABLE 108.L3HARRIS TECHNOLOGIES, INC.: PRODUCT PORTFOLIO
TABLE 109.L3HARRIS TECHNOLOGIES, INC.: NET SALES,
TABLE 110.L3HARRIS TECHNOLOGIES, INC.: KEY STRATERGIES
TABLE 111.CAE INC.: COMPANY SNAPSHOT
TABLE 112.CAE INC.: OPERATING SEGMENTS
TABLE 113.CAE INC.: PRODUCT PORTFOLIO
TABLE 114.CAE INC.: NET SALES,
TABLE 115.CAE INC.: KEY STRATERGIES
TABLE 116.GENERAL ATOMICS AERONAUTICAL SYSTEMS, INC.: COMPANY SNAPSHOT
TABLE 117.GENERAL ATOMICS AERONAUTICAL SYSTEMS, INC.: OPERATING SEGMENTS
TABLE 118.GENERAL ATOMICS AERONAUTICAL SYSTEMS, INC.: PRODUCT PORTFOLIO
TABLE 119.GENERAL ATOMICS AERONAUTICAL SYSTEMS, INC.: NET SALES,
TABLE 120.GENERAL ATOMICS AERONAUTICAL SYSTEMS, INC.: KEY STRATERGIES
TABLE 121.ISRAEL AEROSPACE INDUSTRIES LTD.: COMPANY SNAPSHOT
TABLE 122.ISRAEL AEROSPACE INDUSTRIES LTD.: OPERATING SEGMENTS
TABLE 123.ISRAEL AEROSPACE INDUSTRIES LTD.: PRODUCT PORTFOLIO
TABLE 124.ISRAEL AEROSPACE INDUSTRIES LTD.: NET SALES,
TABLE 125.ISRAEL AEROSPACE INDUSTRIES LTD.: KEY STRATERGIES
TABLE 126.LEONARDO S.P.A.: COMPANY SNAPSHOT
TABLE 127.LEONARDO S.P.A.: OPERATING SEGMENTS
TABLE 128.LEONARDO S.P.A.: PRODUCT PORTFOLIO
TABLE 129.LEONARDO S.P.A.: NET SALES,
TABLE 130.LEONARDO S.P.A.: KEY STRATERGIES
TABLE 131.HAVELSAN A.S.: COMPANY SNAPSHOT
TABLE 132.HAVELSAN A.S.: OPERATING SEGMENTS
TABLE 133.HAVELSAN A.S.: PRODUCT PORTFOLIO
TABLE 134.HAVELSAN A.S.: NET SALES,
TABLE 135.HAVELSAN A.S.: KEY STRATERGIES
TABLE 136.INDRA SISTEMA: COMPANY SNAPSHOT
TABLE 137.INDRA SISTEMA: OPERATING SEGMENTS
TABLE 138.INDRA SISTEMA: PRODUCT PORTFOLIO
TABLE 139.INDRA SISTEMA: NET SALES,
TABLE 140.INDRA SISTEMA: KEY STRATERGIES LIST OF FIGURES
FIGURE 1.UNMANNED AERIAL VEHICLES (UAVS) SIMULATION MARKET SEGMENTATION
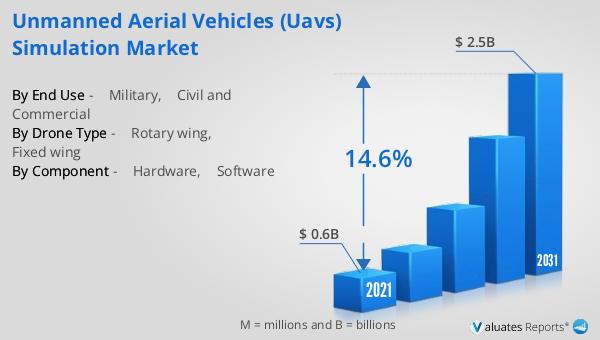
FIGURE 2.UNMANNED AERIAL VEHICLES (UAVS) SIMULATION MARKET,2021-2031
FIGURE 3.UNMANNED AERIAL VEHICLES (UAVS) SIMULATION MARKET,2021-2031
FIGURE 4. TOP INVESTMENT POCKETS, BY REGION
FIGURE 5.PORTER FIVE-1
FIGURE 6.PORTER FIVE-2
FIGURE 7.PORTER FIVE-3
FIGURE 8.PORTER FIVE-4
FIGURE 9.PORTER FIVE-5
FIGURE 10.TOP PLAYER POSITIONING
FIGURE 11.UNMANNED AERIAL VEHICLES (UAVS) SIMULATION MARKET:DRIVERS, RESTRAINTS AND OPPORTUNITIES
FIGURE 12.UNMANNED AERIAL VEHICLES (UAVS) SIMULATION MARKET,BY COMPONENT,2021(%)
FIGURE 13.COMPARATIVE SHARE ANALYSIS OF HARDWARE UNMANNED AERIAL VEHICLES (UAVS) SIMULATION MARKET,2021-2031(%)
FIGURE 14.COMPARATIVE SHARE ANALYSIS OF SOFTWARE UNMANNED AERIAL VEHICLES (UAVS) SIMULATION MARKET,2021-2031(%)
FIGURE 15.UNMANNED AERIAL VEHICLES (UAVS) SIMULATION MARKET,BY DRONE TYPE,2021(%)
FIGURE 16.COMPARATIVE SHARE ANALYSIS OF FIXED WING UNMANNED AERIAL VEHICLES (UAVS) SIMULATION MARKET,2021-2031(%)
FIGURE 17.COMPARATIVE SHARE ANALYSIS OF ROTARY WING UNMANNED AERIAL VEHICLES (UAVS) SIMULATION MARKET,2021-2031(%)
FIGURE 18.UNMANNED AERIAL VEHICLES (UAVS) SIMULATION MARKET,BY END USE,2021(%)
FIGURE 19.COMPARATIVE SHARE ANALYSIS OF MILITARY UNMANNED AERIAL VEHICLES (UAVS) SIMULATION MARKET,2021-2031(%)
FIGURE 20.COMPARATIVE SHARE ANALYSIS OF CIVIL AND COMMERCIAL UNMANNED AERIAL VEHICLES (UAVS) SIMULATION MARKET,2021-2031(%)
FIGURE 21.UNMANNED AERIAL VEHICLES (UAVS) SIMULATION MARKET BY REGION,2021
FIGURE 22.U.S. UNMANNED AERIAL VEHICLES (UAVS) SIMULATION MARKET,2021-2031($MILLION)
FIGURE 23.CANADA UNMANNED AERIAL VEHICLES (UAVS) SIMULATION MARKET,2021-2031($MILLION)
FIGURE 24.MEXICO UNMANNED AERIAL VEHICLES (UAVS) SIMULATION MARKET,2021-2031($MILLION)
FIGURE 25.GERMANY UNMANNED AERIAL VEHICLES (UAVS) SIMULATION MARKET,2021-2031($MILLION)
FIGURE 26.UK UNMANNED AERIAL VEHICLES (UAVS) SIMULATION MARKET,2021-2031($MILLION)
FIGURE 27.FRANCE UNMANNED AERIAL VEHICLES (UAVS) SIMULATION MARKET,2021-2031($MILLION)
FIGURE 28.ITALY UNMANNED AERIAL VEHICLES (UAVS) SIMULATION MARKET,2021-2031($MILLION)
FIGURE 29.REST OF EUROPE UNMANNED AERIAL VEHICLES (UAVS) SIMULATION MARKET,2021-2031($MILLION)
FIGURE 30.CHINA UNMANNED AERIAL VEHICLES (UAVS) SIMULATION MARKET,2021-2031($MILLION)
FIGURE 31.JAPAN UNMANNED AERIAL VEHICLES (UAVS) SIMULATION MARKET,2021-2031($MILLION)
FIGURE 32.INDIA UNMANNED AERIAL VEHICLES (UAVS) SIMULATION MARKET,2021-2031($MILLION)
FIGURE 33.SOUTH KOREA UNMANNED AERIAL VEHICLES (UAVS) SIMULATION MARKET,2021-2031($MILLION)
FIGURE 34.REST OF ASIA-PACIFIC UNMANNED AERIAL VEHICLES (UAVS) SIMULATION MARKET,2021-2031($MILLION)
FIGURE 35.LATIN AMERICA UNMANNED AERIAL VEHICLES (UAVS) SIMULATION MARKET,2021-2031($MILLION)
FIGURE 36.MIDDLE EAST UNMANNED AERIAL VEHICLES (UAVS) SIMULATION MARKET,2021-2031($MILLION)
FIGURE 37.AFRICA UNMANNED AERIAL VEHICLES (UAVS) SIMULATION MARKET,2021-2031($MILLION)
FIGURE 38. TOP WINNING STRATEGIES, BY YEAR
FIGURE 39. TOP WINNING STRATEGIES, BY DEVELOPMENT
FIGURE 40. TOP WINNING STRATEGIES, BY COMPANY
FIGURE 41.PRODUCT MAPPING OF TOP 10 PLAYERS
FIGURE 42.COMPETITIVE DASHBOARD
FIGURE 43.COMPETITIVE HEATMAP OF TOP 10 KEY PLAYERS
FIGURE 44.SIMLAT UAS SIMULATION.: NET SALES ,($MILLION)
FIGURE 45.SINGAPORE TECHNOLOGIES ELECTRONICS LIMITED.: NET SALES ,($MILLION)
FIGURE 46.BLUEHALO.: NET SALES ,($MILLION)
FIGURE 47.QUANTUM3D.: NET SALES ,($MILLION)
FIGURE 48.RAYTHEON TECHNOLOGIES.: NET SALES ,($MILLION)
FIGURE 49.L3HARRIS TECHNOLOGIES, INC..: NET SALES ,($MILLION)
FIGURE 50.CAE INC..: NET SALES ,($MILLION)
FIGURE 51.GENERAL ATOMICS AERONAUTICAL SYSTEMS, INC..: NET SALES ,($MILLION)
FIGURE 52.ISRAEL AEROSPACE INDUSTRIES LTD..: NET SALES ,($MILLION)
FIGURE 53.LEONARDO S.P.A..: NET SALES ,($MILLION)
FIGURE 54.HAVELSAN A.S..: NET SALES ,($MILLION)
FIGURE 55.INDRA SISTEMA.: NET SALES ,($MILLION
SELECT A FORMAT
Added to Cart
Electronic (PDF)

$5730

This license allows only one user to access the PDF.
Electronic (PDF)

$6450

This license allows 1 - 5 user to access the PDF, license is suitable for small groups of 5 users working together
Electronic (PDF)

$9600

This license allows users/teams in a same Enterprise to use this report, various departments within an enterpise can use this report
Electronic (PDF)

$3840

This license just provides quantitative data in a excel sheet
Add to Cart
Buy Now (15% Discount)

OUR CUSTOMER

Nano String

SIMILAR REPORTS


RELATED REPORTS

Global Four-Wheel Drive Robot Market Research Report 2025

120 Pages
Type: Report
Code: QYRE-Auto-22G19962
Tue Nov 25 00:00:00 UTC 2025

Add to Cart

Global Iridium Satellite Tracker Beacon Market Research Report 2025

120 Pages
Type: Report
Code: QYRE-Auto-33H19976
Sat Nov 22 00:00:00 UTC 2025

Add to Cart

Global Nuclear Power Quadruped Robot Market Research Report 2025

120 Pages
Type: Report
Code: QYRE-Auto-32A19986
Thu Nov 20 00:00:00 UTC 2025

Add to Cart

Global Iridium Tracker Beacon Market Research Report 2025

120 Pages
Type: Report
Code: QYRE-Auto-34Q19734
Thu Nov 20 00:00:00 UTC 2025

Add to Cart