0
U.S. (TOLL FREE)
+1 (315) 215-3225
Automative

0
U.S. (TOLL FREE)
+1 (315) 215-3225
Smart Hospitals Market by Component (Hardware, System & Software, and Service), Product (Smart Pill, mHealth, Telemedicine, and Electronic Health Record), Connectivity (Wired and Wireless), Application (Remote Medicine Management Medical Assistance, Medical Connected Imaging, Electronic Health Record & Clinical Workflow, and Others) and Artificial Intelligence (Offering, Technology, and Application) - Global Opportunity Analysis and Industry Forecast, 2017-2025
Published Date: November 2019
|
Report Code: ALLI-Auto-2R274
Home | Market Reports | Health| Medical Devices & Equipment
 Smart Hospitals Market by Component Hardware System Software and Service Product Smart Pill mHealth Telemedicine and Electronic Health Record Connectivity Wired and Wireless Application Remote Medicine Management Medical Assistance Medical Connected Imaging Electronic Health Record Clinical Workflow and Others and Artificial Intelligence Offering Technology and Application Global Opportunity Analysis and Industry Forecast 2017 2025
BUY CHAPTERS

Smart Hospitals Market by Component (Hardware, System & Software, and Service), Product (Smart Pill, mHealth, Telemedicine, and Electronic Health Record), Connectivity (Wired and Wireless), Application (Remote Medicine Management Medical Assistance, Medical Connected Imaging, Electronic Health Record & Clinical Workflow, and Others) and Artificial Intelligence (Offering, Technology, and Application) - Global Opportunity Analysis and Industry Forecast, 2017-2025

Code: ALLI-Auto-2R274
Report
November 2019
Pages:320
Allied Market Research
Buy Now with 15% Discount
DESCRIPTION
TABLE OF CONTENT
TABLES & FIGURES

Smart Hospitals Market 

The global smart hospitals market was valued at USD 16,925 Million in 2017 and is expected to reach USD 58,777 Million by 2025 with a CAGR of 17.3% during the forecast period. Key drivers of the smart hospitals market include the increasing adoption of connected devices and instruments along with rising technological developments in the healthcare infrastructure. 

Smart Hospitals Market

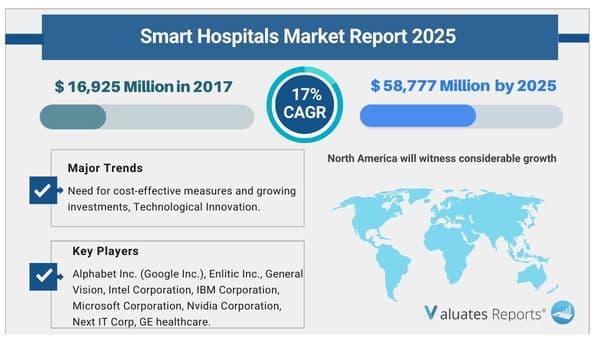
The rising investments in the healthcare sector and the need for cost-effective solutions will bolster the growth of the smart hospitals market during the forecast period.

Trends Influencing the Global Smart Hospitals Market 

Technological innovations

The booming penetration of wearables and implementation of AI, and IoT solutions are revolutionizing the medical industry. The rising chronic diseases are adding up to the burden on healthcare professionals. Moreover with the expansion of healthcare facilities managing administrative tasks is getting difficult.  Artificial intelligence and machine learning algorithms have some viable solutions. Addressing critical medical issues is dependent on obtaining precise information in a timely manner. AI-driven real-time analytics provide rapid results by extracting vital information from a plethora of connected devices like smartphones, and tablets to inform doctors and nurses of immediate changes in patient health status. This streamlines the clinical workflow processes. Maintaining EHR( Electronic Health Records) helps in tracking past medical histories, and appointment scheduling. AI optimizes the claims process thereby saving time and resources. This will expand the growth of the smart hospitals market. Vital operational processes are automated thereby freeing up the time of on-site staff and physicians. Telemedicine and shared networks expand healthcare services to remote inaccessible areas. 

Need for cost-effective measures and growing investments

Smart software and IoT integrated solutions are the need of the hour. These applications offer wired and wireless connectivity. All the data are extracted from mHealth apps, remote medicine management, and connected imaging systems onto a single dashboard for quick decision-making. Doctors are able to track health vitals and other trends in real time. For instance, patients suffering from Alzheimer's or dementia can be monitored through devices that provide location data. Furthermore smart pills or chewable sensors provide accurate images of stomach fluids for efficient diagnosis. Maintenance sensors notify facility managers of dangerous leaks or missing equipment. Alerts are sent out instantaneously to track the movement of all the vital machinery. Precision-based diagnosis improves patient comfort and convenience. This will boost the demand for the smart hospital market in the coming years. Wearable technology and smartphones are gradually penetrating every aspect of medical care. Healthcare providers offer information to patients to work on certain aspects. It can be programmed into goals through tracking devices with constant reminders. 

Covid 19 impact

The onslaught of the pandemic has tremendously increased the burden on hospitals and medical staff. The situation during the initial months of controlling the spread of the virus was difficult. This prompted many medical professionals to deploy artificial intelligence-based sensors for aiding triage in healthcare delivery. This will bolster the growth of the smart hospitals market during the forecast period.  Contactless infrared sensor devices are highly effective in identifying people with fever in crowds. The replacement of manual screening options reduces unnecessary exposure of the staff to infected patients. 

Lack of governance standards and lack of knowledge for deploying IoT solutions

Smart hospitals are complicated. The variability in healthcare quality across the globe creates massive issues. This creates a vacuum between staff and board members and they are unable to operationalize key strategic initiatives. Moreover deploying IoT devices in medical facilities is a tough task. There is a multitude of devices like drug delivery systems, heart monitoring equipment, routers, gateways, and other connected infrastructure. This creates multiple languages, standards, and protocols. The ambiguity around data ownership exemplifies no universally accepted standards. Standardization blocks interoperability. This is expected to hamper the growth prospects of the smart hospitals market in the coming years. Device manufacturers do not have the specialized skillset. It is made in isolation from each other. The integration with legacy hardware systems obstructs the seamless communication process. Teams are inadequately trained and know only pre-existing IT operations. Furthermore, IoT devices are heavily dependent on bandwidth and connectivity. Poor cellular networks can have disastrous consequences. The implementation costs are very high hampering the installation process and leading to a spike in the prices of healthcare services. 

Smart Hospitals Market Share

Based on components, the hardware segment is expected to maintain dominance in the smart hospitals market share and will grow with a CAGR of 13% due to the growing utilization of hardware in hospital settings such as wearables and other stationery devices for patient health management. 

Based on product, telemedicine is expected to dominate in the smart hospitals market share due to growing awareness about the potential benefits of telemedicine, low consultation cost, improved patient access, and high quality of treatment. On the other hand, the electronic health records segment will grow the fastest at a CAGR of 4.1% during the forecast period. 

Based on connectivity, the wireless segment is expected to witness considerable growth in the smart hospitals market share. Wireless devices such as Wifi, Bluetooth, and RFID tags are being used in hospitals to ease the clinical workflow and decrease the costs associated with diagnosis and treatment. RFID will grow at a CAGR of 11.5% during the forecast period. 

Based on application, the electronic health record and clinical workflow segment will provide lucrative opportunities for growth due to rapid adoption owing to the secure sharing of electronic information amongst patients and clinics. It provides quick access to patient data. 

Based on artificial intelligence, the technology segment will grow the largest due to the implementation of deep learning, NLP, and context-aware processing techniques that increase the capacity to store large amounts of data and translate it into functional tools. 

Based on region, North America will witness considerable growth due to the high rate of chronic diseases, rapid increase in the geriatric population, well-established health care infrastructure, and widescale adoption of AI and IoT-driven software applications. While the Asia-pacific segment will grow the fastest due to the huge population base in emerging economies like China and India. The need for intelligent systems to eliminate redundant clinical processes will also contribute to its growth.  

By Component

  • Hardware
  • System & Software
  • Service 

By Product

  • Smart Pill
  • mHealth
  • Telemedicine
  • Electronic Health Record 

By Connectivity

  • Wi-Fi
  • Wired
  • Wireless
  • RFID
  • Bluetooth
  • Others 

By Applications

  • Remote Medicine Management
  • Medical Assistance
  • Medical Connected Imaging
  • Electronic Health Record & Clinical Workflow
  • Others 

By Artificial Intelligence 

  • Offering
  • Technology
  • Application 

By Region

    North America

  • US.
  • Canada
  • Mexico

    Europe

  • Germany
  • France
  • UK
  • Italy
  • Spain
  • Rest of Europe

    Asia-Pacific

  • Japan
  • China
  • India
  • Australia
  • Singapore
  • Rest of Asia-Pacific

    LAMEA

  • Brazil
  • Turkey
  • Saudi Arabia
  • South Africa
  • Rest of LAMEA 

Key Players

  • Alphabet Inc. (Google Inc.)
  • Enlitic Inc.
  • General Vision
  • Intel Corporation
  • IBM Corporation
  • Microsoft Corporation
  • Nvidia Corporation
  • Next IT Corp.
  • Welltok Inc.
  • GE healthcare
  • Adheretech
  • Allscripts
  • Cerner Corporation
  • Diabetizer
  • Medtronic
  • Proteus Digital Health
  • Qualcomm Life.

Scope of Smart Hospitals Market Report

Report Metric

Details

Report Name

Smart Hospitals Market

Market size value in 2017

USD 16,925 Million

Revenue forecast in 2025

USD 58,777 Million

Growth Rate

17.3%

Base year considered

2017

Forecast Period

2018-2025

By Component

Hardware, System & Software, and Service

By Product

Smart Pill, mHealth, Telemedicine, and Electronic Health Record

By Application

Remote Medicine Management Medical Assistance, Medical Connected Imaging, Electronic Health Record & Clinical Workflow

Report Coverage

Revenue & volume forecast, company share, competitive landscape, growth factors, and trends

Segments Covered

By Type, Application, and Region

Geographic Regions Covered

North America, Europe, Asia Pacific, Latin America, Middle East & Africa

Frequently Asked Questions About This Report 

1. How big is the Smart Hospitals Market?

Ans. The global smart hospitals market was valued at $16,925 million in 2017, and is expected to reach $58,777 million by 2025 at a CAGR of 17.3% during the forecast period.

2. Who are the key players available in the Smart Hospitals Industry?

Ans. Some of the major companies are Alphabet Inc. (Google Inc.), Enlitic Inc., General Vision, Intel Corporation, IBM Corporation, Microsoft Corporation, Nvidia Corporation, Next IT Corp, GE healthcare.

3. Does the report provides covid-19 impact analysis?

Ans. Yes, the report includes a COVID-19 impact analysis. Also, it is further extended into every individual segment of the report.

CHAPTER 1: INTRODUCTION
1.1. Report description
1.2. Key benefits for stakeholders
1.3. Key market segments
1.4. Research methodology
1.4.1. Secondary research
1.4.2. Primary research
1.4.3. Analyst tools & models
CHAPTER 2: EXECUTIVE SUMMARY
2.1. CXO perspective
CHAPTER 3: MARKET OVERVIEW
3.1. Market definition and scope
3.2. Key findings
3.2.1. Top investment pockets
3.3. Porters five forces analysis
3.4. Market dynamics
3.4.1. Drivers
3.4.1.1. Advancements in healthcare infrastructure
3.4.1.2. Rising need for cost effective solutions in hospitals
3.4.1.3. Increase in penetration of connected devices and instruments in hospitals
3.4.2. Restraints
3.4.2.1. High cost of connected systems
3.4.2.2. Lack of competence in deploying IoT solutions and lack of governance standards in hospitals
3.4.3. Opportunity
3.4.3.1. Rising investments in healthcare sector in developing economies
CHAPTER 4: SMART HOSPITALS MARKET, BY COMPONENT
4.1. Overview
4.1.1. Market size and forecast
4.2. Hardware
4.2.1. Key market trends and opportunities
4.2.2. Market size and forecast, by region
4.2.3. Market analysis, by country
4.3. Systems and Software
4.3.1. Key market trends and opportunities
4.3.2. Market size and forecast, by region
4.3.3. Market analysis, by country
4.4. Services
4.4.1. Key market trends and opportunities
4.4.2. Market size and forecast, by region
4.4.3. Market analysis, by country
CHAPTER 5: SMART HOSPITALS MARKET, BY PRODUCT
5.1. Overview
5.1.1. Market size and forecast
5.2. Smart Pills
5.2.1. Market size and forecast, by region
5.2.2. Market analysis, by country
5.3. M Health
5.3.1. Market size and forecast, by region
5.3.2. Market analysis, by country
5.4. Telemedicine
5.4.1. Market size and forecast, by region
5.4.2. Market analysis, by country
5.5. Electronic Health Records
5.5.1. Market size and forecast, by region
5.5.2. Market analysis, by country
CHAPTER 6: SMART HOSPITALS MARKET, BY CONNECTIVITY
6.1. Overview
6.1.1. Market size and forecast
6.2. Wired
6.2.1. Market size and forecast, by region
6.2.2. Market analysis, by country
6.3. Wireless
6.3.1. Market size and forecast, by region
6.3.2. Market analysis, by country
6.3.3. Wi-Fi
6.3.3.1. Market size and forecast
6.3.4. RFID (Radio-frequency identification)
6.3.4.1. Market size and forecast
6.3.5. Bluetooth
6.3.5.1. Market size and forecast
6.3.6. Others
6.3.6.1. Market size and forecast
CHAPTER 7: SMART HOSPITALS MARKET, BY APPLICATIONS
7.1. Overview
7.1.1. Market size and forecast
7.2. Remote Medicine Management
7.2.1. Market size and forecast, by region
7.2.2. Market analysis, by country
7.3. Medical Assistance
7.3.1. Market size and forecast, by region
7.3.2. Market analysis, by country
7.4. Medical Connected Imaging
7.4.1. Market size and forecast, by region
7.4.2. Market analysis, by country
7.5. Electronic Health Record & Clinical Workflow
7.5.1. Market size and forecast, by region
7.5.2. Market analysis, by country
7.6. Others
7.6.1. Market size and forecast, by region
7.6.2. Market analysis, by country
CHAPTER 8: ARTIFICIAL INTELLIGENCE IN SMART HOSPITAL MARKET
8.1. Overview
8.2. Offering
8.2.1. Market size and forecast, by offering
8.2.2. Hardware
8.2.2.1. Market size and forecast
8.2.3. Software
8.2.3.1. Market size and forecast
8.2.4. Service
8.2.4.1. Market size and forecast
8.3. Technology
8.3.1. Market size and forecast, by Technology
8.3.2. Deep learning
8.3.2.1. Market size and forecast
8.3.3. Querying method
8.3.3.1. Market size and forecast
8.3.4. Natural language processing
8.3.4.1. Market size and forecast
8.3.5. Context aware processing
8.3.5.1. Market size and forecast
8.4. Application
8.4.1. Market size and forecast, by application
8.4.2. Robot-assisted Surgery
8.4.2.1. Market size and forecast
8.4.3. Virtual Nursing Assistant
8.4.3.1. Market size and forecast
8.4.4. Administrative Workflow Assistance
8.4.4.1. Market size and forecast
8.4.5. Fraud Detection
8.4.5.1. Market size and forecast
8.4.6. Dosage Error Reduction
8.4.6.1. Market size and forecast
8.4.7. Clinical Trial Participant Identifier
8.4.7.1. Market size and forecast
8.4.8. Preliminary Diagnosis
8.4.8.1. Market size and forecast
8.4.9. Others
8.4.9.1. Market size and forecast
CHAPTER 9: SMART HOSPITALS MARKET, BY REGION
9.1. Overview
9.1.1. Market size and forecast
9.2. North America
9.2.1. Key trends and opportunities
9.2.2. North America market size and forecast, by country
9.2.2.1. U.S. market size and forecast, by component
9.2.2.2. U.S. market size and forecast, by product
9.2.2.3. U.S. market size and forecast, by connectivity
9.2.2.4. U.S. market size and forecast, by applications
9.2.2.5. U.S. market size and forecast, by artificial intelligence
9.2.2.6. Canada market size and forecast, by component
9.2.2.7. Canada market size and forecast, by product
9.2.2.8. Canada market size and forecast, by connectivity
9.2.2.9. Canada market size and forecast, by applications
9.2.2.10. Canada market size and forecast, by artificial intelligence
9.2.2.12. Mexico market size and forecast, by component
9.2.2.13. Mexico market size and forecast, by product
9.2.2.14. Mexico market size and forecast, by connectivity
9.2.2.15. Mexico market size and forecast, by applications
9.2.2.16. Mexico market size and forecast, by artificial intelligence
9.2.3. North America market size and forecast, by component
9.2.4. North America market size and forecast, by product
9.2.5. North America market size and forecast, by connectivity
9.2.6. North America market size and forecast, by applications
9.2.7. North America market size and forecast, by artificial intelligence
9.3. Europe
9.3.1. Key trends and opportunities
9.3.2. Europe market size and forecast, by country
9.3.2.1. UK market size and forecast, by component
9.3.2.2. UK market size and forecast, by product
9.3.2.3. UK market size and forecast, by connectivity
9.3.2.4. UK market size and forecast, by applications
9.3.2.5. UK market size and forecast, by artificial intelligence
9.3.2.6. France market size and forecast, by component
9.3.2.7. France market size and forecast, by product
9.3.2.8. France market size and forecast, by connectivity
9.3.2.9. France market size and forecast, by applications
9.3.2.10. France market size and forecast, by artificial intelligence
9.3.2.11. France market size and forecast, by component
9.3.2.12. France market size and forecast, by product
9.3.2.13. France market size and forecast, by connectivity
9.3.2.14. France market size and forecast, by applications
9.3.2.15. France market size and forecast, by artificial intelligence
9.3.2.16. Germany market size and forecast, by component
9.3.2.17. Germany market size and forecast, by product
9.3.2.18. Germany market size and forecast, by connectivity
9.3.2.19. Germany market size and forecast, by applications
9.3.2.20. Germany market size and forecast, by artificial intelligence
9.3.2.21. Spain market size and forecast, by component
9.3.2.22. Spain market size and forecast, by product
9.3.2.23. Spain market size and forecast, by connectivity
9.3.2.24. Spain market size and forecast, by applications
9.3.2.25. Spain market size and forecast, by artificial intelligence
9.3.2.26. Italy market size and forecast, by component
9.3.2.27. Italy market size and forecast, by product
9.3.2.28. Italy market size and forecast, by connectivity
9.3.2.29. Italy market size and forecast, by applications
9.3.2.30. Italy market size and forecast, by artificial intelligence
9.3.2.31. Rest of Europe market size and forecast, by component
9.3.2.32. Rest of Europe market size and forecast, by product
9.3.2.33. Rest of Europe market size and forecast, by connectivity
9.3.2.34. Rest of Europe market size and forecast, by applications
9.3.2.35. Rest of Europe market size and forecast, by artificial intelligence
9.3.3. Europe market size and forecast, by component
9.3.4. Europe market size and forecast, by product
9.3.5. Europe market size and forecast, by connectivity
9.3.6. Europe market size and forecast, by applications
9.3.7. Europe market size and forecast, by artificial intelligence
9.4. Asia-Pacific
9.4.1. Key trends and opportunities
9.4.2. Asia-Pacific market size and forecast, by country
9.4.2.1. Japan market size and forecast, by component
9.4.2.2. Japan market size and forecast, by product
9.4.2.3. Japan market size and forecast, by connectivity
9.4.2.4. Japan market size and forecast, by applications
9.4.2.5. Japan market size and forecast, by artificial intelligence
9.4.2.6. China market size and forecast, by component
9.4.2.7. China market size and forecast, by product
9.4.2.8. China market size and forecast, by connectivity
9.4.2.9. China market size and forecast, by applications
9.4.2.10. China market size and forecast, by artificial intelligence
9.4.2.12. India market size and forecast, by component
9.4.2.13. India market size and forecast, by product
9.4.2.14. India market size and forecast, by connectivity
9.4.2.15. India market size and forecast, by applications
9.4.2.16. India market size and forecast, by artificial intelligence
9.4.2.17. Australia market size and forecast, by component
9.4.2.18. Australia market size and forecast, by product
9.4.2.19. Australia market size and forecast, by connectivity
9.4.2.20. Australia market size and forecast, by applications
9.4.2.21. Australia market size and forecast, by artificial intelligence
9.4.2.22. Korea market size and forecast, by component
9.4.2.23. Korea market size and forecast, by product
9.4.2.24. Korea market size and forecast, by connectivity
9.4.2.25. Korea market size and forecast, by applications
9.4.2.26. Korea market size and forecast, by artificial intelligence
9.4.2.27. Rest of Asia-Pacific market size and forecast, by component
9.4.2.28. Rest of Asia-Pacific market size and forecast, by product
9.4.2.29. Rest of Asia-Pacific market size and forecast, by connectivity
9.4.2.30. Rest of Asia-Pacific market size and forecast, by applications
9.4.2.31. Rest of Asia-Pacific market size and forecast, by artificial intelligence
9.4.3. Asia-Pacific market size and forecast, by component
9.4.4. Asia-Pacific market size and forecast, by product
9.4.5. Asia-Pacific market size and forecast, by connectivity
9.4.6. Asia-Pacific market size and forecast, by applications
9.4.7. Asia-Pacific market size and forecast, by artificial intelligence
9.5. LAMEA
9.5.1. Key trends and opportunities
9.5.2. LAMEA market size and forecast, by country
9.5.2.1. Brazil market size and forecast, by component
9.5.2.2. Brazil market size and forecast, by product
9.5.2.3. Brazil market size and forecast, by connectivity
9.5.2.4. Brazil market size and forecast, by applications
9.5.2.5. Brazil market size and forecast, by artificial intelligence
9.5.2.6. Turkey market size and forecast, by component
9.5.2.7. Turkey market size and forecast, by product
9.5.2.8. Turkey market size and forecast, by connectivity
9.5.2.9. Turkey market size and forecast, by applications
9.5.2.10. Turkey market size and forecast, by artificial intelligence
9.5.2.12. Saudi Arabia market size and forecast, by component
9.5.2.13. Saudi Arabia market size and forecast, by product
9.5.2.14. Saudi Arabia market size and forecast, by connectivity
9.5.2.15. Saudi Arabia market size and forecast, by applications
9.5.2.16. Saudi Arabia market size and forecast, by artificial intelligence
9.5.2.17. South Africa market size and forecast, by component
9.5.2.18. South Africa market size and forecast, by product
9.5.2.19. South Africa market size and forecast, by connectivity
9.5.2.20. South Africa market size and forecast, by applications
9.5.2.21. South Africa market size and forecast, by artificial intelligence
9.5.2.22. Rest of Lamea market size and forecast, by component
9.5.2.23. Rest of Lamea market size and forecast, by product
9.5.2.24. Rest of Lamea market size and forecast, by connectivity
9.5.2.25. Rest of Lamea market size and forecast, by applications
9.5.2.26. Rest of Lamea market size and forecast, by artificial intelligence
9.5.3. LAMEA market size and forecast, by component
9.5.4. LAMEA market size and forecast, by product
9.5.5. LAMEA market size and forecast, by connectivity
9.5.6. LAMEA market size and forecast, by applications
9.5.7. LAMEA market size and forecast, by artificial intelligence
CHAPTER 10: COMPANY PROFILES
10.1. Alphabet Inc. (Google Inc.)
10.1.1. Company overview
10.1.2. Company snapshot
10.1.3. Operating business segments
10.1.4. Product portfolio
10.1.5. Business performance
10.2. Enlitic Inc.
10.2.1. Company overview
10.2.2. Company snapshot
10.2.3. Product portfolio
10.2.4. Key strategic moves and developments
10.3. General Vision
10.3.1. Company overview
10.3.2. Company snapshot
10.3.3. Operating business segments
10.3.4. Product portfolio
10.3.5. Key strategic moves and developments
10.4. Intel Corporation
10.4.1. Company overview
10.4.2. Company snapshot
10.4.3. Operating business segments
10.4.4. Product portfolio
10.4.5. Business performance
10.4.6. Key strategic moves and developments
10.5. IBM Corporation
10.5.1. Company overview
10.5.2. Company snapshot
10.5.3. Operating business segments
10.5.4. Product portfolio
10.5.5. Business performance
10.5.6. Key strategic moves and developments
10.6. Microsoft Corporation
10.6.1. Company overview
10.6.2. Company snapshot
10.6.3. Operating business segments
10.6.4. Product portfolio
10.6.5. Business performance
10.6.6. Key strategic moves and developments
10.7. Nvidia Corporation
10.7.1. Company overview
10.7.2. Company snapshot
10.7.3. Operating business segments
10.7.4. Product portfolio
10.7.5. Business performance
10.7.6. Key strategic moves and developments
10.8. Next IT Corp.
10.8.1. Company overview
10.8.2. Company snapshot
10.8.3. Operating business segments
10.8.4. Product portfolio
10.9. Welltok Inc.
10.9.1. Company overview
10.9.2. Company snapshot
10.9.3. Operating business segments
10.9.4. Product portfolio
10.9.5. Key strategic moves and developments
10.10. GE healthcare
10.10.1. Company overview
10.10.2. Company snapshot
10.10.3. Operating business segments
10.10.5. Key strategic moves and development
TABLE 01. GLOBAL SMART HOSPITALS MARKET, BY COMPONENT, 2016-2025 ($MILLION)
TABLE 02. SMART HOSPITALS MARKET FOR HARDWARE, BY REGION, 2016-2025 ($MILLION)
TABLE 03. SMART HOSPITALS MARKET FOR SYSTEMS & SOFTWARE, BY REGION, 2016-2025 ($MILLION)
TABLE 04. SMART HOSPITALS MARKET FOR SERVICES, BY REGION, 2016-2025 ($MILLION)
TABLE 05. GLOBAL SMART HOSPITALS MARKET, BY PRODUCT, 2016-2025 ($MILLION)
TABLE 06. SMART HOSPITALS MARKET FOR SMART PILLS, BY REGION, 2016-2025 ($MILLION)
TABLE 07. SMART HOSPITALS MARKET FOR M HEALTH, BY REGION, 2016-2025 ($MILLION)
TABLE 08. SMART HOSPITALS MARKET FOR TELEMEDICINE, BY REGION, 2016-2025 ($MILLION)
TABLE 09. SMART HOSPITALS MARKET FOR ELECTRONIC HEALTH RECORDS, BY REGION, 2016-2025 ($MILLION)
TABLE 10. GLOBAL SMART HOSPITALS MARKET, BY CONNECTIVITY, 2016-2025 ($MILLION)
TABLE 11. SMART HOSPITALS MARKET FOR WIRED, BY REGION, 2016-2025 ($MILLION)
TABLE 12. INNOVATIVE WIRELESS MEDICAL DEVICES
TABLE 13. SMART HOSPITALS MARKET FOR WIRELESS, BY REGION, 2016-2025 ($MILLION)
TABLE 14. GLOBAL SMART HOSPITALS MARKET, BY APPLICATIONS, 2016-2025 ($MILLION)
TABLE 15. SMART HOSPITALS MARKET FOR REMOTE MEDICINE MANAGEMENT, BY REGION, 2016-2025 ($MILLION)
TABLE 16. SMART HOSPITALS MARKET FOR MEDICAL ASSISTANCE, BY REGION, 2016-2025 ($MILLION)
TABLE 17. SMART HOSPITALS MARKET FOR MEDICAL CONNECTED IMAGING, BY REGION, 2016-2025 ($MILLION)
TABLE 18. SMART HOSPITALS MARKET FOR ELECTRONIC HEALTH RECORD & CLINICAL WORKFLOW, BY REGION, 2016-2025 ($MILLION)
TABLE 19. SMART HOSPITALS MARKET FOR OTHERS, BY REGION, 2016-2025 ($MILLION)
TABLE 20. ARTIFICIAL INTELLIGENCE IN SMART HOSPITAL MARKET. BY OFFERING 2016-2025 ($MILLION)
TABLE 21. ARTIFICIAL INTELLIGENCE IN SMART HOSPITAL MARKET, BY TECHNOLOGY 2016-2025 ($MILLION)
TABLE 22. ARTIFICIAL INTELLIGENCE IN SMART HOSPITAL MARKET, BY APPLICATION 2016-2025 ($MILLION)
TABLE 23. SMART HOSPITALS MARKET, BY REGION, 2016-2025 ($MILLION)
TABLE 24. NORTH AMERICA SMART HOSPITALS MARKET, BY COUNTRY, 2016-2025 ($MILLION)
TABLE 25. U.S. SMART HOSPITALS MARKET, BY COMPONENT, 2016-2025 ($MILLION)
TABLE 26. U.S. SMART HOSPITALS MARKET, BY PRODUCT, 2016-2025 ($MILLION)
TABLE 27. U.S. SMART HOSPITALS MARKET, BY CONNECTIVITY, 2016-2025 ($MILLION)
TABLE 28. U.S. SMART HOSPITALS MARKET, BY APPLICATIONS, 2016-2025 ($MILLION)
TABLE 29. U.S. SMART HOSPITALS MARKET, BY ARTIFICIAL INTELLIGENCE, 2016-2025 ($MILLION)
TABLE 30. CANADA SMART HOSPITALS MARKET, BY COMPONENT, 2016-2025 ($MILLION)
TABLE 31. CANADA SMART HOSPITALS MARKET, BY PRODUCT, 2016-2025 ($MILLION)
TABLE 32. CANADA SMART HOSPITALS MARKET, BY CONNECTIVITY, 2016-2025 ($MILLION)
TABLE 33. CANADA SMART HOSPITALS MARKET, BY APPLICATIONS, 2016-2025 ($MILLION)
TABLE 34. CANADA SMART HOSPITALS MARKET, BY ARTIFICIAL INTELLIGENCE, 2016-2025 ($MILLION)
TABLE 35. MEXICO SMART HOSPITALS MARKET, BY COMPONENT, 2016-2025 ($MILLION)
TABLE 36. MEXICO SMART HOSPITALS MARKET, BY PRODUCT, 2016-2025 ($MILLION)
TABLE 37. MEXICO SMART HOSPITALS MARKET, BY CONNECTIVITY, 2016-2025 ($MILLION)
TABLE 38. MEXICO SMART HOSPITALS MARKET, BY APPLICATIONS, 2016-2025 ($MILLION)
TABLE 39. MEXICO SMART HOSPITALS MARKET, BY ARTIFICIAL INTELLIGENCE, 2016-2025 ($MILLION)
TABLE 40. NORTH AMERICA SMART HOSPITALS MARKET, BY COMPONENT, 2016-2025 ($MILLION)
TABLE 41. NORTH AMERICA SMART HOSPITALS MARKET, BY PRODUCT, 2016-2025 ($MILLION)
TABLE 42. NORTH AMERICA SMART HOSPITALS MARKET, BY CONNECTIVITY, 2016-2025 ($MILLION)
TABLE 43. NORTH AMERICA SMART HOSPITALS MARKET, BY APPLICATIONS, 2016-2025 ($MILLION)
TABLE 44. NORTH AMERICA SMART HOSPITALS MARKET, BY ARTIFICIAL INTELLIGENCE, 2016-2025 ($MILLION)
TABLE 45. EUROPE SMART HOSPITALS MARKET, BY COUNTRY, 2016-2025 ($MILLION)
TABLE 46. UK SMART HOSPITALS MARKET, BY COMPONENT, 2016-2025 ($MILLION)
TABLE 47. UK SMART HOSPITALS MARKET, BY PRODUCT, 2016-2025 ($MILLION)
TABLE 48. UK SMART HOSPITALS MARKET, BY CONNECTIVITY, 2016-2025 ($MILLION)
TABLE 49. UK SMART HOSPITALS MARKET, BY APPLICATIONS, 2016-2025 ($MILLION)
TABLE 50. UK SMART HOSPITALS MARKET, BY ARTIFICIAL INTELLIGENCE, 2016-2025 ($MILLION)
TABLE 51. FRANCE SMART HOSPITALS MARKET, BY COMPONENT, 2016-2025 ($MILLION)
TABLE 52. FRANCE SMART HOSPITALS MARKET, BY PRODUCT, 2016-2025 ($MILLION)
TABLE 53. FRANCE SMART HOSPITALS MARKET, BY CONNECTIVITY, 2016-2025 ($MILLION)
TABLE 54. FRANCE SMART HOSPITALS MARKET, BY APPLICATIONS, 2016-2025 ($MILLION)
TABLE 55. FRANCE SMART HOSPITALS MARKET, BY ARTIFICIAL INTELLIGENCE, 2016-2025 ($MILLION)
TABLE 56. FRANCE SMART HOSPITALS MARKET, BY COMPONENT, 2016-2025 ($MILLION)
TABLE 57. FRANCE SMART HOSPITALS MARKET, BY PRODUCT, 2016-2025 ($MILLION)
TABLE 58. FRANCE SMART HOSPITALS MARKET, BY CONNECTIVITY, 2016-2025 ($MILLION)
TABLE 59. FRANCE SMART HOSPITALS MARKET, BY APPLICATIONS, 2016-2025 ($MILLION)
TABLE 60. FRANCE SMART HOSPITALS MARKET, BY ARTIFICIAL INTELLIGENCE, 2016-2025 ($MILLION)
TABLE 61. GERMANY SMART HOSPITALS MARKET, BY COMPONENT, 2016-2025 ($MILLION)
TABLE 62. GERMANY SMART HOSPITALS MARKET, BY PRODUCT, 2016-2025 ($MILLION)
TABLE 63. GERMANY SMART HOSPITALS MARKET, BY CONNECTIVITY, 2016-2025 ($MILLION)
TABLE 64. GERMANY SMART HOSPITALS MARKET, BY APPLICATIONS, 2016-2025 ($MILLION)
TABLE 65. GERMANY SMART HOSPITALS MARKET, BY ARTIFICIAL INTELLIGENCE, 2016-2025 ($MILLION)
TABLE 66. SPAIN SMART HOSPITALS MARKET, BY COMPONENT, 2016-2025 ($MILLION)
TABLE 67. SPAIN SMART HOSPITALS MARKET, BY PRODUCT, 2016-2025 ($MILLION)
TABLE 68. SPAIN SMART HOSPITALS MARKET, BY CONNECTIVITY, 2016-2025 ($MILLION)
TABLE 69. SPAIN SMART HOSPITALS MARKET, BY APPLICATIONS, 2016-2025 ($MILLION)
TABLE 70. SPAIN SMART HOSPITALS MARKET, BY ARTIFICIAL INTELLIGENCE, 2016-2025 ($MILLION)
TABLE 71. ITALY SMART HOSPITALS MARKET, BY COMPONENT, 2016-2025 ($MILLION)
TABLE 72. ITALY SMART HOSPITALS MARKET, BY PRODUCT, 2016-2025 ($MILLION)
TABLE 73. ITALY SMART HOSPITALS MARKET, BY CONNECTIVITY, 2016-2025 ($MILLION)
TABLE 74. ITALY SMART HOSPITALS MARKET, BY APPLICATIONS, 2016-2025 ($MILLION)
TABLE 75. ITALY SMART HOSPITALS MARKET, BY ARTIFICIAL INTELLIGENCE, 2016-2025 ($MILLION)
TABLE 76. REST OF EUROPE SMART HOSPITALS MARKET, BY COMPONENT, 2016-2025 ($MILLION)
TABLE 77. REST OF EUROPE SMART HOSPITALS MARKET, BY PRODUCT, 2016-2025 ($MILLION)
TABLE 78. REST OF EUROPE SMART HOSPITALS MARKET, BY CONNECTIVITY, 2016-2025 ($MILLION)
TABLE 79. REST OF EUROPE SMART HOSPITALS MARKET, BY APPLICATIONS, 2016-2025 ($MILLION)
TABLE 80. REST OF EUROPE SMART HOSPITALS MARKET, BY ARTIFICIAL INTELLIGENCE, 2016-2025 ($MILLION)
TABLE 81. EUROPE SMART HOSPITALS MARKET, BY COMPONENT, 2016-2025 ($MILLION)
TABLE 82. EUROPE SMART HOSPITALS MARKET, BY PRODUCT, 2016-2025 ($MILLION)
TABLE 83. EUROPE SMART HOSPITALS MARKET, BY CONNECTIVITY, 2016-2025 ($MILLION)
TABLE 84. EUROPE SMART HOSPITALS MARKET, BY APPLICATIONS, 2016-2025 ($MILLION)
TABLE 85. EUROPE SMART HOSPITALS MARKET, BY ARTIFICIAL INTELLIGENCE, 2016-2025 ($MILLION)
TABLE 86. ASIA-PACIFIC SMART HOSPITALS MARKET, BY COUNTRY, 2016-2025 ($MILLION)
TABLE 87. JAPAN SMART HOSPITALS MARKET, BY COMPONENT, 2016-2025 ($MILLION)
TABLE 88. JAPAN SMART HOSPITALS MARKET, BY PRODUCT, 2016-2025 ($MILLION)
TABLE 89. JAPAN SMART HOSPITALS MARKET, BY CONNECTIVITY, 2016-2025 ($MILLION)
TABLE 90. JAPAN SMART HOSPITALS MARKET, BY APPLICATIONS, 2016-2025 ($MILLION)
TABLE 91. JAPAN SMART HOSPITALS MARKET, BY ARTIFICIAL INTELLIGENCE, 2016-2025 ($MILLION)
TABLE 92. CHINA SMART HOSPITALS MARKET, BY COMPONENT, 2016-2025 ($MILLION)
TABLE 93. CHINA SMART HOSPITALS MARKET, BY PRODUCT, 2016-2025 ($MILLION)
TABLE 94. CHINA SMART HOSPITALS MARKET, BY CONNECTIVITY, 2016-2025 ($MILLION)
TABLE 95. CHINA SMART HOSPITALS MARKET, BY APPLICATIONS, 2016-2025 ($MILLION)
TABLE 96. CHINA SMART HOSPITALS MARKET, BY ARTIFICIAL INTELLIGENCE, 2016-2025 ($MILLION)
TABLE 97. INDIA SMART HOSPITALS MARKET, BY COMPONENT, 2016-2025 ($MILLION)
TABLE 98. INDIA SMART HOSPITALS MARKET, BY PRODUCT, 2016-2025 ($MILLION)
TABLE 99. INDIA SMART HOSPITALS MARKET, BY CONNECTIVITY, 2016-2025 ($MILLION)
TABLE 100. INDIA SMART HOSPITALS MARKET, BY APPLICATIONS, 2016-2025 ($MILLION)
TABLE 101. INDIA SMART HOSPITALS MARKET, BY ARTIFICIAL INTELLIGENCE, 2016-2025 ($MILLION)
TABLE 102. AUSTRALIA SMART HOSPITALS MARKET, BY COMPONENT, 2016-2025 ($MILLION)
TABLE 103. AUSTRALIA SMART HOSPITALS MARKET, BY PRODUCT, 2016-2025 ($MILLION)
TABLE 104. AUSTRALIA SMART HOSPITALS MARKET, BY CONNECTIVITY, 2016-2025 ($MILLION)
TABLE 105. AUSTRALIA SMART HOSPITALS MARKET, BY APPLICATIONS, 2016-2025 ($MILLION)
TABLE 106. AUSTRALIA SMART HOSPITALS MARKET, BY ARTIFICIAL INTELLIGENCE, 2016-2025 ($MILLION)
TABLE 107. KOREA SMART HOSPITALS MARKET, BY COMPONENT, 2016-2025 ($MILLION)
TABLE 108. KOREA SMART HOSPITALS MARKET, BY PRODUCT, 2016-2025 ($MILLION)
TABLE 109. KOREA SMART HOSPITALS MARKET, BY CONNECTIVITY, 2016-2025 ($MILLION)
TABLE 110. KOREA SMART HOSPITALS MARKET, BY APPLICATIONS, 2016-2025 ($MILLION)
TABLE 111. KOREA SMART HOSPITALS MARKET, BY ARTIFICIAL INTELLIGENCE, 2016-2025 ($MILLION)
TABLE 112. REST OF ASIA-PACIFIC SMART HOSPITALS MARKET, BY COMPONENT, 2016-2025 ($MILLION)
TABLE 113. REST OF ASIA-PACIFIC SMART HOSPITALS MARKET, BY PRODUCT, 2016-2025 ($MILLION)
TABLE 114. REST OF ASIA-PACIFIC SMART HOSPITALS MARKET, BY CONNECTIVITY, 2016-2025 ($MILLION)
TABLE 115. REST OF ASIA-PACIFIC SMART HOSPITALS MARKET, BY APPLICATIONS, 2016-2025 ($MILLION)
TABLE 116. REST OF ASIA-PACIFIC SMART HOSPITALS MARKET, BY ARTIFICIAL INTELLIGENCE, 2016-2025 ($MILLION)
TABLE 117. ASIA-PACIFIC SMART HOSPITALS MARKET, BY COMPONENT, 2016-2025 ($MILLION)
TABLE 118. ASIA-PACIFIC SMART HOSPITALS MARKET, BY PRODUCT, 2016-2025 ($MILLION)
TABLE 119. ASIA-PACIFIC SMART HOSPITALS MARKET, BY CONNECTIVITY, 2016-2025 ($MILLION)
TABLE 120. ASIA-PACIFIC SMART HOSPITALS MARKET, BY APPLICATIONS, 2016-2025 ($MILLION)
TABLE 121. ASIA-PACIFIC SMART HOSPITALS MARKET, BY ARTIFICIAL INTELLIGENCE, 2016-2025 ($MILLION)
TABLE 122. LAMEA SMART HOSPITALS MARKET, BY COUNTRY, 2016-2025 ($MILLION)
TABLE 123. BRAZIL SMART HOSPITALS MARKET, BY COMPONENT, 2016-2025 ($MILLION)
TABLE 124. BRAZIL SMART HOSPITALS MARKET, BY PRODUCT, 2016-2025 ($MILLION)
TABLE 125. BRAZIL SMART HOSPITALS MARKET, BY CONNECTIVITY, 2016-2025 ($MILLION)
TABLE 126. BRAZIL SMART HOSPITALS MARKET, BY APPLICATIONS, 2016-2025 ($MILLION)
TABLE 127. BRAZIL SMART HOSPITALS MARKET, BY ARTIFICIAL INTELLIGENCE, 2016-2025 ($MILLION)
TABLE 128. TURKEY SMART HOSPITALS MARKET, BY COMPONENT, 2016-2025 ($MILLION)
TABLE 129. TURKEY SMART HOSPITALS MARKET, BY PRODUCT, 2016-2025 ($MILLION)
TABLE 130. TURKEY SMART HOSPITALS MARKET, BY CONNECTIVITY, 2016-2025 ($MILLION)
TABLE 131. TURKEY SMART HOSPITALS MARKET, BY APPLICATIONS, 2016-2025 ($MILLION)
TABLE 132. TURKEY SMART HOSPITALS MARKET, BY ARTIFICIAL INTELLIGENCE, 2016-2025 ($MILLION)
TABLE 133. SAUDI ARABIA SMART HOSPITALS MARKET, BY COMPONENT, 2016-2025 ($MILLION)
TABLE 134. SAUDI ARABIA SMART HOSPITALS MARKET, BY PRODUCT, 2016-2025 ($MILLION)
TABLE 135. SAUDI ARABIA SMART HOSPITALS MARKET, BY CONNECTIVITY, 2016-2025 ($MILLION)
TABLE 136. SAUDI ARABIA SMART HOSPITALS MARKET, BY APPLICATIONS, 2016-2025 ($MILLION)
TABLE 137. SAUDI ARABIA SMART HOSPITALS MARKET, BY ARTIFICIAL INTELLIGENCE, 2016-2025 ($MILLION)
TABLE 138. SOUTH AFRICA SMART HOSPITALS MARKET, BY COMPONENT, 2016-2025 ($MILLION)
TABLE 139. SOUTH AFRICA SMART HOSPITALS MARKET, BY PRODUCT, 2016-2025 ($MILLION)
TABLE 140. SOUTH AFRICA SMART HOSPITALS MARKET, BY CONNECTIVITY, 2016-2025 ($MILLION)
TABLE 141. SOUTH AFRICA SMART HOSPITALS MARKET, BY APPLICATIONS, 2016-2025 ($MILLION)
TABLE 142. SOUTH AFRICA SMART HOSPITALS MARKET, BY ARTIFICIAL INTELLIGENCE, 2016-2025 ($MILLION)
TABLE 143. REST OF LAMEA SMART HOSPITALS MARKET, BY COMPONENT, 2016-2025 ($MILLION)
TABLE 144. REST OF LAMEA SMART HOSPITALS MARKET, BY PRODUCT, 2016-2025 ($MILLION)
TABLE 145. REST OF LAMEA SMART HOSPITALS MARKET, BY CONNECTIVITY, 2016-2025 ($MILLION)
TABLE 146. REST OF LAMEA SMART HOSPITALS MARKET, BY APPLICATIONS, 2016-2025 ($MILLION)
TABLE 147. REST OF LAMEA SMART HOSPITALS MARKET, BY ARTIFICIAL INTELLIGENCE, 2016-2025 ($MILLION)
TABLE 148. LAMEA SMART HOSPITALS MARKET, BY COMPONENT, 2016-2025 ($MILLION)
TABLE 149. LAMEA SMART HOSPITALS MARKET, BY PRODUCT, 2016-2025 ($MILLION)
TABLE 150. LAMEA SMART HOSPITALS MARKET, BY CONNECTIVITY, 2016-2025 ($MILLION)
TABLE 151. LAMEA SMART HOSPITALS MARKET, BY APPLICATIONS, 2016-2025 ($MILLION)
TABLE 152. LAMEA SMART HOSPITALS MARKET, BY ARTIFICIAL INTELLIGENCE, 2016-2025 ($MILLION)
TABLE 153. ALPHABET INC.: COMPANY SNAPSHOT
TABLE 154. ALPHABET INC.: OPERATING SEGMENTS
TABLE 155. ALPHABET INC.: PRODUCT PORTFOLIO
TABLE 156. ENLITIC: COMPANY SNAPSHOT
TABLE 157. ENLITIC: PRODUCT PORTFOLIO
TABLE 158. GENERAL VISION: COMPANY SNAPSHOT
TABLE 159. GENERAL VISION: THREE TECHNOLOGIES
TABLE 160. GENERAL VISION: PRODUCT PORTFOLIO
TABLE 161. INTEL CORPORATION: COMPANY SNAPSHOT
TABLE 162. INTEL CORPORATION: OPERATING SEGMENTS
TABLE 163. INTEL CORPORATION: PRODUCT PORTFOLIO
TABLE 164. IBM CORPORATION: COMPANY SNAPSHOT
TABLE 165. IBM: OPERATING SEGMENTS
TABLE 166. IBM: PRODUCT PORTFOLIO
TABLE 167. MICROSOFT CORPORATION: COMPANY SNAPSHOT
TABLE 168. MICROSOFT CORPORATION: OPERATING SEGMENTS
TABLE 169. NVIDIA: COMPANY SNAPSHOT
TABLE 170. NVIDIA: OPERATING SEGMENTS
TABLE 171. NVIDIA: PRODUCT PORTFOLIO
TABLE 172. NEXT IT: COMPANY SNAPSHOT
TABLE 173. NEXT IT: PRODUCT CATEGORIES
TABLE 174. NEXT IT: PRODUCT PORTFOLIO
TABLE 175. WELLTOK: COMPANY SNAPSHOT
TABLE 176. WELLTOK: PRODUCT CATEGORIES
TABLE 177. WELLTOK: PRODUCT PORTFOLIO
TABLE 178. GE: COMPANY SNAPSHOT
TABLE 179. GE: OPERATING SEGMENTS FIGURE 01. GLOBAL SMART HOSPITALS MARKET SEGMENTATION
FIGURE 02. TOP INVESTMENT POCKETS
FIGURE 03. HIGH BARGAINING POWER OF BUYERS
FIGURE 04. MODERATE BARGAINING POWER OF SUPPLIERS
FIGURE 05. MODERATE THREAT OF NEW ENTRANTS
FIGURE 06. LOW THREAT OF SUBSTITUTION
FIGURE 07. HIGH COMPETITIVE RIVALRY
FIGURE 08. GLOBAL SMART HOSPITALS MARKET: RESTRAINTS, DRIVERS, AND OPPORTUNITIES
FIGURE 09. SMART HOSPITALS MARKET, BY COMPONENT
FIGURE 10. COMPARATIVE SHARE ANALYSIS OF HARDWARE MARKET, BY COUNTRY, 2016 & 2025 (%)
FIGURE 11. COMPARATIVE SHARE ANALYSIS OF SYSTEMS AND SOFTWARE MARKET, BY COUNTRY, 2016 & 2025 (%)
FIGURE 12. COMPARATIVE SHARE ANALYSIS OF SERVICES MARKET, BY COUNTRY, 2016 & 2025 (%)
FIGURE 13. SMART HOSPITALS MARKET, BY PRODUCT
FIGURE 14. COMPARATIVE SHARE ANALYSIS OF SMART PILLS MARKET, BY COUNTRY, 2016 & 2025 (%)
FIGURE 15. COMPARATIVE SHARE ANALYSIS OF M HEALTHMARKET, BY COUNTRY, 2016 & 2025 (%)
FIGURE 16. COMPARATIVE SHARE ANALYSIS OF TELEMEDICINE MARKET, BY COUNTRY, 2016 & 2025 (%)
FIGURE 17. COMPARATIVE SHARE ANALYSIS OF ELECTRONIC HEALTH RECORDS MARKET, BY COUNTRY, 2016 & 2025 (%)
FIGURE 18. SMART HOSPITALS MARKET, BY CONNECTIVITY
FIGURE 19. COMPARATIVE SHARE ANALYSIS OF WIRED MARKET, BY COUNTRY, 2016 & 2025 (%)
FIGURE 20. COMPARATIVE SHARE ANALYSIS OF WIRELESS MARKET, BY COUNTRY, 2016 & 2025 (%)
FIGURE 21. SMART HOSPITALS MARKET FOR WI-FI
FIGURE 22. SMART HOSPITALS MARKET FOR RFID (RADIO-FREQUENCY IDENTIFICATION)
FIGURE 23. SMART HOSPITALS MARKET FOR BLUETOOTH
FIGURE 24. SMART HOSPITALS MARKET FOR OTHERS
FIGURE 25. SMART HOSPITALS MARKET, BY APPLICATIONS
FIGURE 26. COMPARATIVE SHARE ANALYSIS OF REMOTE MEDICINE MANAGEMENT MARKET, BY COUNTRY, 2016 & 2025 (%)
FIGURE 27. COMPARATIVE SHARE ANALYSIS OF MEDICAL ASSISTANCE MARKET, BY COUNTRY, 2016 & 2025 (%)
FIGURE 28. COMPARATIVE SHARE ANALYSIS OF MEDICAL CONNECTED IMAGING MARKET, BY COUNTRY, 2016 & 2025 (%)
FIGURE 29. COMPARATIVE SHARE ANALYSIS OF ELECTRONIC HEALTH RECORD & CLINICAL WORKFLOW MARKET, BY COUNTRY, 2016 & 2025 (%)
FIGURE 30. COMPARATIVE SHARE ANALYSIS OF OTHERS MARKET, BY COUNTRY, 2016 & 2025 (%)
FIGURE 31. ARTIFICIAL INTELLIGENCE IN SMART HOSPITAL MARKET
FIGURE 32. ARTIFICIAL INTELLIGENCE IN SMART HOSPITAL MARKET, FOR HARDWARE
FIGURE 33. ARTIFICIAL INTELLIGENCE IN SMART HOSPITAL MARKET, FOR SOFTWARE
FIGURE 34. ARTIFICIAL INTELLIGENCE IN SMART HOSPITAL MARKET, FOR SERVICE
FIGURE 35. ARTIFICIAL INTELLIGENCE IN SMART HOSPITAL MARKET, FOR DEEP LEARNING
FIGURE 36. ARTIFICIAL INTELLIGENCE IN SMART HOSPITAL MARKET, FOR QUERYING METHOD
FIGURE 37. ARTIFICIAL INTELLIGENCE IN SMART HOSPITAL MARKET, FOR NATURAL LANGUAGE PROCESSING
FIGURE 38. ARTIFICIAL INTELLIGENCE IN SMART HOSPITAL MARKET, FOR CONTEXT AWARE PROCESSING
FIGURE 39. ARTIFICIAL INTELLIGENCE IN SMART HOSPITAL MARKET, FOR ROBOT-ASSISTED SURGERY
FIGURE 40. ARTIFICIAL INTELLIGENCE IN SMART HOSPITAL MARKET, FOR VIRTUAL NURSING ASSISTANT
FIGURE 41. ARTIFICIAL INTELLIGENCE IN SMART HOSPITAL MARKET, FOR ADMINISTRATIVE WORKFLOW ASSISTANCE
FIGURE 42. ARTIFICIAL INTELLIGENCE IN SMART HOSPITAL MARKET, FOR FRAUD DETECTION
FIGURE 43. ARTIFICIAL INTELLIGENCE IN SMART HOSPITAL MARKET, FOR DOSAGE ERROR REDUCTION
FIGURE 44. ARTIFICIAL INTELLIGENCE IN SMART HOSPITAL MARKET, FOR CLINICAL TRIAL PARTICIPANT IDENTIFIER
FIGURE 45. ARTIFICIAL INTELLIGENCE IN SMART HOSPITAL MARKET, FOR PRELIMINARY DIAGNOSIS
FIGURE 46. ARTIFICIAL INTELLIGENCE IN SMART HOSPITAL MARKET, FOR OTHERS
FIGURE 47. ALPHABET INC.: REVENUE, 20152017 ($MILLION)
FIGURE 48. ALPHABET INC.: REVENUE SHARE BY SEGMENT, 2017 (%)
FIGURE 49. ALPHABET INC.: REVENUE SHARE BY GEOGRAPHY, 2017 (%)
FIGURE 50. INTEL CORPORATION: REVENUE, 2015-2017 ($MILLION)
FIGURE 51. INTEL CORPORATION: REVENUE SHARE BY SEGMENT, 2017 (%)
FIGURE 52. INTEL CORPORATION: REVENUE SHARE BY GEOGRAPHY, 2017 (%)
FIGURE 53. IBM: REVENUE, 2014-2016 ($MILLION)
FIGURE 54. IBM: REVENUE SHARE BY SEGMENT, 2016 (%)
FIGURE 55. IBM: REVENUE SHARE BY GEOGRAPHY, 2016 (%)
FIGURE 56. MICROSOFT CORPORATION: REVENUE, 2015-2017 ($MILLION)
FIGURE 57. MICROSOFT CORPORATION: REVENUE SHARE BY SEGMENT, 2017 (%)
FIGURE 58. MICROSOFT CORPORATION: REVENUE SHARE BY GEOGRAPHY, 2017 (%)
FIGURE 59. NVIDIA: REVENUE, 2016-2018 ($MILLION)
FIGURE 60. NVIDIA: REVENUE SHARE BY SEGMENT, 2018 (%)
FIGURE 61. NVIDIA: REVENUE SHARE BY GEOGRAPHY, 2018 (%
SELECT A FORMAT
Added to Cart
Electronic (PDF)

$5370

This license allows only one user to access the PDF.
Electronic (PDF)

$6450

This license allows 1 - 5 user to access the PDF, license is suitable for small groups of 5 users working together
Electronic (PDF)

$8995

This license allows users/teams in a same Enterprise to use this report, various departments within an enterpise can use this report
Add to Cart
Buy Now (15% Discount)

OUR CUSTOMER

Seventh Sense AI