0
U.S. (TOLL FREE)
+1 (315) 215-3225
Automative

0
U.S. (TOLL FREE)
+1 (315) 215-3225
Windows and Doors Market By Product (Doors, Windows), By Material (Wood, Metal, Plastic), By Application (Swinging, Sliding, Folding, Revolving and Others), By End User (Residential, Non-residential): Global Opportunity Analysis and Industry Forecast, 2023-2032
Published Date: April 2023
|
Report Code: ALLI-Auto-2S119
Home | Market Reports | Business & Industrial| Construction & Maintenance| Building Materials & Supplies
Windows and Doors Market by Product Type Windows and Doors Material Type Wood Metal and Plastic Mechanism Swinging Sliding Folding Revolving and End User Residential and Non residential Opportunity Analysis and Industry Forecast 2014 2022
BUY CHAPTERS

Windows and Doors Market By Product (Doors, Windows), By Material (Wood, Metal, Plastic), By Application (Swinging, Sliding, Folding, Revolving and Others), By End User (Residential, Non-residential): Global Opportunity Analysis and Industry Forecast, 2023-2032

Code: ALLI-Auto-2S119
Report
April 2023
Pages:265
Allied Market Research
Buy Now with 15% Discount
DESCRIPTION
TABLE OF CONTENT
TABLES & FIGURES

Windows and Doors Market Size

According to a new report published by , titled, “Windows and Doors Market," The windows and doors market was valued at $208.1 billion in 2022, and is estimated to reach $356.7 billion by 2032, growing at a CAGR of 5.5% from 2023 to 2032.

Windows and Doors Market

Windows and Doors Market

Windows and doors are an inseparable part of any residential and non-residential building. Windows are crucial for regulating the movement of air to and from the building. It also regulates the view and ambient light. Doors are essential for regulating the movements of people from one part of the building to the other, including the entrance of the building.
Key factors driving the growth of the windows and doors market include increase in number of households, surge in demand for commercial and institutional buildings, and increase in building renovation and improvement activities. Surge in global population, rapid urbanization, and increase in immigration are a few of the major reasons responsible for increase in the number of households, Moreover, in the last 50 years, single-person households have increased especially in the countries such as the U.S., Canada, Japan, countries in Europe, and other countries that witnessed early industrialization; thereby, driving the market growth. Moreover, according to the United Nations, the world population was around 8 billion at the beginning of 2023 and is expected to reach 9.5 billion in 2050. Thus, countries such as India, China, and Vietnam are witnessing significant expansion of the real estate sector. The Chinese real estate sector is growing at a considerable pace; however, the recent economic downturn had a negative impact on the real estate sector growth. Contrarily, the long-term residential sector outlook remains positive. An increase in the number of residential buildings is anticipated to drive the demand for doors and windows, as they are an integral part of any building.
The technological advancements in windows and doors products offer growth opportunities to the key players in the market. Safety and security are the major concerns in the residential and commercial sectors. According to the Federal Bureau of Investigation (FBI), on average, intrusion takes place every 26 seconds in the U.S., and the loss from break-ins is believed to be around $2,800. This has led to the deployment of systems such as voice-activated devices, video intercom systems, smart outlets, and other antitheft systems in homes. In addition, demand for automatic doors is increasing due to concerns over the spread of viruses, bacteria, and other diseases that can occur by touching doorknobs and handled by many people. The newly released International Building Code (IBC) for 2021 has mandated the installation of automatic entrance doors in public buildings. Furthermore, the participation of major players such as ASSA ABLOY Group, Nabtesco Corporation, and Stanley Black & Decker, Inc. has increased due to technological advancements. For instance, in September 2019, Stanley Access Technologies launched the new DuraFit Telescoping Automatic Door. It is designed for applications in high-traffic areas, such as hospitals, hotels, and retail centers. The product features a bi-part, six-panel telescope and can be installed in tight spaces with 6 ft. to 9 ft. openings. 
The global windows and doors market is segmented into product type, material, application, end user, and region. By product type, the windows and doors market is bifurcated into doors and windows. On the basis of material, the market is divided into wood, metal, and plastic. Depending on application, it is categorized into swinging, sliding, folding, and revolving & others. On the basis of end user, the market is categorized into residential, and non-residential. Region wise, it is analyzed across North America (U.S., Canada, and Mexico), Europe (Germany, France, Italy, UK, Spain, and rest of Europe), Asia-Pacific (China, India, Japan, South Korea, Australia, and rest of Asia-Pacific), and LAMEA (Latin America, Middle East, and Africa).
The key players profiled in the study include Marvin, YKK Corporation, Sanwa Holdings Corporation (Horton Automatics Inc.), Cornerstone Building Brands, Inc. (Atrium Corporation), MI Windows and Doors, LLC., Andersen Corporation, Pella Corporation, JELD-WEN Holding, Inc., LIXIL Corporation, and DCM Shriram Ltd. (Fenesta Building System). Major players in order to remain competitive adopted product launch, and acquisition as their developmental strategies. Moreover, countries across the world are building windows and doors. For instance, in January 2022, Anderson Corporation launched the new 400 series window by adding a contemporary profile option. The feature is an updated contemporary stop, grille profile and hardware design and it is available for 400 casements, awning, and picture windows.
Key Market Insights
By product, the doors segment was the highest revenue contributor to the market and is estimated to reach $2,16,303.4 million by 2032, with a CAGR of 5.3%.
By material, the metal segment dominated the global market. However, the plastic segment is expected to be the fastest-growing segment with a CAGR of 6.4% during the forecast period.
Based on application, the swinging segment was the highest revenue contributor to the market, which is expected to grow at a CAGR of 5.2% during the forecast period.
By end user, the residential segment dominated the global market. However, the non-residential segment is expected to be the fastest-growing segment with a CAGR of 5.8% during the forecast period.
Based on region, Asia-Pacific garnered the largest revenue share in 2022, and the same region is anticipated to grow at the highest CAGR of 6.1% during the forecast period

Overview

The global windows and doors market was valued at $2,08,121.6 million in 2022 and is projected to reach $3,56,666.8 million by 2031, registering a CAGR of 5.5% from 2023 to 2031. Windows and doors are indistinguishable components of any building and play an instrumental role in controlling the flow of people, air, light, and view in buildings. Windows and doors are available in various sizes and designs to cater to different needs from residential and nonresidential buildings and to enhance the aesthetics of interior and exterior of the buildings. Moreover, commonly used materials for constructing windows and doors are metal, wood, and plastic.
The growing population across the world, especially in countries of Asia-Pacific such as China, India, Vietnam, and Indonesia is driving the growth of the construction industry, which, in turn, positively impact the growth of the windows and doors market. Moreover, surge in need for renovation and remodeling of old buildings to meet new statutory requirements acts as a key driving force of the global windows and doors market. However, the fluctuating cost of raw materials used for constructing windows and doors restrain the market growth.
Furthermore, due to COVID-19 the windows and doors market witnessed a halt, which led to a small-term decline in the market. However, as the number of COVID-19 cases dropped to almost nil, the market is expected to fully recover by the end of 2023.  
Contrarily, the development of doors and windows that enhance the security of the house or building is anticipated to provide lucrative growth opportunities to the key players in the market.  
The global windows and doors market is segmented into product type, material, application, end user, and region. By product type, the windows and doors market is bifurcated into doors and windows. On the basis of material, the market is divided into wood, metal, and plastic. Depending on application, it is categorized into swinging, sliding, folding, and revolving & others. On the basis of end user, the market is categorised into residential, and non-residential Region wise, it is analyzed across North America (U.S., Canada, and Mexico), Europe (Germany, France, Italy, UK, Spain, and rest of Europe), Asia-Pacific (China, India, Japan, South Korea, Australia, and rest of Asia-Pacific), and LAMEA (Latin America, Middle East, and Africa).
 
Competition Analysis
Competitive analysis and profiles of the major players in the windows and doors is provided in the report. Major companies included in the report include Marvin, YKK Corporation, Sanwa Holdings Corporation (Horton Automatics Inc.), Cornerstone Building Brands, Inc. (Atrium Corporation), MI Windows and Doors, LLC., Andersen Corporation, Pella Corporation, JELD-WEN Holding, Inc., LIXIL Corporation, and DCM Shriram Ltd. (Fenesta Building System).  
 

Key benefits for stakeholders

●The report provides an extensive analysis of the current and emerging windows and doors market trends and dynamics. 
●In-depth market analysis is conducted by constructing market estimations for the key market segments between 2022 and 2032.
●Extensive analysis of the windows and doors market is conducted by following key product positioning and monitoring of the top competitors within the market framework.
●A comprehensive analysis of all regions is provided to determine the prevailing opportunities.
●The global windows and doors market forecast analysis from 2023 to 2032 is included in the report.
●Key market players within the windows and doors market are profiled in this report and their strategies are analyzed thoroughly, which help understand the competitive outlook of the windows and doors industry.
Key Market Segments
○ MI Windows and Doors, LLC

Scope of Windows and Doors Market Report

Report Metric Details
Report Name Windows and Doors Market
Accounted market size in 2022 $ 208.1 in billion
Forecasted market size in 2032 $ 356.7 billion
CAGR 5.5%
Base Year 2022
Forecasted years 2024 - 2032
By Product ● Doors
● Windows
By Application ● Swinging
● Sliding
● Folding
● Revolving and Others
By End User ● Residential
● Non-residential
By Material ● Wood
● Metal
● Plastic
By Region
  • North America (United States, Canada)
  • Europe (Germany, France, UK, Italy, Russia) Rest of Europe
  • Nordic Countries
  • Asia-Pacific (China, Japan, South Korea)
  • Southeast Asia (India, Australia)
  • Rest of Asia
  • Latin America (Mexico, Brazil)
  • Rest of Latin America
  • Middle East & Africa (Turkey, Saudi Arabia, UAE, Rest of MEA)
Forecast units USD million in value
Report coverage Revenue and volume forecast, company share, competitive landscape, growth factors and trends

FAQ for this report

How fast is Windows and Doors Market growing?

Ans: The Windows and Doors Market witnessing a CAGR of 5.5% during the forecast period 2024-2032.

What is the Windows and Doors Market size in 2032?

Ans: The Windows and Doors Market size in 2032 will be $ 356.7 billion.

What are the Application segmentation covered in the Windows and Doors Market report?

Ans: The Applications covered in the Windows and Doors Market report are ● Swinging, ● Sliding, ● Folding, ● Revolving and Others

What are the End User segmentation covered in the Windows and Doors Market report?

Ans: The End users covered in the Windows and Doors Market report are ● Residential, ● Non-residential

CHAPTER 1: INTRODUCTION
1.1. Report description
1.2. Key market segments
1.3. Key benefits to the stakeholders
1.4. Research Methodology
1.4.1. Primary research
1.4.2. Secondary research
1.4.3. Analyst tools and models
CHAPTER 2: EXECUTIVE SUMMARY
2.1. CXO Perspective
CHAPTER 3: MARKET OVERVIEW
3.1. Market definition and scope
3.2. Key findings
3.2.1. Top impacting factors
3.2.2. Top investment pockets
3.3. Porter’s five forces analysis
3.3.1. Bargaining power of suppliers
3.3.2. Bargaining power of buyers
3.3.3. Threat of substitutes
3.3.4. Threat of new entrants
3.3.5. Intensity of rivalry
3.4. Market dynamics
3.4.1. Drivers
3.4.1.1. Increase in number of households
3.4.1.2. Surge in demand for commercial and institutional buildings
3.4.1.3. Increase in building renovation and improvement activities
3.4.2. Restraints
3.4.2.1. Fluctuating prices of raw materials
3.4.3. Opportunities
3.4.3.1. Technological advancements to ensure safety & security
3.5. COVID-19 Impact Analysis on the market
CHAPTER 4: WINDOWS AND DOORS MARKET, BY PRODUCT
4.1. Overview
4.1.1. Market size and forecast
4.2. Doors
4.2.1. Key market trends, growth factors and opportunities
4.2.2. Market size and forecast, by region
4.2.3. Market share analysis by country
4.3. Windows
4.3.1. Key market trends, growth factors and opportunities
4.3.2. Market size and forecast, by region
4.3.3. Market share analysis by country
CHAPTER 5: WINDOWS AND DOORS MARKET, BY MATERIAL
5.1. Overview
5.1.1. Market size and forecast
5.2. Wood
5.2.1. Key market trends, growth factors and opportunities
5.2.2. Market size and forecast, by region
5.2.3. Market share analysis by country
5.3. Metal
5.3.1. Key market trends, growth factors and opportunities
5.3.2. Market size and forecast, by region
5.3.3. Market share analysis by country
5.4. Plastic
5.4.1. Key market trends, growth factors and opportunities
5.4.2. Market size and forecast, by region
5.4.3. Market share analysis by country
CHAPTER 6: WINDOWS AND DOORS MARKET, BY APPLICATION
6.1. Overview
6.1.1. Market size and forecast
6.2. Swinging
6.2.1. Key market trends, growth factors and opportunities
6.2.2. Market size and forecast, by region
6.2.3. Market share analysis by country
6.3. Sliding
6.3.1. Key market trends, growth factors and opportunities
6.3.2. Market size and forecast, by region
6.3.3. Market share analysis by country
6.4. Folding
6.4.1. Key market trends, growth factors and opportunities
6.4.2. Market size and forecast, by region
6.4.3. Market share analysis by country
6.5. Revolving and Others
6.5.1. Key market trends, growth factors and opportunities
6.5.2. Market size and forecast, by region
6.5.3. Market share analysis by country
CHAPTER 7: WINDOWS AND DOORS MARKET, BY END USER
7.1. Overview
7.1.1. Market size and forecast
7.2. Residential
7.2.1. Key market trends, growth factors and opportunities
7.2.2. Market size and forecast, by region
7.2.3. Market share analysis by country
7.3. Non-residential
7.3.1. Key market trends, growth factors and opportunities
7.3.2. Market size and forecast, by region
7.3.3. Market share analysis by country
CHAPTER 8: WINDOWS AND DOORS MARKET, BY REGION
8.1. Overview
8.1.1. Market size and forecast By Region
8.2. North America
8.2.1. Key trends and opportunities
8.2.2. Market size and forecast, by Product
8.2.3. Market size and forecast, by Material
8.2.4. Market size and forecast, by Application
8.2.5. Market size and forecast, by End User
8.2.6. Market size and forecast, by country
8.2.6.1. U.S.
8.2.6.1.1. Key market trends, growth factors and opportunities
8.2.6.1.2. Market size and forecast, by Product
8.2.6.1.3. Market size and forecast, by Material
8.2.6.1.4. Market size and forecast, by Application
8.2.6.1.5. Market size and forecast, by End User
8.2.6.2. Canada
8.2.6.2.1. Key market trends, growth factors and opportunities
8.2.6.2.2. Market size and forecast, by Product
8.2.6.2.3. Market size and forecast, by Material
8.2.6.2.4. Market size and forecast, by Application
8.2.6.2.5. Market size and forecast, by End User
8.2.6.3. Mexico
8.2.6.3.1. Key market trends, growth factors and opportunities
8.2.6.3.2. Market size and forecast, by Product
8.2.6.3.3. Market size and forecast, by Material
8.2.6.3.4. Market size and forecast, by Application
8.2.6.3.5. Market size and forecast, by End User
8.3. Europe
8.3.1. Key trends and opportunities
8.3.2. Market size and forecast, by Product
8.3.3. Market size and forecast, by Material
8.3.4. Market size and forecast, by Application
8.3.5. Market size and forecast, by End User
8.3.6. Market size and forecast, by country
8.3.6.1. Germany
8.3.6.1.1. Key market trends, growth factors and opportunities
8.3.6.1.2. Market size and forecast, by Product
8.3.6.1.3. Market size and forecast, by Material
8.3.6.1.4. Market size and forecast, by Application
8.3.6.1.5. Market size and forecast, by End User
8.3.6.2. France
8.3.6.2.1. Key market trends, growth factors and opportunities
8.3.6.2.2. Market size and forecast, by Product
8.3.6.2.3. Market size and forecast, by Material
8.3.6.2.4. Market size and forecast, by Application
8.3.6.2.5. Market size and forecast, by End User
8.3.6.3. UK
8.3.6.3.1. Key market trends, growth factors and opportunities
8.3.6.3.2. Market size and forecast, by Product
8.3.6.3.3. Market size and forecast, by Material
8.3.6.3.4. Market size and forecast, by Application
8.3.6.3.5. Market size and forecast, by End User
8.3.6.4. Italy
8.3.6.4.1. Key market trends, growth factors and opportunities
8.3.6.4.2. Market size and forecast, by Product
8.3.6.4.3. Market size and forecast, by Material
8.3.6.4.4. Market size and forecast, by Application
8.3.6.4.5. Market size and forecast, by End User
8.3.6.5. Spain
8.3.6.5.1. Key market trends, growth factors and opportunities
8.3.6.5.2. Market size and forecast, by Product
8.3.6.5.3. Market size and forecast, by Material
8.3.6.5.4. Market size and forecast, by Application
8.3.6.5.5. Market size and forecast, by End User
8.3.6.6. Rest of Europe
8.3.6.6.1. Key market trends, growth factors and opportunities
8.3.6.6.2. Market size and forecast, by Product
8.3.6.6.3. Market size and forecast, by Material
8.3.6.6.4. Market size and forecast, by Application
8.3.6.6.5. Market size and forecast, by End User
8.4. Asia-Pacific
8.4.1. Key trends and opportunities
8.4.2. Market size and forecast, by Product
8.4.3. Market size and forecast, by Material
8.4.4. Market size and forecast, by Application
8.4.5. Market size and forecast, by End User
8.4.6. Market size and forecast, by country
8.4.6.1. China
8.4.6.1.1. Key market trends, growth factors and opportunities
8.4.6.1.2. Market size and forecast, by Product
8.4.6.1.3. Market size and forecast, by Material
8.4.6.1.4. Market size and forecast, by Application
8.4.6.1.5. Market size and forecast, by End User
8.4.6.2. India
8.4.6.2.1. Key market trends, growth factors and opportunities
8.4.6.2.2. Market size and forecast, by Product
8.4.6.2.3. Market size and forecast, by Material
8.4.6.2.4. Market size and forecast, by Application
8.4.6.2.5. Market size and forecast, by End User
8.4.6.3. Japan
8.4.6.3.1. Key market trends, growth factors and opportunities
8.4.6.3.2. Market size and forecast, by Product
8.4.6.3.3. Market size and forecast, by Material
8.4.6.3.4. Market size and forecast, by Application
8.4.6.3.5. Market size and forecast, by End User
8.4.6.4. South Korea
8.4.6.4.1. Key market trends, growth factors and opportunities
8.4.6.4.2. Market size and forecast, by Product
8.4.6.4.3. Market size and forecast, by Material
8.4.6.4.4. Market size and forecast, by Application
8.4.6.4.5. Market size and forecast, by End User
8.4.6.5. Australia
8.4.6.5.1. Key market trends, growth factors and opportunities
8.4.6.5.2. Market size and forecast, by Product
8.4.6.5.3. Market size and forecast, by Material
8.4.6.5.4. Market size and forecast, by Application
8.4.6.5.5. Market size and forecast, by End User
8.4.6.6. Rest of Asia-Pacific
8.4.6.6.1. Key market trends, growth factors and opportunities
8.4.6.6.2. Market size and forecast, by Product
8.4.6.6.3. Market size and forecast, by Material
8.4.6.6.4. Market size and forecast, by Application
8.4.6.6.5. Market size and forecast, by End User
8.5. LAMEA
8.5.1. Key trends and opportunities
8.5.2. Market size and forecast, by Product
8.5.3. Market size and forecast, by Material
8.5.4. Market size and forecast, by Application
8.5.5. Market size and forecast, by End User
8.5.6. Market size and forecast, by country
8.5.6.1. Latin America
8.5.6.1.1. Key market trends, growth factors and opportunities
8.5.6.1.2. Market size and forecast, by Product
8.5.6.1.3. Market size and forecast, by Material
8.5.6.1.4. Market size and forecast, by Application
8.5.6.1.5. Market size and forecast, by End User
8.5.6.2. Middle East
8.5.6.2.1. Key market trends, growth factors and opportunities
8.5.6.2.2. Market size and forecast, by Product
8.5.6.2.3. Market size and forecast, by Material
8.5.6.2.4. Market size and forecast, by Application
8.5.6.2.5. Market size and forecast, by End User
8.5.6.3. Africa
8.5.6.3.1. Key market trends, growth factors and opportunities
8.5.6.3.2. Market size and forecast, by Product
8.5.6.3.3. Market size and forecast, by Material
8.5.6.3.4. Market size and forecast, by Application
8.5.6.3.5. Market size and forecast, by End User
CHAPTER 9: COMPETITIVE LANDSCAPE
9.1. Introduction
9.2. Top winning strategies
9.3. Product Mapping of Top 10 Player
9.4. Competitive Dashboard
9.5. Competitive Heatmap
9.6. Top player positioning, 2022
CHAPTER 10: COMPANY PROFILES
10.1. Andersen Corporation
10.1.1. Company overview
10.1.2. Key Executives
10.1.3. Company snapshot
10.1.4. Operating business segments
10.1.5. Product portfolio
10.1.6. Key strategic moves and developments
10.2. Cornerstone Building Brands, Inc. (Atrium Corporation)
10.2.1. Company overview
10.2.2. Key Executives
10.2.3. Company snapshot
10.2.4. Operating business segments
10.2.5. Product portfolio
10.2.6. Business performance
10.2.7. Key strategic moves and developments
10.3. Sanwa Holdings Corporation (Horton Automatics Inc,)
10.3.1. Company overview
10.3.2. Key Executives
10.3.3. Company snapshot
10.3.4. Operating business segments
10.3.5. Product portfolio
10.3.6. Business performance
10.3.7. Key strategic moves and developments
10.4. JELD-WEN Holding, Inc.
10.4.1. Company overview
10.4.2. Key Executives
10.4.3. Company snapshot
10.4.4. Operating business segments
10.4.5. Product portfolio
10.4.6. Business performance
10.4.7. Key strategic moves and developments
10.5. LIXIL Corporation
10.5.1. Company overview
10.5.2. Key Executives
10.5.3. Company snapshot
10.5.4. Operating business segments
10.5.5. Product portfolio
10.5.6. Business performance
10.6. Marvin
10.6.1. Company overview
10.6.2. Key Executives
10.6.3. Company snapshot
10.6.4. Operating business segments
10.6.5. Product portfolio
10.6.6. Key strategic moves and developments
10.7. MI Windows and Doors, LLC.
10.7.1. Company overview
10.7.2. Key Executives
10.7.3. Company snapshot
10.7.4. Operating business segments
10.7.5. Product portfolio
10.7.6. Key strategic moves and developments
10.8. Pella Corporation
10.8.1. Company overview
10.8.2. Key Executives
10.8.3. Company snapshot
10.8.4. Operating business segments
10.8.5. Product portfolio
10.8.6. Key strategic moves and developments
10.9. YKK Corporation
10.9.1. Company overview
10.9.2. Key Executives
10.9.3. Company snapshot
10.9.4. Operating business segments
10.9.5. Product portfolio
10.9.6. Business performance
10.9.7. Key strategic moves and developments
10.10. DCM Shriram Ltd. (Fenesta Building System)s
10.10.1. Company overview
10.10.2. Key Executives
10.10.3. Company snapshot
10.10.4. Operating business segments
10.10.5. Product portfolio
10.10.6. Business performance
10.10.7. Key strategic moves and development
LIST OF TABLES
TABLE 01. GLOBAL WINDOWS AND DOORS MARKET, BY PRODUCT, 2022-2032 ($MILLION)
TABLE 02. WINDOWS AND DOORS MARKET FOR DOORS, BY REGION, 2022-2032 ($MILLION)
TABLE 03. WINDOWS AND DOORS MARKET FOR WINDOWS, BY REGION, 2022-2032 ($MILLION)
TABLE 04. GLOBAL WINDOWS AND DOORS MARKET, BY MATERIAL, 2022-2032 ($MILLION)
TABLE 05. WINDOWS AND DOORS MARKET FOR WOOD, BY REGION, 2022-2032 ($MILLION)
TABLE 06. WINDOWS AND DOORS MARKET FOR METAL, BY REGION, 2022-2032 ($MILLION)
TABLE 07. WINDOWS AND DOORS MARKET FOR PLASTIC, BY REGION, 2022-2032 ($MILLION)
TABLE 08. GLOBAL WINDOWS AND DOORS MARKET, BY APPLICATION, 2022-2032 ($MILLION)
TABLE 09. WINDOWS AND DOORS MARKET FOR SWINGING, BY REGION, 2022-2032 ($MILLION)
TABLE 10. WINDOWS AND DOORS MARKET FOR SLIDING, BY REGION, 2022-2032 ($MILLION)
TABLE 11. WINDOWS AND DOORS MARKET FOR FOLDING, BY REGION, 2022-2032 ($MILLION)
TABLE 12. WINDOWS AND DOORS MARKET FOR REVOLVING AND OTHERS, BY REGION, 2022-2032 ($MILLION)
TABLE 13. GLOBAL WINDOWS AND DOORS MARKET, BY END USER, 2022-2032 ($MILLION)
TABLE 14. WINDOWS AND DOORS MARKET FOR RESIDENTIAL, BY REGION, 2022-2032 ($MILLION)
TABLE 15. WINDOWS AND DOORS MARKET FOR NON-RESIDENTIAL, BY REGION, 2022-2032 ($MILLION)
TABLE 16. WINDOWS AND DOORS MARKET, BY REGION, 2022-2032 ($MILLION)
TABLE 17. NORTH AMERICA WINDOWS AND DOORS MARKET, BY PRODUCT, 2022-2032 ($MILLION)
TABLE 18. NORTH AMERICA WINDOWS AND DOORS MARKET, BY MATERIAL, 2022-2032 ($MILLION)
TABLE 19. NORTH AMERICA WINDOWS AND DOORS MARKET, BY APPLICATION, 2022-2032 ($MILLION)
TABLE 20. NORTH AMERICA WINDOWS AND DOORS MARKET, BY END USER, 2022-2032 ($MILLION)
TABLE 21. NORTH AMERICA WINDOWS AND DOORS MARKET, BY COUNTRY, 2022-2032 ($MILLION)
TABLE 22. U.S. WINDOWS AND DOORS MARKET, BY PRODUCT, 2022-2032 ($MILLION)
TABLE 23. U.S. WINDOWS AND DOORS MARKET, BY MATERIAL, 2022-2032 ($MILLION)
TABLE 24. U.S. WINDOWS AND DOORS MARKET, BY APPLICATION, 2022-2032 ($MILLION)
TABLE 25. U.S. WINDOWS AND DOORS MARKET, BY END USER, 2022-2032 ($MILLION)
TABLE 26. CANADA WINDOWS AND DOORS MARKET, BY PRODUCT, 2022-2032 ($MILLION)
TABLE 27. CANADA WINDOWS AND DOORS MARKET, BY MATERIAL, 2022-2032 ($MILLION)
TABLE 28. CANADA WINDOWS AND DOORS MARKET, BY APPLICATION, 2022-2032 ($MILLION)
TABLE 29. CANADA WINDOWS AND DOORS MARKET, BY END USER, 2022-2032 ($MILLION)
TABLE 30. MEXICO WINDOWS AND DOORS MARKET, BY PRODUCT, 2022-2032 ($MILLION)
TABLE 31. MEXICO WINDOWS AND DOORS MARKET, BY MATERIAL, 2022-2032 ($MILLION)
TABLE 32. MEXICO WINDOWS AND DOORS MARKET, BY APPLICATION, 2022-2032 ($MILLION)
TABLE 33. MEXICO WINDOWS AND DOORS MARKET, BY END USER, 2022-2032 ($MILLION)
TABLE 34. EUROPE WINDOWS AND DOORS MARKET, BY PRODUCT, 2022-2032 ($MILLION)
TABLE 35. EUROPE WINDOWS AND DOORS MARKET, BY MATERIAL, 2022-2032 ($MILLION)
TABLE 36. EUROPE WINDOWS AND DOORS MARKET, BY APPLICATION, 2022-2032 ($MILLION)
TABLE 37. EUROPE WINDOWS AND DOORS MARKET, BY END USER, 2022-2032 ($MILLION)
TABLE 38. EUROPE WINDOWS AND DOORS MARKET, BY COUNTRY, 2022-2032 ($MILLION)
TABLE 39. GERMANY WINDOWS AND DOORS MARKET, BY PRODUCT, 2022-2032 ($MILLION)
TABLE 40. GERMANY WINDOWS AND DOORS MARKET, BY MATERIAL, 2022-2032 ($MILLION)
TABLE 41. GERMANY WINDOWS AND DOORS MARKET, BY APPLICATION, 2022-2032 ($MILLION)
TABLE 42. GERMANY WINDOWS AND DOORS MARKET, BY END USER, 2022-2032 ($MILLION)
TABLE 43. FRANCE WINDOWS AND DOORS MARKET, BY PRODUCT, 2022-2032 ($MILLION)
TABLE 44. FRANCE WINDOWS AND DOORS MARKET, BY MATERIAL, 2022-2032 ($MILLION)
TABLE 45. FRANCE WINDOWS AND DOORS MARKET, BY APPLICATION, 2022-2032 ($MILLION)
TABLE 46. FRANCE WINDOWS AND DOORS MARKET, BY END USER, 2022-2032 ($MILLION)
TABLE 47. UK WINDOWS AND DOORS MARKET, BY PRODUCT, 2022-2032 ($MILLION)
TABLE 48. UK WINDOWS AND DOORS MARKET, BY MATERIAL, 2022-2032 ($MILLION)
TABLE 49. UK WINDOWS AND DOORS MARKET, BY APPLICATION, 2022-2032 ($MILLION)
TABLE 50. UK WINDOWS AND DOORS MARKET, BY END USER, 2022-2032 ($MILLION)
TABLE 51. ITALY WINDOWS AND DOORS MARKET, BY PRODUCT, 2022-2032 ($MILLION)
TABLE 52. ITALY WINDOWS AND DOORS MARKET, BY MATERIAL, 2022-2032 ($MILLION)
TABLE 53. ITALY WINDOWS AND DOORS MARKET, BY APPLICATION, 2022-2032 ($MILLION)
TABLE 54. ITALY WINDOWS AND DOORS MARKET, BY END USER, 2022-2032 ($MILLION)
TABLE 55. SPAIN WINDOWS AND DOORS MARKET, BY PRODUCT, 2022-2032 ($MILLION)
TABLE 56. SPAIN WINDOWS AND DOORS MARKET, BY MATERIAL, 2022-2032 ($MILLION)
TABLE 57. SPAIN WINDOWS AND DOORS MARKET, BY APPLICATION, 2022-2032 ($MILLION)
TABLE 58. SPAIN WINDOWS AND DOORS MARKET, BY END USER, 2022-2032 ($MILLION)
TABLE 59. REST OF EUROPE WINDOWS AND DOORS MARKET, BY PRODUCT, 2022-2032 ($MILLION)
TABLE 60. REST OF EUROPE WINDOWS AND DOORS MARKET, BY MATERIAL, 2022-2032 ($MILLION)
TABLE 61. REST OF EUROPE WINDOWS AND DOORS MARKET, BY APPLICATION, 2022-2032 ($MILLION)
TABLE 62. REST OF EUROPE WINDOWS AND DOORS MARKET, BY END USER, 2022-2032 ($MILLION)
TABLE 63. ASIA-PACIFIC WINDOWS AND DOORS MARKET, BY PRODUCT, 2022-2032 ($MILLION)
TABLE 64. ASIA-PACIFIC WINDOWS AND DOORS MARKET, BY MATERIAL, 2022-2032 ($MILLION)
TABLE 65. ASIA-PACIFIC WINDOWS AND DOORS MARKET, BY APPLICATION, 2022-2032 ($MILLION)
TABLE 66. ASIA-PACIFIC WINDOWS AND DOORS MARKET, BY END USER, 2022-2032 ($MILLION)
TABLE 67. ASIA-PACIFIC WINDOWS AND DOORS MARKET, BY COUNTRY, 2022-2032 ($MILLION)
TABLE 68. CHINA WINDOWS AND DOORS MARKET, BY PRODUCT, 2022-2032 ($MILLION)
TABLE 69. CHINA WINDOWS AND DOORS MARKET, BY MATERIAL, 2022-2032 ($MILLION)
TABLE 70. CHINA WINDOWS AND DOORS MARKET, BY APPLICATION, 2022-2032 ($MILLION)
TABLE 71. CHINA WINDOWS AND DOORS MARKET, BY END USER, 2022-2032 ($MILLION)
TABLE 72. INDIA WINDOWS AND DOORS MARKET, BY PRODUCT, 2022-2032 ($MILLION)
TABLE 73. INDIA WINDOWS AND DOORS MARKET, BY MATERIAL, 2022-2032 ($MILLION)
TABLE 74. INDIA WINDOWS AND DOORS MARKET, BY APPLICATION, 2022-2032 ($MILLION)
TABLE 75. INDIA WINDOWS AND DOORS MARKET, BY END USER, 2022-2032 ($MILLION)
TABLE 76. JAPAN WINDOWS AND DOORS MARKET, BY PRODUCT, 2022-2032 ($MILLION)
TABLE 77. JAPAN WINDOWS AND DOORS MARKET, BY MATERIAL, 2022-2032 ($MILLION)
TABLE 78. JAPAN WINDOWS AND DOORS MARKET, BY APPLICATION, 2022-2032 ($MILLION)
TABLE 79. JAPAN WINDOWS AND DOORS MARKET, BY END USER, 2022-2032 ($MILLION)
TABLE 80. SOUTH KOREA WINDOWS AND DOORS MARKET, BY PRODUCT, 2022-2032 ($MILLION)
TABLE 81. SOUTH KOREA WINDOWS AND DOORS MARKET, BY MATERIAL, 2022-2032 ($MILLION)
TABLE 82. SOUTH KOREA WINDOWS AND DOORS MARKET, BY APPLICATION, 2022-2032 ($MILLION)
TABLE 83. SOUTH KOREA WINDOWS AND DOORS MARKET, BY END USER, 2022-2032 ($MILLION)
TABLE 84. AUSTRALIA WINDOWS AND DOORS MARKET, BY PRODUCT, 2022-2032 ($MILLION)
TABLE 85. AUSTRALIA WINDOWS AND DOORS MARKET, BY MATERIAL, 2022-2032 ($MILLION)
TABLE 86. AUSTRALIA WINDOWS AND DOORS MARKET, BY APPLICATION, 2022-2032 ($MILLION)
TABLE 87. AUSTRALIA WINDOWS AND DOORS MARKET, BY END USER, 2022-2032 ($MILLION)
TABLE 88. REST OF ASIA-PACIFIC WINDOWS AND DOORS MARKET, BY PRODUCT, 2022-2032 ($MILLION)
TABLE 89. REST OF ASIA-PACIFIC WINDOWS AND DOORS MARKET, BY MATERIAL, 2022-2032 ($MILLION)
TABLE 90. REST OF ASIA-PACIFIC WINDOWS AND DOORS MARKET, BY APPLICATION, 2022-2032 ($MILLION)
TABLE 91. REST OF ASIA-PACIFIC WINDOWS AND DOORS MARKET, BY END USER, 2022-2032 ($MILLION)
TABLE 92. LAMEA WINDOWS AND DOORS MARKET, BY PRODUCT, 2022-2032 ($MILLION)
TABLE 93. LAMEA WINDOWS AND DOORS MARKET, BY MATERIAL, 2022-2032 ($MILLION)
TABLE 94. LAMEA WINDOWS AND DOORS MARKET, BY APPLICATION, 2022-2032 ($MILLION)
TABLE 95. LAMEA WINDOWS AND DOORS MARKET, BY END USER, 2022-2032 ($MILLION)
TABLE 96. LAMEA WINDOWS AND DOORS MARKET, BY COUNTRY, 2022-2032 ($MILLION)
TABLE 97. LATIN AMERICA WINDOWS AND DOORS MARKET, BY PRODUCT, 2022-2032 ($MILLION)
TABLE 98. LATIN AMERICA WINDOWS AND DOORS MARKET, BY MATERIAL, 2022-2032 ($MILLION)
TABLE 99. LATIN AMERICA WINDOWS AND DOORS MARKET, BY APPLICATION, 2022-2032 ($MILLION)
TABLE 100. LATIN AMERICA WINDOWS AND DOORS MARKET, BY END USER, 2022-2032 ($MILLION)
TABLE 101. MIDDLE EAST WINDOWS AND DOORS MARKET, BY PRODUCT, 2022-2032 ($MILLION)
TABLE 102. MIDDLE EAST WINDOWS AND DOORS MARKET, BY MATERIAL, 2022-2032 ($MILLION)
TABLE 103. MIDDLE EAST WINDOWS AND DOORS MARKET, BY APPLICATION, 2022-2032 ($MILLION)
TABLE 104. MIDDLE EAST WINDOWS AND DOORS MARKET, BY END USER, 2022-2032 ($MILLION)
TABLE 105. AFRICA WINDOWS AND DOORS MARKET, BY PRODUCT, 2022-2032 ($MILLION)
TABLE 106. AFRICA WINDOWS AND DOORS MARKET, BY MATERIAL, 2022-2032 ($MILLION)
TABLE 107. AFRICA WINDOWS AND DOORS MARKET, BY APPLICATION, 2022-2032 ($MILLION)
TABLE 108. AFRICA WINDOWS AND DOORS MARKET, BY END USER, 2022-2032 ($MILLION)
TABLE 109. ANDERSEN CORPORATION: KEY EXECUTIVES
TABLE 110. ANDERSEN CORPORATION: COMPANY SNAPSHOT
TABLE 111. ANDERSEN CORPORATION: PRODUCT SEGMENTS
TABLE 112. ANDERSEN CORPORATION: PRODUCT PORTFOLIO
TABLE 113. ANDERSEN CORPORATION: KEY STRATERGIES
TABLE 114. CORNERSTONE BUILDING BRANDS, INC. (ATRIUM CORPORATION): KEY EXECUTIVES
TABLE 115. CORNERSTONE BUILDING BRANDS, INC. (ATRIUM CORPORATION): COMPANY SNAPSHOT
TABLE 116. CORNERSTONE BUILDING BRANDS, INC. (ATRIUM CORPORATION): PRODUCT SEGMENTS
TABLE 117. CORNERSTONE BUILDING BRANDS, INC. (ATRIUM CORPORATION): PRODUCT PORTFOLIO
TABLE 118. CORNERSTONE BUILDING BRANDS, INC. (ATRIUM CORPORATION): KEY STRATERGIES
TABLE 119. SANWA HOLDINGS CORPORATION (HORTON AUTOMATICS INC,): KEY EXECUTIVES
TABLE 120. SANWA HOLDINGS CORPORATION (HORTON AUTOMATICS INC,): COMPANY SNAPSHOT
TABLE 121. SANWA HOLDINGS CORPORATION (HORTON AUTOMATICS INC,): PRODUCT SEGMENTS
TABLE 122. SANWA HOLDINGS CORPORATION (HORTON AUTOMATICS INC,): PRODUCT PORTFOLIO
TABLE 123. SANWA HOLDINGS CORPORATION (HORTON AUTOMATICS INC,): KEY STRATERGIES
TABLE 124. JELD-WEN HOLDING, INC.: KEY EXECUTIVES
TABLE 125. JELD-WEN HOLDING, INC.: COMPANY SNAPSHOT
TABLE 126. JELD-WEN HOLDING, INC.: PRODUCT SEGMENTS
TABLE 127. JELD-WEN HOLDING, INC.: PRODUCT PORTFOLIO
TABLE 128. JELD-WEN HOLDING, INC.: KEY STRATERGIES
TABLE 129. LIXIL CORPORATION: KEY EXECUTIVES
TABLE 130. LIXIL CORPORATION: COMPANY SNAPSHOT
TABLE 131. LIXIL CORPORATION: PRODUCT SEGMENTS
TABLE 132. LIXIL CORPORATION: PRODUCT PORTFOLIO
TABLE 133. MARVIN: KEY EXECUTIVES
TABLE 134. MARVIN: COMPANY SNAPSHOT
TABLE 135. MARVIN: PRODUCT SEGMENTS
TABLE 136. MARVIN: PRODUCT PORTFOLIO
TABLE 137. MARVIN: KEY STRATERGIES
TABLE 138. MI WINDOWS AND DOORS, LLC.: KEY EXECUTIVES
TABLE 139. MI WINDOWS AND DOORS, LLC.: COMPANY SNAPSHOT
TABLE 140. MI WINDOWS AND DOORS, LLC.: PRODUCT SEGMENTS
TABLE 141. MI WINDOWS AND DOORS, LLC.: PRODUCT PORTFOLIO
TABLE 142. MI WINDOWS AND DOORS, LLC.: KEY STRATERGIES
TABLE 143. PELLA CORPORATION: KEY EXECUTIVES
TABLE 144. PELLA CORPORATION: COMPANY SNAPSHOT
TABLE 145. PELLA CORPORATION: PRODUCT SEGMENTS
TABLE 146. PELLA CORPORATION: PRODUCT PORTFOLIO
TABLE 147. PELLA CORPORATION: KEY STRATERGIES
TABLE 148. YKK CORPORATION: KEY EXECUTIVES
TABLE 149. YKK CORPORATION: COMPANY SNAPSHOT
TABLE 150. YKK CORPORATION: PRODUCT SEGMENTS
TABLE 151. YKK CORPORATION: PRODUCT PORTFOLIO
TABLE 152. YKK CORPORATION: KEY STRATERGIES
TABLE 153. DCM SHRIRAM LTD. (FENESTA BUILDING SYSTEM)S: KEY EXECUTIVES
TABLE 154. DCM SHRIRAM LTD. (FENESTA BUILDING SYSTEM)S: COMPANY SNAPSHOT
TABLE 155. DCM SHRIRAM LTD. (FENESTA BUILDING SYSTEM)S: PRODUCT SEGMENTS
TABLE 156. DCM SHRIRAM LTD. (FENESTA BUILDING SYSTEM)S: PRODUCT PORTFOLIO
TABLE 157. DCM SHRIRAM LTD. (FENESTA BUILDING SYSTEM)S: KEY STRATERGIES LIST OF FIGURES
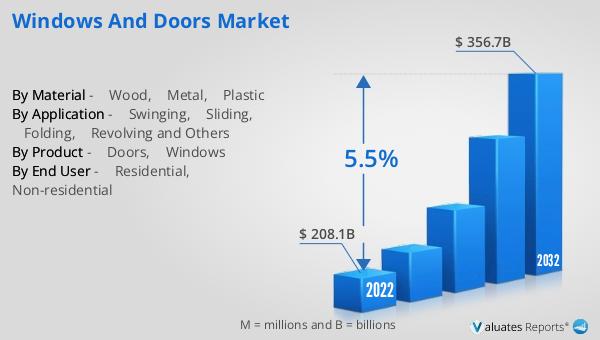
FIGURE 01. WINDOWS AND DOORS MARKET, 2022-2032
FIGURE 02. SEGMENTATION OF WINDOWS AND DOORS MARKET, 2022-2032
FIGURE 03. TOP INVESTMENT POCKETS IN WINDOWS AND DOORS MARKET (2023-2032)
FIGURE 04. LOW BARGAINING POWER OF SUPPLIERS
FIGURE 05. LOW BARGAINING POWER OF BUYERS
FIGURE 06. LOW THREAT OF SUBSTITUTES
FIGURE 07. LOW THREAT OF NEW ENTRANTS
FIGURE 08. LOW INTENSITY OF RIVALRY
FIGURE 09. DRIVERS, RESTRAINTS AND OPPORTUNITIES: GLOBALWINDOWS AND DOORS MARKET
FIGURE 10. WINDOWS AND DOORS MARKET, BY PRODUCT, 2022(%)
FIGURE 11. COMPARATIVE SHARE ANALYSIS OF WINDOWS AND DOORS MARKET FOR DOORS, BY COUNTRY 2022 AND 2032(%)
FIGURE 12. COMPARATIVE SHARE ANALYSIS OF WINDOWS AND DOORS MARKET FOR WINDOWS, BY COUNTRY 2022 AND 2032(%)
FIGURE 13. WINDOWS AND DOORS MARKET, BY MATERIAL, 2022(%)
FIGURE 14. COMPARATIVE SHARE ANALYSIS OF WINDOWS AND DOORS MARKET FOR WOOD, BY COUNTRY 2022 AND 2032(%)
FIGURE 15. COMPARATIVE SHARE ANALYSIS OF WINDOWS AND DOORS MARKET FOR METAL, BY COUNTRY 2022 AND 2032(%)
FIGURE 16. COMPARATIVE SHARE ANALYSIS OF WINDOWS AND DOORS MARKET FOR PLASTIC, BY COUNTRY 2022 AND 2032(%)
FIGURE 17. WINDOWS AND DOORS MARKET, BY APPLICATION, 2022(%)
FIGURE 18. COMPARATIVE SHARE ANALYSIS OF WINDOWS AND DOORS MARKET FOR SWINGING, BY COUNTRY 2022 AND 2032(%)
FIGURE 19. COMPARATIVE SHARE ANALYSIS OF WINDOWS AND DOORS MARKET FOR SLIDING, BY COUNTRY 2022 AND 2032(%)
FIGURE 20. COMPARATIVE SHARE ANALYSIS OF WINDOWS AND DOORS MARKET FOR FOLDING, BY COUNTRY 2022 AND 2032(%)
FIGURE 21. COMPARATIVE SHARE ANALYSIS OF WINDOWS AND DOORS MARKET FOR REVOLVING AND OTHERS, BY COUNTRY 2022 AND 2032(%)
FIGURE 22. WINDOWS AND DOORS MARKET, BY END USER, 2022(%)
FIGURE 23. COMPARATIVE SHARE ANALYSIS OF WINDOWS AND DOORS MARKET FOR RESIDENTIAL, BY COUNTRY 2022 AND 2032(%)
FIGURE 24. COMPARATIVE SHARE ANALYSIS OF WINDOWS AND DOORS MARKET FOR NON-RESIDENTIAL, BY COUNTRY 2022 AND 2032(%)
FIGURE 25. WINDOWS AND DOORS MARKET BY REGION, 2022
FIGURE 26. U.S. WINDOWS AND DOORS MARKET, 2022-2032 ($MILLION)
FIGURE 27. CANADA WINDOWS AND DOORS MARKET, 2022-2032 ($MILLION)
FIGURE 28. MEXICO WINDOWS AND DOORS MARKET, 2022-2032 ($MILLION)
FIGURE 29. GERMANY WINDOWS AND DOORS MARKET, 2022-2032 ($MILLION)
FIGURE 30. FRANCE WINDOWS AND DOORS MARKET, 2022-2032 ($MILLION)
FIGURE 31. UK WINDOWS AND DOORS MARKET, 2022-2032 ($MILLION)
FIGURE 32. ITALY WINDOWS AND DOORS MARKET, 2022-2032 ($MILLION)
FIGURE 33. SPAIN WINDOWS AND DOORS MARKET, 2022-2032 ($MILLION)
FIGURE 34. REST OF EUROPE WINDOWS AND DOORS MARKET, 2022-2032 ($MILLION)
FIGURE 35. CHINA WINDOWS AND DOORS MARKET, 2022-2032 ($MILLION)
FIGURE 36. INDIA WINDOWS AND DOORS MARKET, 2022-2032 ($MILLION)
FIGURE 37. JAPAN WINDOWS AND DOORS MARKET, 2022-2032 ($MILLION)
FIGURE 38. SOUTH KOREA WINDOWS AND DOORS MARKET, 2022-2032 ($MILLION)
FIGURE 39. AUSTRALIA WINDOWS AND DOORS MARKET, 2022-2032 ($MILLION)
FIGURE 40. REST OF ASIA-PACIFIC WINDOWS AND DOORS MARKET, 2022-2032 ($MILLION)
FIGURE 41. LATIN AMERICA WINDOWS AND DOORS MARKET, 2022-2032 ($MILLION)
FIGURE 42. MIDDLE EAST WINDOWS AND DOORS MARKET, 2022-2032 ($MILLION)
FIGURE 43. AFRICA WINDOWS AND DOORS MARKET, 2022-2032 ($MILLION)
FIGURE 44. TOP WINNING STRATEGIES, BY YEAR
FIGURE 45. TOP WINNING STRATEGIES, BY DEVELOPMENT
FIGURE 46. TOP WINNING STRATEGIES, BY COMPANY
FIGURE 47. PRODUCT MAPPING OF TOP 10 PLAYERS
FIGURE 48. COMPETITIVE DASHBOARD
FIGURE 49. COMPETITIVE HEATMAP: WINDOWS AND DOORS MARKET
FIGURE 50. TOP PLAYER POSITIONING, 2022
FIGURE 51. CORNERSTONE BUILDING BRANDS, INC. (ATRIUM CORPORATION): NET SALES, 2020-2022 ($MILLION)
FIGURE 52. CORNERSTONE BUILDING BRANDS, INC. (ATRIUM CORPORATION): REVENUE SHARE BY SEGMENT, 2022 (%)
FIGURE 53. SANWA HOLDINGS CORPORATION (HORTON AUTOMATICS INC,): NET SALES, 2020-2022 ($MILLION)
FIGURE 54. SANWA HOLDINGS CORPORATION (HORTON AUTOMATICS INC,): RESEARCH & DEVELOPMENT EXPENDITURE, 2020-2022 (
FIGURE 55. SANWA HOLDINGS CORPORATION (HORTON AUTOMATICS INC,): REVENUE SHARE BY SEGMENT, 2022 (%)
FIGURE 56. JELD-WEN HOLDING, INC.: NET SALES, 2020-2022 ($MILLION)
FIGURE 57. JELD-WEN HOLDING, INC.: REVENUE SHARE BY SEGMENT, 2022 (%)
FIGURE 58. LIXIL CORPORATION: NET SALES, 2020-2022 ($MILLION)
FIGURE 59. LIXIL CORPORATION: RESEARCH & DEVELOPMENT EXPENDITURE, 2020-2022 ($MILLION)
FIGURE 60. LIXIL CORPORATION: REVENUE SHARE BY SEGMENT, 2022 (%)
FIGURE 61. YKK CORPORATION: NET SALES, 2020-2022 ($MILLION)
FIGURE 62. DCM SHRIRAM LTD. (FENESTA BUILDING SYSTEM)S: NET SALES, 2020-2022 ($MILLION)
FIGURE 63. DCM SHRIRAM LTD. (FENESTA BUILDING SYSTEM)S: REVENUE SHARE BY SEGMENT, 2022 (%)
FIGURE 64. DCM SHRIRAM LTD. (FENESTA BUILDING SYSTEM)S: REVENUE SHARE BY REGION, 2022 (%
SELECT A FORMAT
Added to Cart
Electronic (PDF)

$5730

This license allows only one user to access the PDF.
Electronic (PDF)

$6450

This license allows 1 - 5 user to access the PDF, license is suitable for small groups of 5 users working together
Electronic (PDF)

$9600

This license allows users/teams in a same Enterprise to use this report, various departments within an enterpise can use this report
Electronic (PDF)

$3840

This license just provides quantitative data in a excel sheet
Add to Cart
Buy Now (15% Discount)

OUR CUSTOMER

SecuX Technology Inc

SIMILAR REPORTS