0
U.S. (TOLL FREE)
+1 (315) 215-3225
Automative

0
U.S. (TOLL FREE)
+1 (315) 215-3225
Probiotic Desserts Market By Type (Dairy Based, Plant Based), By Application (Yogurt, Kefir, Ice Cream, Others), By Distribution Channel (Ecommerce, Specialty Store, Hypermarket and Supermarket, Others): Global Opportunity Analysis and Industry Forecast, 2021-2031
Published Date: 2023-03-01
|
Report Code: ALLI-Auto-2S781
Home | Market Reports
Probiotic Desserts Market By Type Dairy Based Plant Based By Application Yogurt Kefir Ice Cream Others By Distribution Channel Ecommerce Specialty Store Hypermarket and Supermarket Others Global Opportunity Analysis and Industry Forecast 2021 2031
BUY CHAPTERS

Probiotic Desserts Market By Type (Dairy Based, Plant Based), By Application (Yogurt, Kefir, Ice Cream, Others), By Distribution Channel (Ecommerce, Specialty Store, Hypermarket and Supermarket, Others): Global Opportunity Analysis and Industry Forecast, 2021-2031

Code: ALLI-Auto-2S781
Report
2023-03-01
Pages:247
Allied Market Research
Buy Now with 15% Discount
DESCRIPTION
TABLE OF CONTENT
TABLES & FIGURES

Probiotic Desserts Market Size

According to a new report published by , titled, “Probiotic Desserts Market," The probiotic desserts market was valued at $680.71 million in 2021, and is estimated to reach $1.4 billion by 2031, growing at a CAGR of 7.2% from 2022 to 2031.

Probiotic Desserts Market

Probiotic Desserts Market

Probiotics dessert market include Production and sale of desserts containing live microorganisms beneficial to the health of the body. These desserts are commonly consumed because of their ability to improve digestion, boost the immune system, and balance the gut microbiome.
The probiotic desserts market includes various products such as probiotic yogurt, kefir, ice cream, puddings, and other fermented milk desserts. These products come in a variety of flavors and can be found in grocery and health food stores. The market size is driven by growing demand for healthy and functional food and growing awareness of the health benefits of probiotics. The market is expected to grow as consumers become more health conscious and look for convenient and tasty ways to include probiotics in their diet.
Over the last decade, the demand for functional food has increased in many parts of the world. Its consistent and significant development has turned into the key driver of advancement in health. Probiotics is an important ingredient in functional food, almost one-third of probiotic is present in functional food. According to food science and food safety journal, around 65% of the total Brazilian functional food are probiotic products. The demand of probiotic functional food is growing rapidly due to increased awareness among consumers about the positive impact of food on the health.
According to the functional food consumers’ survey, conducted by International Food Information Council, 63% of the consumers in America are aware of probiotic food and believe that good nutrition is necessary to manage health, thereby increasing the adoption of probiotic desert.
Creative flavors can play a major role in increasing market demand for probiotic desserts. Desserts rich in probiotics are becoming increasingly popular due to their health benefits, but sometimes they can be associated with bland taste. Creative flavors can help change this perception and make probiotic desserts more appealing to consumers. By offering unique and exciting flavor combinations, dessert makers can capitalize on the growing trend of sweet-toothed consumers looking for healthier food. For example, introducing probiotic mango-coconut sorbet or probiotic matcha green tea yogurt can help differentiate your product from existing probiotic desserts and attract new customers.
Creative flavors can also create new cross-sell and up-sell opportunities. That's because once customers find a flavor they particularly like, they may be more likely to try multiple flavors or come back to purchase more. Overall, creative flavors play a key role in driving consumer demand for probiotic desserts and help differentiate the product from other health-focused offerings.
The scope of the study is intended to discuss the upcoming and present market trends of a probiotic desserts. In addition, this report details current market trends, drivers, restraints, and opportunities and determines the future growth potential of the global probiotic desserts market. The global probiotic desserts market is segmented into type, application, and distribution channel. According to type, the market is categorized into dairy based and plant based. Depending on application, the application market is fragmented into the yogurt, kefir, ice cream and others. As distribution channel, it is divided into supermarket and hypermarket, specialty store, e-commerce, and others.
 
By type, dairy based probiotic desserts held the major share in the market. Growing consumer demand for healthy and functional food is driving the growth of the global market for probiotic dairy desserts. The trend toward healthy, natural food is bolstering the market as consumers look for products that contain natural ingredients and are free of artificial additives. However, the plant-based segment is projected with the highest CAGR from 2022 to 2031. In recent years, various factors such as health concerns, animal welfare, and environmental sustainability have increased the demand for plant-based products including desserts.
On the basis of application, the yogurt segment held a major share in the probiotic desserts market and is expected to dominate during the forecast period. The probiotic yogurt industry is expanding as a result of consumers' increased interest in natural and organic products. Many customers go for probiotic yoghurt products that use organic ingredients and less processing because they consider it as a natural way to boost health. However, the ice cream segment is projected to manifest the highest CAGR from 2022 to 2031.
Based on the distribution channel, the specialty store segment held the major share in the probiotic desserts market Specialty stores provide high-quality service and detailed product specifications & expert guidance to customers. The continuously evolving retail industry along with changes in consumer behavior and improvement in overall lifestyle across the world have led to the introduction of specialized retail formats. However, the e-commerce segment is projected to manifest the highest CAGR from 2022 to 2031. E-commerce serves as a popular medium for the purchase of nutraceuticals. Large-scale internet penetration and the availability of a myriad of sites for shopping online are some of the major reasons for the growth of online shopping.
North America held the major share in the probiotic desserts market. Digestive problems among the adult population in the U.S. due to poor food consumption habits, intake of huge number of antibiotics, and use of additives for food processing have augmented the demand for probiotics.  However, the Asia-Pacific region is projected to manifest the highest CAGR from 2022 to 2031. In terms of market growth, the Asia-Pacific probiotic desserts market is expected to continue to grow rapidly in the coming years, Growth in awareness about probiotics in China and India has led to increased demand for probiotics desserts.
The major players operating in the global probiotic desserts market are Lancashire Farm, Sovos Brands, Inc., General Mills, Inc., Chobani Global Holdings, LLC, Danone Inc., Fonterra Co-operative Group Limited, Meiji Holdings Co., Ltd., National Dairy Development Board, Yofix, and Forager Project.

Overview

The global probiotic desserts market was valued at $680.7 million in 2021, and is projected to reach $1,375.1 million by 2031, registering a CAGR of 7.2%. The probiotic desserts market has grown in recent years due to increased interest and awareness about the potential health benefits of probiotics. The market contains a variety of products fortified with probiotics, such as yogurt, kefir, ice cream and other dairy desserts, providing consumers with a convenient way to include probiotics in their diet.
Growing demand for probiotic desserts has led to increased product innovation and availability, making it easier for consumers to access and incorporate probiotics into their diets. This has helped bring the benefits of probiotics to a wider audience and has led to a better understanding of their role in promoting gut health and overall well-being.
The probiotics dessert market is also opening new business opportunities for entrepreneurs and manufacturers to meet the growing demand for health-conscious products. The market is expected to continue to grow in the coming years as more research is done to support the health benefits of probiotics and consumers become more aware of the importance of gut health.
Research and innovation are playing a major role in the growth of the probiotic desserts market, providing new insights into the health benefits of probiotics, and increasing the understanding of their role in promoting gut health. Research and innovation have also led to the development of new and improved probiotic strains, as well as improved methods for incorporating probiotics into food such as probiotic desserts. This enables the production of high-quality probiotic desserts that are both delicious and effective in improving gut health.
Innovations in food technology have also enabled the production of probiotic desserts that are more affordable and convenient for consumers, such as on-the-go probiotic snacks and portable probiotic drinks. This has helped make probiotics more accessible and convenient for busy consumers looking for a quick and easy way to incorporate probiotics into their diet. Moreover, research and innovation have also helped increase awareness and awareness of probiotic desserts through marketing and advertising by manufacturers and retailers. This has helped increase awareness of the benefits of probiotics and drive demand for these products as more consumers show interest in including probiotics in their diet.
Moreover, people's hectic lifestyles have increased the demand for probiotics in the market for several reasons. First, the fast pace of modern life and the convenience of processed and packaged food force many people to consume diets high in sugar, salt and unhealthy fats, leading to digestive and other health problems. Probiotics provide a natural solution to these problems by restoring the balance of beneficial bacteria in the gut that are important for health.
The recent surge in e-commerce has significantly increased the demand for probiotic desserts in the market. With the rise of online shopping and home delivery, more consumers are purchasing healthier food, including probiotic-rich desserts, over the internet. Known for their gut health benefits, probiotics have become a hot trend in the food industry, and the demand for probiotic desserts is no exception. As consumers become more aware of the health benefits of probiotics, they are looking for tasty and nutritious food. This has led to an increase in the number of e-commerce platforms offering probiotic desserts ranging from yogurt and kefir to ice cream and brownies. The convenience of online shopping and home delivery has made it easier for consumers to access these products, fueling the growing demand for probiotic desserts in the market.
The global probiotic desserts market is segmented on the basis of type, application, distribution channel, and region. According to type, the market is categorized into dairy-based and plant-based. Depending on the application, the probiotic desserts market is fragmented into yogurt, kefir, ice cream and others. By distribution channel, it is divided into supermarket and hypermarket, specialty stores, e-commerce, and others. Region-wise, the market is analyzed across North America (the U.S., Canada, and Mexico), Europe (Germany, UK, France, Russia, France, Spain, Italy, and the rest of Europe), Asia-Pacific (China, Japan, South Korea, India, Australia, and rest of Asia-Pacific), and LAMEA (Brazil, UAE, Argentina, Saudi Arabia, South Africa, and rest of LAMEA).
The major players operating in the global probiotic desserts market are Lancashire Farm, Sovos Brands, Inc., General Mills, Inc., Chobani Global Holdings, LLC, Danone Inc., Fonterra Co-operative Group Limited, Meiji Holdings Co., Ltd., National Dairy Development Board, Yofix, and Forager Project.

Key Benefits For Stakeholders

●This report provides a quantitative analysis of the market segments, current trends, estimations, and dynamics of the probiotic desserts market analysis from 2021 to 2031 to identify the prevailing probiotic desserts market opportunities.
●The market research is offered along with information related to key drivers, restraints, and opportunities.
●Porter's five forces analysis highlights the potency of buyers and suppliers to enable stakeholders make profit-oriented business decisions and strengthen their supplier-buyer network.
●In-depth analysis of the probiotic desserts market segmentation assists to determine the prevailing market opportunities.
●Major countries in each region are mapped according to their revenue contribution to the global market.
●Market player positioning facilitates benchmarking and provides a clear understanding of the present position of the market players.
●The report includes the analysis of the regional as well as global probiotic desserts market trends, key players, market segments, application areas, and market growth strategies.
Key Market Segments
○ Forager Projec

Scope of Probiotic Desserts Market Report

Report Metric Details
Report Name Probiotic Desserts Market
Accounted market size in 2021 $ 680.71 million
Forecasted market size in 2031 $ 1.4 billion
CAGR 7.2%
Base Year 2021
Forecasted years 2024 - 2031
By Application ● Yogurt
● Kefir
● Ice Cream
● Others
By Distribution Channel ● Ecommerce
● Specialty Store
● Hypermarket and Supermarket
● Others
By Type ● Dairy Based
● Plant Based
By Region
  • North America (United States, Canada)
  • Europe (Germany, France, UK, Italy, Russia) Rest of Europe
  • Nordic Countries
  • Asia-Pacific (China, Japan, South Korea)
  • Southeast Asia (India, Australia)
  • Rest of Asia
  • Latin America (Mexico, Brazil)
  • Rest of Latin America
  • Middle East & Africa (Turkey, Saudi Arabia, UAE, Rest of MEA)
Forecast units USD million in value
Report coverage Revenue and volume forecast, company share, competitive landscape, growth factors and trends

FAQ for this report

How fast is Probiotic Desserts Market growing?

Ans: The Probiotic Desserts Market witnessing a CAGR of 7.2% during the forecast period 2024-2031.

What is the Probiotic Desserts Market size in 2031?

Ans: The Probiotic Desserts Market size in 2031 will be $ 1.4 billion.

What are the Application segmentation covered in the Probiotic Desserts Market report?

Ans: The Applications covered in the Probiotic Desserts Market report are ● Yogurt, ● Kefir, ● Ice Cream, ● Others

What are the Type segmentation covered in the Probiotic Desserts Market report?

Ans: The Types covered in the Probiotic Desserts Market report are ● Dairy Based, ● Plant Based

CHAPTER 1: INTRODUCTION
1.1. Report description
1.2. Key market segments
1.3. Key benefits to the stakeholders
1.4. Research Methodology
1.4.1. Primary research
1.4.2. Secondary research
1.4.3. Analyst tools and models
CHAPTER 2: EXECUTIVE SUMMARY
2.1. CXO Perspective
CHAPTER 3: MARKET OVERVIEW
3.1. Market definition and scope
3.2. Key findings
3.2.1. Top impacting factors
3.2.2. Top investment pockets
3.3. Porter’s five forces analysis
3.3.1. Bargaining power of suppliers
3.3.2. Bargaining power of buyers
3.3.3. Threat of substitutes
3.3.4. Threat of new entrants
3.3.5. Intensity of rivalry
3.4. Market dynamics
3.4.1. Drivers
3.4.1.1. Rise in consumption of functional food
3.4.1.2. Creative flavors offering
3.4.1.3. Focus on gut health
3.4.2. Restraints
3.4.2.1. Low awareness level among consumers about effectiveness of probiotic products
3.4.2.2. Government regulations
3.4.3. Opportunities
3.4.3.1. Increased awareness about the benefits of probiotic desserts
3.4.3.2. Rising demand of probiotic products in developing nations
3.5. COVID-19 Impact Analysis on the market
CHAPTER 4: PROBIOTIC DESSERTS MARKET, BY TYPE
4.1. Overview
4.1.1. Market size and forecast
4.2. Dairy Based
4.2.1. Key market trends, growth factors and opportunities
4.2.2. Market size and forecast, by region
4.2.3. Market share analysis by country
4.3. Plant Based
4.3.1. Key market trends, growth factors and opportunities
4.3.2. Market size and forecast, by region
4.3.3. Market share analysis by country
CHAPTER 5: PROBIOTIC DESSERTS MARKET, BY APPLICATION
5.1. Overview
5.1.1. Market size and forecast
5.2. Yogurt
5.2.1. Key market trends, growth factors and opportunities
5.2.2. Market size and forecast, by region
5.2.3. Market share analysis by country
5.3. Kefir
5.3.1. Key market trends, growth factors and opportunities
5.3.2. Market size and forecast, by region
5.3.3. Market share analysis by country
5.4. Ice Cream
5.4.1. Key market trends, growth factors and opportunities
5.4.2. Market size and forecast, by region
5.4.3. Market share analysis by country
5.5. Others
5.5.1. Key market trends, growth factors and opportunities
5.5.2. Market size and forecast, by region
5.5.3. Market share analysis by country
CHAPTER 6: PROBIOTIC DESSERTS MARKET, BY DISTRIBUTION CHANNEL
6.1. Overview
6.1.1. Market size and forecast
6.2. Ecommerce
6.2.1. Key market trends, growth factors and opportunities
6.2.2. Market size and forecast, by region
6.2.3. Market share analysis by country
6.3. Specialty Store
6.3.1. Key market trends, growth factors and opportunities
6.3.2. Market size and forecast, by region
6.3.3. Market share analysis by country
6.4. Hypermarket and Supermarket
6.4.1. Key market trends, growth factors and opportunities
6.4.2. Market size and forecast, by region
6.4.3. Market share analysis by country
6.5. Others
6.5.1. Key market trends, growth factors and opportunities
6.5.2. Market size and forecast, by region
6.5.3. Market share analysis by country
CHAPTER 7: PROBIOTIC DESSERTS MARKET, BY REGION
7.1. Overview
7.1.1. Market size and forecast By Region
7.2. North America
7.2.1. Key trends and opportunities
7.2.2. Market size and forecast, by Type
7.2.3. Market size and forecast, by Application
7.2.4. Market size and forecast, by Distribution Channel
7.2.5. Market size and forecast, by country
7.2.5.1. U.S.
7.2.5.1.1. Key market trends, growth factors and opportunities
7.2.5.1.2. Market size and forecast, by Type
7.2.5.1.3. Market size and forecast, by Application
7.2.5.1.4. Market size and forecast, by Distribution Channel
7.2.5.2. Canada
7.2.5.2.1. Key market trends, growth factors and opportunities
7.2.5.2.2. Market size and forecast, by Type
7.2.5.2.3. Market size and forecast, by Application
7.2.5.2.4. Market size and forecast, by Distribution Channel
7.2.5.3. Mexico
7.2.5.3.1. Key market trends, growth factors and opportunities
7.2.5.3.2. Market size and forecast, by Type
7.2.5.3.3. Market size and forecast, by Application
7.2.5.3.4. Market size and forecast, by Distribution Channel
7.3. Europe
7.3.1. Key trends and opportunities
7.3.2. Market size and forecast, by Type
7.3.3. Market size and forecast, by Application
7.3.4. Market size and forecast, by Distribution Channel
7.3.5. Market size and forecast, by country
7.3.5.1. Germany
7.3.5.1.1. Key market trends, growth factors and opportunities
7.3.5.1.2. Market size and forecast, by Type
7.3.5.1.3. Market size and forecast, by Application
7.3.5.1.4. Market size and forecast, by Distribution Channel
7.3.5.2. UK
7.3.5.2.1. Key market trends, growth factors and opportunities
7.3.5.2.2. Market size and forecast, by Type
7.3.5.2.3. Market size and forecast, by Application
7.3.5.2.4. Market size and forecast, by Distribution Channel
7.3.5.3. France
7.3.5.3.1. Key market trends, growth factors and opportunities
7.3.5.3.2. Market size and forecast, by Type
7.3.5.3.3. Market size and forecast, by Application
7.3.5.3.4. Market size and forecast, by Distribution Channel
7.3.5.4. Russia
7.3.5.4.1. Key market trends, growth factors and opportunities
7.3.5.4.2. Market size and forecast, by Type
7.3.5.4.3. Market size and forecast, by Application
7.3.5.4.4. Market size and forecast, by Distribution Channel
7.3.5.5. Spain
7.3.5.5.1. Key market trends, growth factors and opportunities
7.3.5.5.2. Market size and forecast, by Type
7.3.5.5.3. Market size and forecast, by Application
7.3.5.5.4. Market size and forecast, by Distribution Channel
7.3.5.6. Netherlands
7.3.5.6.1. Key market trends, growth factors and opportunities
7.3.5.6.2. Market size and forecast, by Type
7.3.5.6.3. Market size and forecast, by Application
7.3.5.6.4. Market size and forecast, by Distribution Channel
7.3.5.7. Rest of Europe
7.3.5.7.1. Key market trends, growth factors and opportunities
7.3.5.7.2. Market size and forecast, by Type
7.3.5.7.3. Market size and forecast, by Application
7.3.5.7.4. Market size and forecast, by Distribution Channel
7.4. Asia-Pacific
7.4.1. Key trends and opportunities
7.4.2. Market size and forecast, by Type
7.4.3. Market size and forecast, by Application
7.4.4. Market size and forecast, by Distribution Channel
7.4.5. Market size and forecast, by country
7.4.5.1. China
7.4.5.1.1. Key market trends, growth factors and opportunities
7.4.5.1.2. Market size and forecast, by Type
7.4.5.1.3. Market size and forecast, by Application
7.4.5.1.4. Market size and forecast, by Distribution Channel
7.4.5.2. Japan
7.4.5.2.1. Key market trends, growth factors and opportunities
7.4.5.2.2. Market size and forecast, by Type
7.4.5.2.3. Market size and forecast, by Application
7.4.5.2.4. Market size and forecast, by Distribution Channel
7.4.5.3. South Korea
7.4.5.3.1. Key market trends, growth factors and opportunities
7.4.5.3.2. Market size and forecast, by Type
7.4.5.3.3. Market size and forecast, by Application
7.4.5.3.4. Market size and forecast, by Distribution Channel
7.4.5.4. India
7.4.5.4.1. Key market trends, growth factors and opportunities
7.4.5.4.2. Market size and forecast, by Type
7.4.5.4.3. Market size and forecast, by Application
7.4.5.4.4. Market size and forecast, by Distribution Channel
7.4.5.5. Australia
7.4.5.5.1. Key market trends, growth factors and opportunities
7.4.5.5.2. Market size and forecast, by Type
7.4.5.5.3. Market size and forecast, by Application
7.4.5.5.4. Market size and forecast, by Distribution Channel
7.4.5.6. Rest of Asia-Pacific
7.4.5.6.1. Key market trends, growth factors and opportunities
7.4.5.6.2. Market size and forecast, by Type
7.4.5.6.3. Market size and forecast, by Application
7.4.5.6.4. Market size and forecast, by Distribution Channel
7.5. LAMEA
7.5.1. Key trends and opportunities
7.5.2. Market size and forecast, by Type
7.5.3. Market size and forecast, by Application
7.5.4. Market size and forecast, by Distribution Channel
7.5.5. Market size and forecast, by country
7.5.5.1. Brazil
7.5.5.1.1. Key market trends, growth factors and opportunities
7.5.5.1.2. Market size and forecast, by Type
7.5.5.1.3. Market size and forecast, by Application
7.5.5.1.4. Market size and forecast, by Distribution Channel
7.5.5.2. Argentina
7.5.5.2.1. Key market trends, growth factors and opportunities
7.5.5.2.2. Market size and forecast, by Type
7.5.5.2.3. Market size and forecast, by Application
7.5.5.2.4. Market size and forecast, by Distribution Channel
7.5.5.3. UAE
7.5.5.3.1. Key market trends, growth factors and opportunities
7.5.5.3.2. Market size and forecast, by Type
7.5.5.3.3. Market size and forecast, by Application
7.5.5.3.4. Market size and forecast, by Distribution Channel
7.5.5.4. South Africa
7.5.5.4.1. Key market trends, growth factors and opportunities
7.5.5.4.2. Market size and forecast, by Type
7.5.5.4.3. Market size and forecast, by Application
7.5.5.4.4. Market size and forecast, by Distribution Channel
7.5.5.5. Rest of LAMEA
7.5.5.5.1. Key market trends, growth factors and opportunities
7.5.5.5.2. Market size and forecast, by Type
7.5.5.5.3. Market size and forecast, by Application
7.5.5.5.4. Market size and forecast, by Distribution Channel
CHAPTER 8: COMPETITIVE LANDSCAPE
8.1. Introduction
8.2. Top winning strategies
8.3. Product Mapping of Top 10 Player
8.4. Competitive Dashboard
8.5. Competitive Heatmap
8.6. Top player positioning, 2021
CHAPTER 9: COMPANY PROFILES
9.1. Sovos Brands, Inc.
9.1.1. Company overview
9.1.2. Key Executives
9.1.3. Company snapshot
9.1.4. Operating business segments
9.1.5. Product portfolio
9.1.6. Business performance
9.1.7. Key strategic moves and developments
9.2. General Mills, Inc.
9.2.1. Company overview
9.2.2. Key Executives
9.2.3. Company snapshot
9.2.4. Operating business segments
9.2.5. Product portfolio
9.2.6. Business performance
9.2.7. Key strategic moves and developments
9.3. Chobani Global Holdings, LLC
9.3.1. Company overview
9.3.2. Key Executives
9.3.3. Company snapshot
9.3.4. Operating business segments
9.3.5. Product portfolio
9.3.6. Key strategic moves and developments
9.4. Danone Inc.
9.4.1. Company overview
9.4.2. Key Executives
9.4.3. Company snapshot
9.4.4. Operating business segments
9.4.5. Product portfolio
9.4.6. Business performance
9.4.7. Key strategic moves and developments
9.5. Fonterra Co-operative Group Limited
9.5.1. Company overview
9.5.2. Key Executives
9.5.3. Company snapshot
9.5.4. Operating business segments
9.5.5. Product portfolio
9.5.6. Business performance
9.6. Meiji Holdings Co., Ltd.
9.6.1. Company overview
9.6.2. Key Executives
9.6.3. Company snapshot
9.6.4. Operating business segments
9.6.5. Product portfolio
9.6.6. Business performance
9.6.7. Key strategic moves and developments
9.7. National Dairy Development Board.
9.7.1. Company overview
9.7.2. Key Executives
9.7.3. Company snapshot
9.7.4. Operating business segments
9.7.5. Product portfolio
9.7.6. Business performance
9.7.7. Key strategic moves and developments
9.8. Yofix
9.8.1. Company overview
9.8.2. Key Executives
9.8.3. Company snapshot
9.8.4. Operating business segments
9.8.5. Product portfolio
9.8.6. Key strategic moves and developments
9.9. Forager Project
9.9.1. Company overview
9.9.2. Key Executives
9.9.3. Company snapshot
9.9.4. Operating business segments
9.9.5. Product portfolio
9.9.6. Key strategic moves and developments
9.10. Lancashire Farm
9.10.1. Company overview
9.10.2. Key Executives
9.10.3. Company snapshot
9.10.4. Operating business segments
9.10.5. Product portfolio
9.10.6. Key strategic moves and development
LIST OF TABLES
TABLE 01. GLOBAL PROBIOTIC DESSERTS MARKET, BY TYPE, 2021-2031 ($MILLION)
TABLE 02. PROBIOTIC DESSERTS MARKET FOR DAIRY BASED, BY REGION, 2021-2031 ($MILLION)
TABLE 03. PROBIOTIC DESSERTS MARKET FOR PLANT BASED, BY REGION, 2021-2031 ($MILLION)
TABLE 04. GLOBAL PROBIOTIC DESSERTS MARKET, BY APPLICATION, 2021-2031 ($MILLION)
TABLE 05. PROBIOTIC DESSERTS MARKET FOR YOGURT, BY REGION, 2021-2031 ($MILLION)
TABLE 06. PROBIOTIC DESSERTS MARKET FOR KEFIR, BY REGION, 2021-2031 ($MILLION)
TABLE 07. PROBIOTIC DESSERTS MARKET FOR ICE CREAM, BY REGION, 2021-2031 ($MILLION)
TABLE 08. PROBIOTIC DESSERTS MARKET FOR OTHERS, BY REGION, 2021-2031 ($MILLION)
TABLE 09. GLOBAL PROBIOTIC DESSERTS MARKET, BY DISTRIBUTION CHANNEL, 2021-2031 ($MILLION)
TABLE 10. PROBIOTIC DESSERTS MARKET FOR ECOMMERCE, BY REGION, 2021-2031 ($MILLION)
TABLE 11. PROBIOTIC DESSERTS MARKET FOR SPECIALTY STORE, BY REGION, 2021-2031 ($MILLION)
TABLE 12. PROBIOTIC DESSERTS MARKET FOR HYPERMARKET AND SUPERMARKET, BY REGION, 2021-2031 ($MILLION)
TABLE 13. PROBIOTIC DESSERTS MARKET FOR OTHERS, BY REGION, 2021-2031 ($MILLION)
TABLE 14. PROBIOTIC DESSERTS MARKET, BY REGION, 2021-2031 ($MILLION)
TABLE 15. NORTH AMERICA PROBIOTIC DESSERTS MARKET, BY TYPE, 2021-2031 ($MILLION)
TABLE 16. NORTH AMERICA PROBIOTIC DESSERTS MARKET, BY APPLICATION, 2021-2031 ($MILLION)
TABLE 17. NORTH AMERICA PROBIOTIC DESSERTS MARKET, BY DISTRIBUTION CHANNEL, 2021-2031 ($MILLION)
TABLE 18. NORTH AMERICA PROBIOTIC DESSERTS MARKET, BY COUNTRY, 2021-2031 ($MILLION)
TABLE 19. U.S. PROBIOTIC DESSERTS MARKET, BY TYPE, 2021-2031 ($MILLION)
TABLE 20. U.S. PROBIOTIC DESSERTS MARKET, BY APPLICATION, 2021-2031 ($MILLION)
TABLE 21. U.S. PROBIOTIC DESSERTS MARKET, BY DISTRIBUTION CHANNEL, 2021-2031 ($MILLION)
TABLE 22. CANADA PROBIOTIC DESSERTS MARKET, BY TYPE, 2021-2031 ($MILLION)
TABLE 23. CANADA PROBIOTIC DESSERTS MARKET, BY APPLICATION, 2021-2031 ($MILLION)
TABLE 24. CANADA PROBIOTIC DESSERTS MARKET, BY DISTRIBUTION CHANNEL, 2021-2031 ($MILLION)
TABLE 25. MEXICO PROBIOTIC DESSERTS MARKET, BY TYPE, 2021-2031 ($MILLION)
TABLE 26. MEXICO PROBIOTIC DESSERTS MARKET, BY APPLICATION, 2021-2031 ($MILLION)
TABLE 27. MEXICO PROBIOTIC DESSERTS MARKET, BY DISTRIBUTION CHANNEL, 2021-2031 ($MILLION)
TABLE 28. EUROPE PROBIOTIC DESSERTS MARKET, BY TYPE, 2021-2031 ($MILLION)
TABLE 29. EUROPE PROBIOTIC DESSERTS MARKET, BY APPLICATION, 2021-2031 ($MILLION)
TABLE 30. EUROPE PROBIOTIC DESSERTS MARKET, BY DISTRIBUTION CHANNEL, 2021-2031 ($MILLION)
TABLE 31. EUROPE PROBIOTIC DESSERTS MARKET, BY COUNTRY, 2021-2031 ($MILLION)
TABLE 32. GERMANY PROBIOTIC DESSERTS MARKET, BY TYPE, 2021-2031 ($MILLION)
TABLE 33. GERMANY PROBIOTIC DESSERTS MARKET, BY APPLICATION, 2021-2031 ($MILLION)
TABLE 34. GERMANY PROBIOTIC DESSERTS MARKET, BY DISTRIBUTION CHANNEL, 2021-2031 ($MILLION)
TABLE 35. UK PROBIOTIC DESSERTS MARKET, BY TYPE, 2021-2031 ($MILLION)
TABLE 36. UK PROBIOTIC DESSERTS MARKET, BY APPLICATION, 2021-2031 ($MILLION)
TABLE 37. UK PROBIOTIC DESSERTS MARKET, BY DISTRIBUTION CHANNEL, 2021-2031 ($MILLION)
TABLE 38. FRANCE PROBIOTIC DESSERTS MARKET, BY TYPE, 2021-2031 ($MILLION)
TABLE 39. FRANCE PROBIOTIC DESSERTS MARKET, BY APPLICATION, 2021-2031 ($MILLION)
TABLE 40. FRANCE PROBIOTIC DESSERTS MARKET, BY DISTRIBUTION CHANNEL, 2021-2031 ($MILLION)
TABLE 41. RUSSIA PROBIOTIC DESSERTS MARKET, BY TYPE, 2021-2031 ($MILLION)
TABLE 42. RUSSIA PROBIOTIC DESSERTS MARKET, BY APPLICATION, 2021-2031 ($MILLION)
TABLE 43. RUSSIA PROBIOTIC DESSERTS MARKET, BY DISTRIBUTION CHANNEL, 2021-2031 ($MILLION)
TABLE 44. SPAIN PROBIOTIC DESSERTS MARKET, BY TYPE, 2021-2031 ($MILLION)
TABLE 45. SPAIN PROBIOTIC DESSERTS MARKET, BY APPLICATION, 2021-2031 ($MILLION)
TABLE 46. SPAIN PROBIOTIC DESSERTS MARKET, BY DISTRIBUTION CHANNEL, 2021-2031 ($MILLION)
TABLE 47. NETHERLANDS PROBIOTIC DESSERTS MARKET, BY TYPE, 2021-2031 ($MILLION)
TABLE 48. NETHERLANDS PROBIOTIC DESSERTS MARKET, BY APPLICATION, 2021-2031 ($MILLION)
TABLE 49. NETHERLANDS PROBIOTIC DESSERTS MARKET, BY DISTRIBUTION CHANNEL, 2021-2031 ($MILLION)
TABLE 50. REST OF EUROPE PROBIOTIC DESSERTS MARKET, BY TYPE, 2021-2031 ($MILLION)
TABLE 51. REST OF EUROPE PROBIOTIC DESSERTS MARKET, BY APPLICATION, 2021-2031 ($MILLION)
TABLE 52. REST OF EUROPE PROBIOTIC DESSERTS MARKET, BY DISTRIBUTION CHANNEL, 2021-2031 ($MILLION)
TABLE 53. ASIA-PACIFIC PROBIOTIC DESSERTS MARKET, BY TYPE, 2021-2031 ($MILLION)
TABLE 54. ASIA-PACIFIC PROBIOTIC DESSERTS MARKET, BY APPLICATION, 2021-2031 ($MILLION)
TABLE 55. ASIA-PACIFIC PROBIOTIC DESSERTS MARKET, BY DISTRIBUTION CHANNEL, 2021-2031 ($MILLION)
TABLE 56. ASIA-PACIFIC PROBIOTIC DESSERTS MARKET, BY COUNTRY, 2021-2031 ($MILLION)
TABLE 57. CHINA PROBIOTIC DESSERTS MARKET, BY TYPE, 2021-2031 ($MILLION)
TABLE 58. CHINA PROBIOTIC DESSERTS MARKET, BY APPLICATION, 2021-2031 ($MILLION)
TABLE 59. CHINA PROBIOTIC DESSERTS MARKET, BY DISTRIBUTION CHANNEL, 2021-2031 ($MILLION)
TABLE 60. JAPAN PROBIOTIC DESSERTS MARKET, BY TYPE, 2021-2031 ($MILLION)
TABLE 61. JAPAN PROBIOTIC DESSERTS MARKET, BY APPLICATION, 2021-2031 ($MILLION)
TABLE 62. JAPAN PROBIOTIC DESSERTS MARKET, BY DISTRIBUTION CHANNEL, 2021-2031 ($MILLION)
TABLE 63. SOUTH KOREA PROBIOTIC DESSERTS MARKET, BY TYPE, 2021-2031 ($MILLION)
TABLE 64. SOUTH KOREA PROBIOTIC DESSERTS MARKET, BY APPLICATION, 2021-2031 ($MILLION)
TABLE 65. SOUTH KOREA PROBIOTIC DESSERTS MARKET, BY DISTRIBUTION CHANNEL, 2021-2031 ($MILLION)
TABLE 66. INDIA PROBIOTIC DESSERTS MARKET, BY TYPE, 2021-2031 ($MILLION)
TABLE 67. INDIA PROBIOTIC DESSERTS MARKET, BY APPLICATION, 2021-2031 ($MILLION)
TABLE 68. INDIA PROBIOTIC DESSERTS MARKET, BY DISTRIBUTION CHANNEL, 2021-2031 ($MILLION)
TABLE 69. AUSTRALIA PROBIOTIC DESSERTS MARKET, BY TYPE, 2021-2031 ($MILLION)
TABLE 70. AUSTRALIA PROBIOTIC DESSERTS MARKET, BY APPLICATION, 2021-2031 ($MILLION)
TABLE 71. AUSTRALIA PROBIOTIC DESSERTS MARKET, BY DISTRIBUTION CHANNEL, 2021-2031 ($MILLION)
TABLE 72. REST OF ASIA-PACIFIC PROBIOTIC DESSERTS MARKET, BY TYPE, 2021-2031 ($MILLION)
TABLE 73. REST OF ASIA-PACIFIC PROBIOTIC DESSERTS MARKET, BY APPLICATION, 2021-2031 ($MILLION)
TABLE 74. REST OF ASIA-PACIFIC PROBIOTIC DESSERTS MARKET, BY DISTRIBUTION CHANNEL, 2021-2031 ($MILLION)
TABLE 75. LAMEA PROBIOTIC DESSERTS MARKET, BY TYPE, 2021-2031 ($MILLION)
TABLE 76. LAMEA PROBIOTIC DESSERTS MARKET, BY APPLICATION, 2021-2031 ($MILLION)
TABLE 77. LAMEA PROBIOTIC DESSERTS MARKET, BY DISTRIBUTION CHANNEL, 2021-2031 ($MILLION)
TABLE 78. LAMEA PROBIOTIC DESSERTS MARKET, BY COUNTRY, 2021-2031 ($MILLION)
TABLE 79. BRAZIL PROBIOTIC DESSERTS MARKET, BY TYPE, 2021-2031 ($MILLION)
TABLE 80. BRAZIL PROBIOTIC DESSERTS MARKET, BY APPLICATION, 2021-2031 ($MILLION)
TABLE 81. BRAZIL PROBIOTIC DESSERTS MARKET, BY DISTRIBUTION CHANNEL, 2021-2031 ($MILLION)
TABLE 82. ARGENTINA PROBIOTIC DESSERTS MARKET, BY TYPE, 2021-2031 ($MILLION)
TABLE 83. ARGENTINA PROBIOTIC DESSERTS MARKET, BY APPLICATION, 2021-2031 ($MILLION)
TABLE 84. ARGENTINA PROBIOTIC DESSERTS MARKET, BY DISTRIBUTION CHANNEL, 2021-2031 ($MILLION)
TABLE 85. UAE PROBIOTIC DESSERTS MARKET, BY TYPE, 2021-2031 ($MILLION)
TABLE 86. UAE PROBIOTIC DESSERTS MARKET, BY APPLICATION, 2021-2031 ($MILLION)
TABLE 87. UAE PROBIOTIC DESSERTS MARKET, BY DISTRIBUTION CHANNEL, 2021-2031 ($MILLION)
TABLE 88. SOUTH AFRICA PROBIOTIC DESSERTS MARKET, BY TYPE, 2021-2031 ($MILLION)
TABLE 89. SOUTH AFRICA PROBIOTIC DESSERTS MARKET, BY APPLICATION, 2021-2031 ($MILLION)
TABLE 90. SOUTH AFRICA PROBIOTIC DESSERTS MARKET, BY DISTRIBUTION CHANNEL, 2021-2031 ($MILLION)
TABLE 91. REST OF LAMEA PROBIOTIC DESSERTS MARKET, BY TYPE, 2021-2031 ($MILLION)
TABLE 92. REST OF LAMEA PROBIOTIC DESSERTS MARKET, BY APPLICATION, 2021-2031 ($MILLION)
TABLE 93. REST OF LAMEA PROBIOTIC DESSERTS MARKET, BY DISTRIBUTION CHANNEL, 2021-2031 ($MILLION)
TABLE 94. SOVOS BRANDS, INC.: KEY EXECUTIVES
TABLE 95. SOVOS BRANDS, INC.: COMPANY SNAPSHOT
TABLE 96. SOVOS BRANDS, INC.: PRODUCT SEGMENTS
TABLE 97. SOVOS BRANDS, INC.: PRODUCT PORTFOLIO
TABLE 98. SOVOS BRANDS, INC.: KEY STRATERGIES
TABLE 99. GENERAL MILLS, INC.: KEY EXECUTIVES
TABLE 100. GENERAL MILLS, INC.: COMPANY SNAPSHOT
TABLE 101. GENERAL MILLS, INC.: PRODUCT SEGMENTS
TABLE 102. GENERAL MILLS, INC.: PRODUCT PORTFOLIO
TABLE 103. GENERAL MILLS, INC.: KEY STRATERGIES
TABLE 104. CHOBANI GLOBAL HOLDINGS, LLC: KEY EXECUTIVES
TABLE 105. CHOBANI GLOBAL HOLDINGS, LLC: COMPANY SNAPSHOT
TABLE 106. CHOBANI GLOBAL HOLDINGS, LLC: PRODUCT SEGMENTS
TABLE 107. CHOBANI GLOBAL HOLDINGS, LLC: PRODUCT PORTFOLIO
TABLE 108. CHOBANI GLOBAL HOLDINGS, LLC: KEY STRATERGIES
TABLE 109. DANONE INC.: KEY EXECUTIVES
TABLE 110. DANONE INC.: COMPANY SNAPSHOT
TABLE 111. DANONE INC.: PRODUCT SEGMENTS
TABLE 112. DANONE INC.: PRODUCT PORTFOLIO
TABLE 113. DANONE INC.: KEY STRATERGIES
TABLE 114. FONTERRA CO-OPERATIVE GROUP LIMITED: KEY EXECUTIVES
TABLE 115. FONTERRA CO-OPERATIVE GROUP LIMITED: COMPANY SNAPSHOT
TABLE 116. FONTERRA CO-OPERATIVE GROUP LIMITED: PRODUCT SEGMENTS
TABLE 117. FONTERRA CO-OPERATIVE GROUP LIMITED: PRODUCT PORTFOLIO
TABLE 118. MEIJI HOLDINGS CO., LTD.: KEY EXECUTIVES
TABLE 119. MEIJI HOLDINGS CO., LTD.: COMPANY SNAPSHOT
TABLE 120. MEIJI HOLDINGS CO., LTD.: PRODUCT SEGMENTS
TABLE 121. MEIJI HOLDINGS CO., LTD.: PRODUCT PORTFOLIO
TABLE 122. MEIJI HOLDINGS CO., LTD.: KEY STRATERGIES
TABLE 123. NATIONAL DAIRY DEVELOPMENT BOARD.: KEY EXECUTIVES
TABLE 124. NATIONAL DAIRY DEVELOPMENT BOARD.: COMPANY SNAPSHOT
TABLE 125. NATIONAL DAIRY DEVELOPMENT BOARD.: PRODUCT SEGMENTS
TABLE 126. NATIONAL DAIRY DEVELOPMENT BOARD.: PRODUCT PORTFOLIO
TABLE 127. NATIONAL DAIRY DEVELOPMENT BOARD.: KEY STRATERGIES
TABLE 128. YOFIX: KEY EXECUTIVES
TABLE 129. YOFIX: COMPANY SNAPSHOT
TABLE 130. YOFIX: PRODUCT SEGMENTS
TABLE 131. YOFIX: PRODUCT PORTFOLIO
TABLE 132. YOFIX: KEY STRATERGIES
TABLE 133. FORAGER PROJECT: KEY EXECUTIVES
TABLE 134. FORAGER PROJECT: COMPANY SNAPSHOT
TABLE 135. FORAGER PROJECT: PRODUCT SEGMENTS
TABLE 136. FORAGER PROJECT: PRODUCT PORTFOLIO
TABLE 137. FORAGER PROJECT: KEY STRATERGIES
TABLE 138. LANCASHIRE FARM: KEY EXECUTIVES
TABLE 139. LANCASHIRE FARM: COMPANY SNAPSHOT
TABLE 140. LANCASHIRE FARM: PRODUCT SEGMENTS
TABLE 141. LANCASHIRE FARM: PRODUCT PORTFOLIO
TABLE 142. LANCASHIRE FARM: KEY STRATERGIES LIST OF FIGURES
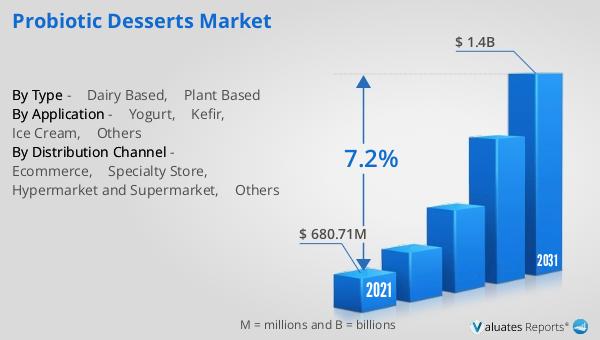
FIGURE 01. PROBIOTIC DESSERTS MARKET, 2021-2031
FIGURE 02. SEGMENTATION OF PROBIOTIC DESSERTS MARKET, 2021-2031
FIGURE 03. TOP INVESTMENT POCKETS IN PROBIOTIC DESSERTS MARKET (2022-2031)
FIGURE 04. MODERATE BARGAINING POWER OF SUPPLIERS
FIGURE 05. MODERATE BARGAINING POWER OF BUYERS
FIGURE 06. MODERATE THREAT OF SUBSTITUTES
FIGURE 07. MODERATE THREAT OF NEW ENTRANTS
FIGURE 08. LOW INTENSITY OF RIVALRY
FIGURE 09. DRIVERS, RESTRAINTS AND OPPORTUNITIES: GLOBALPROBIOTIC DESSERTS MARKET
FIGURE 10. PROBIOTIC DESSERTS MARKET, BY TYPE, 2021(%)
FIGURE 11. COMPARATIVE SHARE ANALYSIS OF PROBIOTIC DESSERTS MARKET FOR DAIRY BASED, BY COUNTRY 2021 AND 2031(%)
FIGURE 12. COMPARATIVE SHARE ANALYSIS OF PROBIOTIC DESSERTS MARKET FOR PLANT BASED, BY COUNTRY 2021 AND 2031(%)
FIGURE 13. PROBIOTIC DESSERTS MARKET, BY APPLICATION, 2021(%)
FIGURE 14. COMPARATIVE SHARE ANALYSIS OF PROBIOTIC DESSERTS MARKET FOR YOGURT, BY COUNTRY 2021 AND 2031(%)
FIGURE 15. COMPARATIVE SHARE ANALYSIS OF PROBIOTIC DESSERTS MARKET FOR KEFIR, BY COUNTRY 2021 AND 2031(%)
FIGURE 16. COMPARATIVE SHARE ANALYSIS OF PROBIOTIC DESSERTS MARKET FOR ICE CREAM, BY COUNTRY 2021 AND 2031(%)
FIGURE 17. COMPARATIVE SHARE ANALYSIS OF PROBIOTIC DESSERTS MARKET FOR OTHERS, BY COUNTRY 2021 AND 2031(%)
FIGURE 18. PROBIOTIC DESSERTS MARKET, BY DISTRIBUTION CHANNEL, 2021(%)
FIGURE 19. COMPARATIVE SHARE ANALYSIS OF PROBIOTIC DESSERTS MARKET FOR ECOMMERCE, BY COUNTRY 2021 AND 2031(%)
FIGURE 20. COMPARATIVE SHARE ANALYSIS OF PROBIOTIC DESSERTS MARKET FOR SPECIALTY STORE, BY COUNTRY 2021 AND 2031(%)
FIGURE 21. COMPARATIVE SHARE ANALYSIS OF PROBIOTIC DESSERTS MARKET FOR HYPERMARKET AND SUPERMARKET, BY COUNTRY 2021 AND 2031(%)
FIGURE 22. COMPARATIVE SHARE ANALYSIS OF PROBIOTIC DESSERTS MARKET FOR OTHERS, BY COUNTRY 2021 AND 2031(%)
FIGURE 23. PROBIOTIC DESSERTS MARKET BY REGION, 2021
FIGURE 24. U.S. PROBIOTIC DESSERTS MARKET, 2021-2031 ($MILLION)
FIGURE 25. CANADA PROBIOTIC DESSERTS MARKET, 2021-2031 ($MILLION)
FIGURE 26. MEXICO PROBIOTIC DESSERTS MARKET, 2021-2031 ($MILLION)
FIGURE 27. GERMANY PROBIOTIC DESSERTS MARKET, 2021-2031 ($MILLION)
FIGURE 28. UK PROBIOTIC DESSERTS MARKET, 2021-2031 ($MILLION)
FIGURE 29. FRANCE PROBIOTIC DESSERTS MARKET, 2021-2031 ($MILLION)
FIGURE 30. RUSSIA PROBIOTIC DESSERTS MARKET, 2021-2031 ($MILLION)
FIGURE 31. SPAIN PROBIOTIC DESSERTS MARKET, 2021-2031 ($MILLION)
FIGURE 32. NETHERLANDS PROBIOTIC DESSERTS MARKET, 2021-2031 ($MILLION)
FIGURE 33. REST OF EUROPE PROBIOTIC DESSERTS MARKET, 2021-2031 ($MILLION)
FIGURE 34. CHINA PROBIOTIC DESSERTS MARKET, 2021-2031 ($MILLION)
FIGURE 35. JAPAN PROBIOTIC DESSERTS MARKET, 2021-2031 ($MILLION)
FIGURE 36. SOUTH KOREA PROBIOTIC DESSERTS MARKET, 2021-2031 ($MILLION)
FIGURE 37. INDIA PROBIOTIC DESSERTS MARKET, 2021-2031 ($MILLION)
FIGURE 38. AUSTRALIA PROBIOTIC DESSERTS MARKET, 2021-2031 ($MILLION)
FIGURE 39. REST OF ASIA-PACIFIC PROBIOTIC DESSERTS MARKET, 2021-2031 ($MILLION)
FIGURE 40. BRAZIL PROBIOTIC DESSERTS MARKET, 2021-2031 ($MILLION)
FIGURE 41. ARGENTINA PROBIOTIC DESSERTS MARKET, 2021-2031 ($MILLION)
FIGURE 42. UAE PROBIOTIC DESSERTS MARKET, 2021-2031 ($MILLION)
FIGURE 43. SOUTH AFRICA PROBIOTIC DESSERTS MARKET, 2021-2031 ($MILLION)
FIGURE 44. REST OF LAMEA PROBIOTIC DESSERTS MARKET, 2021-2031 ($MILLION)
FIGURE 45. TOP WINNING STRATEGIES, BY YEAR
FIGURE 46. TOP WINNING STRATEGIES, BY DEVELOPMENT
FIGURE 47. TOP WINNING STRATEGIES, BY COMPANY
FIGURE 48. PRODUCT MAPPING OF TOP 10 PLAYERS
FIGURE 49. COMPETITIVE DASHBOARD
FIGURE 50. COMPETITIVE HEATMAP: PROBIOTIC DESSERTS MARKET
FIGURE 51. TOP PLAYER POSITIONING, 2021
FIGURE 52. SOVOS BRANDS, INC.: NET SALES, 2019-2021 ($MILLION)
FIGURE 53. GENERAL MILLS, INC.: NET SALES, 2020-2022 ($MILLION)
FIGURE 54. GENERAL MILLS, INC.: RESEARCH & DEVELOPMENT EXPENDITURE, 2020-2022 ($MILLION)
FIGURE 55. GENERAL MILLS, INC.: REVENUE SHARE BY SEGMENT, 2022 (%)
FIGURE 56. DANONE S.A.: NET SALES, 2020-2022 ($MILLION)
FIGURE 57. DANONE S.A.: REVENUE SHARE BY SEGMENT, 2021 (%)
FIGURE 58. FONTERRA CO-OPERATIVE GROUP LIMITED: NET REVENUE, 2020-2022 ($MILLION)
FIGURE 59. FONTERRA CO-OPERATIVE GROUP LIMITED: REVENUE SHARE BY SEGMENT, 2022 (%)
FIGURE 60. MEIJI HOLDINGS CO., LTD.: NET SALES, 2019-2021 ($MILLION)
FIGURE 61. MEIJI HOLDINGS CO., LTD.: RESEARCH & DEVELOPMENT EXPENDITURE, 2019-2021
FIGURE 62. MEIJI HOLDINGS CO., LTD.: REVENUE SHARE BY SEGMENT, 2021 (%)
FIGURE 63. NATIONAL DAIRY DEVELOPMENT BOARD.: NET REVENUE, 2019-2021 ($MILLION)
FIGURE 64. NATIONAL DAIRY DEVELOPMENT BOARD.: RESEARCH & DEVELOPMENT EXPENDITURE, 2019-2021 ($MILLION
SELECT A FORMAT
Added to Cart
Electronic

$5730

Single User License
Electronic

$6450

Multi User License
Electronic

$9600

Enterprise License
Electronic

$3840

Data Pack License
Add to Cart
Buy Now (15% Discount)

OUR CUSTOMER

SecuX Technology Inc

SIMILAR REPORTS