0
U.S. (TOLL FREE)
+1 (315) 215-3225
Automative

0
U.S. (TOLL FREE)
+1 (315) 215-3225
Sulfamic Acid Market By Form (Powder, Liquid), By Application (Metal Finishing, Dyes & Pigments, Paper & Pulp, Plastic, Others): Global Opportunity Analysis and Industry Forecast, 2021-2031
Published Date: 2022-10-01
|
Report Code: ALLI-Auto-2S899
Home | Market Reports | Business & Industrial| Chemicals Industry
Sulfamic Acid Market By Form Powder Liquid By Application Metal Finishing Dyes Pigments Paper Pulp Plastic Others Global Opportunity Analysis and Industry Forecast 2021 2031
BUY CHAPTERS

Sulfamic Acid Market By Form (Powder, Liquid), By Application (Metal Finishing, Dyes & Pigments, Paper & Pulp, Plastic, Others): Global Opportunity Analysis and Industry Forecast, 2021-2031

Code: ALLI-Auto-2S899
Report
2022-10-01
Pages:250
Allied Market Research
Buy Now with 15% Discount
DESCRIPTION
TABLE OF CONTENT
TABLES & FIGURES

Sulfamic Acid Market Size

According to a new report published by , titled, “Sulfamic Acid Market Size: Global Opportunity Analysis and Industry Forecast, 2020–2027 Market," The sulfamic acid market: global opportunity analysis and industry forecast, 2020–2027 market was valued at $375.00 million in 2021, and is estimated to reach $1.4 billion by 2031, growing at a CAGR of 15% from 2022 to 2031.

Sulfamic Acid Market

Sulfamic Acid Market

Sulfamic acid is frequently included in household cleaning products because of its caustic properties. In the last few years, the sulfamic acid market has experienced an accelerating growth owing to its diversified applications in various domains. Sulfamic acid is highly corrosive, making it perfect for cleaning surfaces that are prone to accumulating a lot of grime, such as toilets. Furthermore, sulfamic acid can degrade organic stuff like hair and grease, it is also a great drain cleaner. Sulfamic acid produces heat when it comes into contact with water and this helps to cut through blocked drains. Additionally, other household products containing sulfamic acid include laundry detergent, dishwasher liquid, and even certain cosmetics, which is a major factor estimated to propel the sulfamic acid market demand in the upcoming years.
However, strict government rules for its use and the fact that sulfamic acid causes cancer when used over a long period of time are expected to significantly impede market growth over the course of the forecast period. While it is anticipated that the fluctuating price of raw materials will hinder the sulfamic acid market growth throughout the aforementioned projected period. Additionally, as sulfamic acid is hazardous and may interfere with the market demand, specialized infrastructure is needed for its manufacturing.
A rising number of factors, including population growth, increased hygiene awareness, and increased demand for residential cleaning equipment, are creating new opportunities for partnerships and collaborations among the leading market players. Governments throughout the world are also working harder to increase chemical production and the growth of chemical industries as more businesses turn to the packaging, pharmaceutical, and medical industries to meet rising consumer demand. In addition, it is projected that rising demand for sulfamic acid would open up new business prospects for the top companies and increase market revenue in the dyeing and textile industries. These factors are anticipated to boost market growth in the upcoming years.
The global sulfamic acid market share is segmented based on form, application, and region. By form, it is classified into powder and liquid. By application, it is classified into metal finishing, dyes & pigments, paper & pulp, plastic, and others. By region, the market is analyzed across North America, Europe, Asia-Pacific, and LAMEA.
The key players profiled in the sulfamic acid market report include Nissan Chemical Corporation, ShanDong Mingda Chemical Technology Co., Ltd, BASF SE, AkzoNobel N.V., DuPont, Jiangsu Yazhong, Palm Commodities, Yantai Sanding, Raviraj Group, and Shree Sulphamic Chemicals.
Impact of COVID-19 on the Global Sulfamic Acid Industry
The manufacturing of chemicals, especially sulfamic acid, has suffered as a result of an extended lockout and decreased production in the manufacturing sectors. Furthermore, various manufacturing processes employ sulfamic acid as an acid-cleaning agent for metals and ceramics. Due to the closure of production facilities, its demand has reduced in several industries.
It is anticipated that the use of existing inventory inventories and the decline in fresh material supply will further have a negative impact on market growth
The increased demand for toilet cleansers, detergents, and other cleaning supplies during the pandemic is anticipated to boost market growth over the anticipated period. To get rid of limescale, cleansers and detergents employ sulfamic acid as a descaling agent.
Key Findings of the Study
Based on form, the powder sub-segment emerged as the global leader in 2021 and the liquid sub-segment is anticipated to be the fastest growing sub-segment during the forecast period
Based on application, the metal finishing sub-segment emerged as the global leader in 2021 and the others sub-segment is predicted to show the fastest growth in the upcoming years
Based on region, the Asia-Pacific market registered the highest market share in 2021 and is projected to maintain the position during the forecast period

Overview

The global sulfamic acid market is envisioned to garner $1,372.80 million by 2031, growing from $375.00 million in 2021, at a CAGR of 15.0% from 2022 to 2031.
The caustic nature of sulfamic acid makes it a common ingredient in household cleaning products. As it is corrosive, sulfamic acid is ideal for cleaning surfaces such as toilets that are prone to amassing a lot of filth. Sulfamic acid is a powerful drain cleanser that can decompose organic materials like grease and hair. When sulfamic acid comes into touch with water, it heats up, which aids in clearing clogged drains. Additionally, the demand for sulfamic acid is expected to increase significantly in the next years due in large part to other home items using the chemical, such as laundry detergent, dishwasher liquid, and even some cosmetics.
However, the long-term use of sulfamic acid causes cancer, and strict government regulations for its use are likely to be significant barriers to market growth over the projection period. While it is anticipated that the volatile price of raw materials will hinder the growth of the sulfamic acid market throughout the aforementioned projected period. A specialized infrastructure is also needed for the manufacturing of sulfamic acid because it is poisonous and may reduce market demand.
Sulfamic acid market factors such as increasing population, rising hygiene awareness, and increasing demand for residential cleaning appliances all contribute to the possibility of partnerships and collaborations among the leading market players. Additionally, as more businesses turn to the packaging, pharmaceutical, and medical sectors to meet rising consumer demand, governments throughout the world are stepping up efforts to increase chemical output and the development of chemical industries. In addition, it is expected that sulfamic acid's expanding demand in the dyeing and textile industries will open up new business prospects for the top companies and increase market revenue. These factors are anticipated to boost market growth in the upcoming years.
Most global market sectors have been severely impacted by the COVID-19 pandemic. The industry sectors have recently faced unforeseen obstacles since the pandemic's emergence. There was a significant decline in the economy as a result of partial or complete lockdowns enforced in several nations around the world. During the COVID-19 pandemic, certain industry sectors experienced debt and loss, while others, like the pharmaceutical, chemical, and healthcare sectors, aim to grow and benefit from demand. Sulfamic acid is commonly used to make pesticides and cleaning products, which is essential in a pandemic situation. Cleaning is crucial in a pandemic situation, and demand for cleaning supplies rose significantly during this period.
The key players profiled in this report include Nissan Chemical Corporation, ShanDong Mingda Chemical Technology Co., Ltd, BASF SE, AkzoNobel N.V., DuPont, Jiangsu Yazhong, Palm Commodities, Yantai Sanding, Raviraj Group, and Shree Sulphamic Chemicals.

Key Benefits For Stakeholders

●This report provides a quantitative analysis of the market segments, current trends, estimations, and dynamics of the sulfamic acid market: global opportunity analysis and industry forecast, 2020–2027 market analysis from 2021 to 2031 to identify the prevailing sulfamic acid market: global opportunity analysis and industry forecast, 2020–2027 market opportunities.
●The market research is offered along with information related to key drivers, restraints, and opportunities.
●Porter's five forces analysis highlights the potency of buyers and suppliers to enable stakeholders make profit-oriented business decisions and strengthen their supplier-buyer network.
●In-depth analysis of the sulfamic acid market: global opportunity analysis and industry forecast, 2020–2027 market segmentation assists to determine the prevailing market opportunities.
●Major countries in each region are mapped according to their revenue contribution to the global market.
●Market player positioning facilitates benchmarking and provides a clear understanding of the present position of the market players.
●The report includes the analysis of the regional as well as global sulfamic acid market: global opportunity analysis and industry forecast, 2020–2027 market trends, key players, market segments, application areas, and market growth strategies.
Key Market Segments
○ AkzoNobel N.V

Scope of Sulfamic Acid Market Report

Report Metric Details
Report Name Sulfamic Acid Market
Accounted market size in 2021 $ 375.00 million
Forecasted market size in 2031 $ 1.4 billion
CAGR 15%
Base Year 2021
Forecasted years 2024 - 2031
By Form ● Powder
● Liquid
By Application ● Metal Finishing
● Dyes Pigments
● Paper Pulp
● Plastic
● Others
By Region
  • North America (United States, Canada)
  • Europe (Germany, France, UK, Italy, Russia) Rest of Europe
  • Nordic Countries
  • Asia-Pacific (China, Japan, South Korea)
  • Southeast Asia (India, Australia)
  • Rest of Asia
  • Latin America (Mexico, Brazil)
  • Rest of Latin America
  • Middle East & Africa (Turkey, Saudi Arabia, UAE, Rest of MEA)
Forecast units USD million in value
Report coverage Revenue and volume forecast, company share, competitive landscape, growth factors and trends

FAQ for this report

How fast is Sulfamic Acid Market growing?

Ans: The Sulfamic Acid Market witnessing a CAGR of 15% during the forecast period 2024-2031.

What is the Sulfamic Acid Market size in 2031?

Ans: The Sulfamic Acid Market size in 2031 will be $ 1.4 billion.

What are the Application segmentation covered in the Sulfamic Acid Market report?

Ans: The Applications covered in the Sulfamic Acid Market report are ● Metal Finishing, ● Dyes Pigments, ● Paper Pulp, ● Plastic, ● Others

CHAPTER 1:INTRODUCTION
1.1.Report description
1.2.Key market segments
1.3.Key benefits to the stakeholders
1.4.Research Methodology
1.4.1.Secondary research
1.4.2.Primary research
1.4.3.Analyst tools and models
CHAPTER 2:EXECUTIVE SUMMARY
2.1.Key findings of the study
2.2.CXO Perspective
CHAPTER 3:MARKET OVERVIEW
3.1.Market definition and scope
3.2.Key findings
3.2.1.Top investment pockets
3.3.Porter’s five forces analysis
3.4.Top player positioning
3.5.Market dynamics
3.5.1.Drivers
3.5.2.Restraints
3.5.3.Opportunities
3.6.COVID-19 Impact Analysis on the market
3.7.Regulatory Guidelines
3.8.Value Chain Analysis
3.9.Market Share Analysis
3.10.Key Regulation Analysis
3.11.Patent Landscape
CHAPTER 4: SULFAMIC ACID MARKET: GLOBAL OPPORTUNITY ANALYSIS AND INDUSTRY FORECAST, 2020–2027 MARKET, BY FORM
4.1 Overview
4.1.1 Market size and forecast
4.2 Powder
4.2.1 Key market trends, growth factors and opportunities
4.2.2 Market size and forecast, by region
4.2.3 Market analysis by country
4.3 Liquid
4.3.1 Key market trends, growth factors and opportunities
4.3.2 Market size and forecast, by region
4.3.3 Market analysis by country
CHAPTER 5: SULFAMIC ACID MARKET: GLOBAL OPPORTUNITY ANALYSIS AND INDUSTRY FORECAST, 2020–2027 MARKET, BY APPLICATION
5.1 Overview
5.1.1 Market size and forecast
5.2 Metal Finishing
5.2.1 Key market trends, growth factors and opportunities
5.2.2 Market size and forecast, by region
5.2.3 Market analysis by country
5.3 Dyes & Pigments
5.3.1 Key market trends, growth factors and opportunities
5.3.2 Market size and forecast, by region
5.3.3 Market analysis by country
5.4 Paper & Pulp
5.4.1 Key market trends, growth factors and opportunities
5.4.2 Market size and forecast, by region
5.4.3 Market analysis by country
5.5 Plastic
5.5.1 Key market trends, growth factors and opportunities
5.5.2 Market size and forecast, by region
5.5.3 Market analysis by country
5.6 Others
5.6.1 Key market trends, growth factors and opportunities
5.6.2 Market size and forecast, by region
5.6.3 Market analysis by country
CHAPTER 6: SULFAMIC ACID MARKET: GLOBAL OPPORTUNITY ANALYSIS AND INDUSTRY FORECAST, 2020–2027 MARKET, BY REGION
6.1 Overview
6.1.1 Market size and forecast
6.2 North America
6.2.1 Key trends and opportunities
6.2.2 North America Market size and forecast, by Form
6.2.3 North America Market size and forecast, by Application
6.2.4 North America Market size and forecast, by country
6.2.4.1 U.S.
6.2.4.1.1 Market size and forecast, by Form
6.2.4.1.2 Market size and forecast, by Application
6.2.4.2 Canada
6.2.4.2.1 Market size and forecast, by Form
6.2.4.2.2 Market size and forecast, by Application
6.2.4.3 Mexico
6.2.4.3.1 Market size and forecast, by Form
6.2.4.3.2 Market size and forecast, by Application
6.3 Europe
6.3.1 Key trends and opportunities
6.3.2 Europe Market size and forecast, by Form
6.3.3 Europe Market size and forecast, by Application
6.3.4 Europe Market size and forecast, by country
6.3.4.1 Germany
6.3.4.1.1 Market size and forecast, by Form
6.3.4.1.2 Market size and forecast, by Application
6.3.4.2 United Kingdom
6.3.4.2.1 Market size and forecast, by Form
6.3.4.2.2 Market size and forecast, by Application
6.3.4.3 France
6.3.4.3.1 Market size and forecast, by Form
6.3.4.3.2 Market size and forecast, by Application
6.3.4.4 Spain
6.3.4.4.1 Market size and forecast, by Form
6.3.4.4.2 Market size and forecast, by Application
6.3.4.5 Italy
6.3.4.5.1 Market size and forecast, by Form
6.3.4.5.2 Market size and forecast, by Application
6.3.4.6 Rest of Europe
6.3.4.6.1 Market size and forecast, by Form
6.3.4.6.2 Market size and forecast, by Application
6.4 Asia-Pacific
6.4.1 Key trends and opportunities
6.4.2 Asia-Pacific Market size and forecast, by Form
6.4.3 Asia-Pacific Market size and forecast, by Application
6.4.4 Asia-Pacific Market size and forecast, by country
6.4.4.1 China
6.4.4.1.1 Market size and forecast, by Form
6.4.4.1.2 Market size and forecast, by Application
6.4.4.2 Japan
6.4.4.2.1 Market size and forecast, by Form
6.4.4.2.2 Market size and forecast, by Application
6.4.4.3 India
6.4.4.3.1 Market size and forecast, by Form
6.4.4.3.2 Market size and forecast, by Application
6.4.4.4 South Korea
6.4.4.4.1 Market size and forecast, by Form
6.4.4.4.2 Market size and forecast, by Application
6.4.4.5 Australia
6.4.4.5.1 Market size and forecast, by Form
6.4.4.5.2 Market size and forecast, by Application
6.4.4.6 Rest Of Asia Pacific
6.4.4.6.1 Market size and forecast, by Form
6.4.4.6.2 Market size and forecast, by Application
6.5 LAMEA
6.5.1 Key trends and opportunities
6.5.2 LAMEA Market size and forecast, by Form
6.5.3 LAMEA Market size and forecast, by Application
6.5.4 LAMEA Market size and forecast, by country
6.5.4.1 Brazil
6.5.4.1.1 Market size and forecast, by Form
6.5.4.1.2 Market size and forecast, by Application
6.5.4.2 Saudi Arabia
6.5.4.2.1 Market size and forecast, by Form
6.5.4.2.2 Market size and forecast, by Application
6.5.4.3 UAE
6.5.4.3.1 Market size and forecast, by Form
6.5.4.3.2 Market size and forecast, by Application
6.5.4.4 South Africa
6.5.4.4.1 Market size and forecast, by Form
6.5.4.4.2 Market size and forecast, by Application
6.5.4.5 Rest of LAMEA
6.5.4.5.1 Market size and forecast, by Form
6.5.4.5.2 Market size and forecast, by Application
CHAPTER 7: COMPANY LANDSCAPE
7.1. Introduction
7.2. Top winning strategies
7.3. Product Mapping of Top 10 Player
7.4. Competitive Dashboard
7.5. Competitive Heatmap
7.6. Key developments
CHAPTER 8: COMPANY PROFILES
8.1 Raviraj Group
8.1.1 Company overview
8.1.2 Company snapshot
8.1.3 Operating business segments
8.1.4 Product portfolio
8.1.5 Business performance
8.1.6 Key strategic moves and developments
8.2 Shandong Mingda Chemical Technology Co., Ltd.
8.2.1 Company overview
8.2.2 Company snapshot
8.2.3 Operating business segments
8.2.4 Product portfolio
8.2.5 Business performance
8.2.6 Key strategic moves and developments
8.3 Laizhou Jinxing Chemical Co. Ltd.
8.3.1 Company overview
8.3.2 Company snapshot
8.3.3 Operating business segments
8.3.4 Product portfolio
8.3.5 Business performance
8.3.6 Key strategic moves and developments
8.4 Nanjing Jinzhang Industrial Co., Ltd.
8.4.1 Company overview
8.4.2 Company snapshot
8.4.3 Operating business segments
8.4.4 Product portfolio
8.4.5 Business performance
8.4.6 Key strategic moves and developments
8.5 Jiangsu Yazhong Group Co. Ltd.
8.5.1 Company overview
8.5.2 Company snapshot
8.5.3 Operating business segments
8.5.4 Product portfolio
8.5.5 Business performance
8.5.6 Key strategic moves and developments
8.6 Nissan Chemical Corporation
8.6.1 Company overview
8.6.2 Company snapshot
8.6.3 Operating business segments
8.6.4 Product portfolio
8.6.5 Business performance
8.6.6 Key strategic moves and developments
8.7 Palm Commodities International, LLC
8.7.1 Company overview
8.7.2 Company snapshot
8.7.3 Operating business segments
8.7.4 Product portfolio
8.7.5 Business performance
8.7.6 Key strategic moves and developments
8.8 Yantai Sanding Chemical Co. Ltd.
8.8.1 Company overview
8.8.2 Company snapshot
8.8.3 Operating business segments
8.8.4 Product portfolio
8.8.5 Business performance
8.8.6 Key strategic moves and developments
8.9 Shandong Xingda Chemical Co. Ltd.
8.9.1 Company overview
8.9.2 Company snapshot
8.9.3 Operating business segments
8.9.4 Product portfolio
8.9.5 Business performance
8.9.6 Key strategic moves and developments
8.10 Laizhou Guangcheng Chemical Co. Ltd.
8.10.1 Company overview
8.10.2 Company snapshot
8.10.3 Operating business segments
8.10.4 Product portfolio
8.10.5 Business performance
8.10.6 Key strategic moves and developments
8.11 DuPont
8.11.1 Company overview
8.11.2 Company snapshot
8.11.3 Operating business segments
8.11.4 Product portfolio
8.11.5 Business performance
8.11.6 Key strategic moves and developments
8.12 BASF SE
8.12.1 Company overview
8.12.2 Company snapshot
8.12.3 Operating business segments
8.12.4 Product portfolio
8.12.5 Business performance
8.12.6 Key strategic moves and developments
8.13 AkzoNobel N.V.
8.13.1 Company overview
8.13.2 Company snapshot
8.13.3 Operating business segments
8.13.4 Product portfolio
8.13.5 Business performance
8.13.6 Key strategic moves and development
LIST OF TABLES
TABLE 1. GLOBAL SULFAMIC ACID MARKET: GLOBAL OPPORTUNITY ANALYSIS AND INDUSTRY FORECAST, 2020–2027 MARKET, BY FORM, 2021-2031 ($MILLION)
TABLE 2. SULFAMIC ACID MARKET: GLOBAL OPPORTUNITY ANALYSIS AND INDUSTRY FORECAST, 2020–2027 MARKET SIZE, FOR POWDER, BY REGION, 2021-2031 ($MILLION)
TABLE 3. SULFAMIC ACID MARKET: GLOBAL OPPORTUNITY ANALYSIS AND INDUSTRY FORECAST, 2020–2027 MARKET FOR POWDER, BY COUNTRY, 2021-2031 ($MILLION)
TABLE 4. SULFAMIC ACID MARKET: GLOBAL OPPORTUNITY ANALYSIS AND INDUSTRY FORECAST, 2020–2027 MARKET SIZE, FOR LIQUID, BY REGION, 2021-2031 ($MILLION)
TABLE 5. SULFAMIC ACID MARKET: GLOBAL OPPORTUNITY ANALYSIS AND INDUSTRY FORECAST, 2020–2027 MARKET FOR LIQUID, BY COUNTRY, 2021-2031 ($MILLION)
TABLE 6. GLOBAL SULFAMIC ACID MARKET: GLOBAL OPPORTUNITY ANALYSIS AND INDUSTRY FORECAST, 2020–2027 MARKET, BY APPLICATION, 2021-2031 ($MILLION)
TABLE 7. SULFAMIC ACID MARKET: GLOBAL OPPORTUNITY ANALYSIS AND INDUSTRY FORECAST, 2020–2027 MARKET SIZE, FOR METAL FINISHING, BY REGION, 2021-2031 ($MILLION)
TABLE 8. SULFAMIC ACID MARKET: GLOBAL OPPORTUNITY ANALYSIS AND INDUSTRY FORECAST, 2020–2027 MARKET FOR METAL FINISHING, BY COUNTRY, 2021-2031 ($MILLION)
TABLE 9. SULFAMIC ACID MARKET: GLOBAL OPPORTUNITY ANALYSIS AND INDUSTRY FORECAST, 2020–2027 MARKET SIZE, FOR DYES & PIGMENTS, BY REGION, 2021-2031 ($MILLION)
TABLE 10. SULFAMIC ACID MARKET: GLOBAL OPPORTUNITY ANALYSIS AND INDUSTRY FORECAST, 2020–2027 MARKET FOR DYES & PIGMENTS, BY COUNTRY, 2021-2031 ($MILLION)
TABLE 11. SULFAMIC ACID MARKET: GLOBAL OPPORTUNITY ANALYSIS AND INDUSTRY FORECAST, 2020–2027 MARKET SIZE, FOR PAPER & PULP, BY REGION, 2021-2031 ($MILLION)
TABLE 12. SULFAMIC ACID MARKET: GLOBAL OPPORTUNITY ANALYSIS AND INDUSTRY FORECAST, 2020–2027 MARKET FOR PAPER & PULP, BY COUNTRY, 2021-2031 ($MILLION)
TABLE 13. SULFAMIC ACID MARKET: GLOBAL OPPORTUNITY ANALYSIS AND INDUSTRY FORECAST, 2020–2027 MARKET SIZE, FOR PLASTIC, BY REGION, 2021-2031 ($MILLION)
TABLE 14. SULFAMIC ACID MARKET: GLOBAL OPPORTUNITY ANALYSIS AND INDUSTRY FORECAST, 2020–2027 MARKET FOR PLASTIC, BY COUNTRY, 2021-2031 ($MILLION)
TABLE 15. SULFAMIC ACID MARKET: GLOBAL OPPORTUNITY ANALYSIS AND INDUSTRY FORECAST, 2020–2027 MARKET SIZE, FOR OTHERS, BY REGION, 2021-2031 ($MILLION)
TABLE 16. SULFAMIC ACID MARKET: GLOBAL OPPORTUNITY ANALYSIS AND INDUSTRY FORECAST, 2020–2027 MARKET FOR OTHERS, BY COUNTRY, 2021-2031 ($MILLION)
TABLE 17. SULFAMIC ACID MARKET: GLOBAL OPPORTUNITY ANALYSIS AND INDUSTRY FORECAST, 2020–2027 MARKET, BY REGION, 2021-2031 ($MILLION)
TABLE 18. NORTH AMERICA SULFAMIC ACID MARKET: GLOBAL OPPORTUNITY ANALYSIS AND INDUSTRY FORECAST, 2020–2027 MARKET, BY FORM, 2021-2031 ($MILLION)
TABLE 19. NORTH AMERICA SULFAMIC ACID MARKET: GLOBAL OPPORTUNITY ANALYSIS AND INDUSTRY FORECAST, 2020–2027 MARKET, BY APPLICATION, 2021-2031 ($MILLION)
TABLE 20. NORTH AMERICA SULFAMIC ACID MARKET: GLOBAL OPPORTUNITY ANALYSIS AND INDUSTRY FORECAST, 2020–2027 MARKET, BY COUNTRY, 2021-2031 ($MILLION)
TABLE 21. U.S. SULFAMIC ACID MARKET: GLOBAL OPPORTUNITY ANALYSIS AND INDUSTRY FORECAST, 2020–2027 MARKET, BY FORM, 2021-2031 ($MILLION)
TABLE 22. U.S. SULFAMIC ACID MARKET: GLOBAL OPPORTUNITY ANALYSIS AND INDUSTRY FORECAST, 2020–2027 MARKET, BY APPLICATION, 2021-2031 ($MILLION)
TABLE 23. CANADA SULFAMIC ACID MARKET: GLOBAL OPPORTUNITY ANALYSIS AND INDUSTRY FORECAST, 2020–2027 MARKET, BY FORM, 2021-2031 ($MILLION)
TABLE 24. CANADA SULFAMIC ACID MARKET: GLOBAL OPPORTUNITY ANALYSIS AND INDUSTRY FORECAST, 2020–2027 MARKET, BY APPLICATION, 2021-2031 ($MILLION)
TABLE 25. MEXICO SULFAMIC ACID MARKET: GLOBAL OPPORTUNITY ANALYSIS AND INDUSTRY FORECAST, 2020–2027 MARKET, BY FORM, 2021-2031 ($MILLION)
TABLE 26. MEXICO SULFAMIC ACID MARKET: GLOBAL OPPORTUNITY ANALYSIS AND INDUSTRY FORECAST, 2020–2027 MARKET, BY APPLICATION, 2021-2031 ($MILLION)
TABLE 27. EUROPE SULFAMIC ACID MARKET: GLOBAL OPPORTUNITY ANALYSIS AND INDUSTRY FORECAST, 2020–2027 MARKET, BY FORM, 2021-2031 ($MILLION)
TABLE 28. EUROPE SULFAMIC ACID MARKET: GLOBAL OPPORTUNITY ANALYSIS AND INDUSTRY FORECAST, 2020–2027 MARKET, BY APPLICATION, 2021-2031 ($MILLION)
TABLE 29. EUROPE SULFAMIC ACID MARKET: GLOBAL OPPORTUNITY ANALYSIS AND INDUSTRY FORECAST, 2020–2027 MARKET, BY COUNTRY, 2021-2031 ($MILLION)
TABLE 30. GERMANY SULFAMIC ACID MARKET: GLOBAL OPPORTUNITY ANALYSIS AND INDUSTRY FORECAST, 2020–2027 MARKET, BY FORM, 2021-2031 ($MILLION)
TABLE 31. GERMANY SULFAMIC ACID MARKET: GLOBAL OPPORTUNITY ANALYSIS AND INDUSTRY FORECAST, 2020–2027 MARKET, BY APPLICATION, 2021-2031 ($MILLION)
TABLE 32. UNITED KINGDOM SULFAMIC ACID MARKET: GLOBAL OPPORTUNITY ANALYSIS AND INDUSTRY FORECAST, 2020–2027 MARKET, BY FORM, 2021-2031 ($MILLION)
TABLE 33. UNITED KINGDOM SULFAMIC ACID MARKET: GLOBAL OPPORTUNITY ANALYSIS AND INDUSTRY FORECAST, 2020–2027 MARKET, BY APPLICATION, 2021-2031 ($MILLION)
TABLE 34. FRANCE SULFAMIC ACID MARKET: GLOBAL OPPORTUNITY ANALYSIS AND INDUSTRY FORECAST, 2020–2027 MARKET, BY FORM, 2021-2031 ($MILLION)
TABLE 35. FRANCE SULFAMIC ACID MARKET: GLOBAL OPPORTUNITY ANALYSIS AND INDUSTRY FORECAST, 2020–2027 MARKET, BY APPLICATION, 2021-2031 ($MILLION)
TABLE 36. SPAIN SULFAMIC ACID MARKET: GLOBAL OPPORTUNITY ANALYSIS AND INDUSTRY FORECAST, 2020–2027 MARKET, BY FORM, 2021-2031 ($MILLION)
TABLE 37. SPAIN SULFAMIC ACID MARKET: GLOBAL OPPORTUNITY ANALYSIS AND INDUSTRY FORECAST, 2020–2027 MARKET, BY APPLICATION, 2021-2031 ($MILLION)
TABLE 38. ITALY SULFAMIC ACID MARKET: GLOBAL OPPORTUNITY ANALYSIS AND INDUSTRY FORECAST, 2020–2027 MARKET, BY FORM, 2021-2031 ($MILLION)
TABLE 39. ITALY SULFAMIC ACID MARKET: GLOBAL OPPORTUNITY ANALYSIS AND INDUSTRY FORECAST, 2020–2027 MARKET, BY APPLICATION, 2021-2031 ($MILLION)
TABLE 40. REST OF EUROPE SULFAMIC ACID MARKET: GLOBAL OPPORTUNITY ANALYSIS AND INDUSTRY FORECAST, 2020–2027 MARKET, BY FORM, 2021-2031 ($MILLION)
TABLE 41. REST OF EUROPE SULFAMIC ACID MARKET: GLOBAL OPPORTUNITY ANALYSIS AND INDUSTRY FORECAST, 2020–2027 MARKET, BY APPLICATION, 2021-2031 ($MILLION)
TABLE 42. ASIA-PACIFIC SULFAMIC ACID MARKET: GLOBAL OPPORTUNITY ANALYSIS AND INDUSTRY FORECAST, 2020–2027 MARKET, BY FORM, 2021-2031 ($MILLION)
TABLE 43. ASIA-PACIFIC SULFAMIC ACID MARKET: GLOBAL OPPORTUNITY ANALYSIS AND INDUSTRY FORECAST, 2020–2027 MARKET, BY APPLICATION, 2021-2031 ($MILLION)
TABLE 44. ASIA-PACIFIC SULFAMIC ACID MARKET: GLOBAL OPPORTUNITY ANALYSIS AND INDUSTRY FORECAST, 2020–2027 MARKET, BY COUNTRY, 2021-2031 ($MILLION)
TABLE 45. CHINA SULFAMIC ACID MARKET: GLOBAL OPPORTUNITY ANALYSIS AND INDUSTRY FORECAST, 2020–2027 MARKET, BY FORM, 2021-2031 ($MILLION)
TABLE 46. CHINA SULFAMIC ACID MARKET: GLOBAL OPPORTUNITY ANALYSIS AND INDUSTRY FORECAST, 2020–2027 MARKET, BY APPLICATION, 2021-2031 ($MILLION)
TABLE 47. JAPAN SULFAMIC ACID MARKET: GLOBAL OPPORTUNITY ANALYSIS AND INDUSTRY FORECAST, 2020–2027 MARKET, BY FORM, 2021-2031 ($MILLION)
TABLE 48. JAPAN SULFAMIC ACID MARKET: GLOBAL OPPORTUNITY ANALYSIS AND INDUSTRY FORECAST, 2020–2027 MARKET, BY APPLICATION, 2021-2031 ($MILLION)
TABLE 49. INDIA SULFAMIC ACID MARKET: GLOBAL OPPORTUNITY ANALYSIS AND INDUSTRY FORECAST, 2020–2027 MARKET, BY FORM, 2021-2031 ($MILLION)
TABLE 50. INDIA SULFAMIC ACID MARKET: GLOBAL OPPORTUNITY ANALYSIS AND INDUSTRY FORECAST, 2020–2027 MARKET, BY APPLICATION, 2021-2031 ($MILLION)
TABLE 51. SOUTH KOREA SULFAMIC ACID MARKET: GLOBAL OPPORTUNITY ANALYSIS AND INDUSTRY FORECAST, 2020–2027 MARKET, BY FORM, 2021-2031 ($MILLION)
TABLE 52. SOUTH KOREA SULFAMIC ACID MARKET: GLOBAL OPPORTUNITY ANALYSIS AND INDUSTRY FORECAST, 2020–2027 MARKET, BY APPLICATION, 2021-2031 ($MILLION)
TABLE 53. AUSTRALIA SULFAMIC ACID MARKET: GLOBAL OPPORTUNITY ANALYSIS AND INDUSTRY FORECAST, 2020–2027 MARKET, BY FORM, 2021-2031 ($MILLION)
TABLE 54. AUSTRALIA SULFAMIC ACID MARKET: GLOBAL OPPORTUNITY ANALYSIS AND INDUSTRY FORECAST, 2020–2027 MARKET, BY APPLICATION, 2021-2031 ($MILLION)
TABLE 55. REST OF ASIA PACIFIC SULFAMIC ACID MARKET: GLOBAL OPPORTUNITY ANALYSIS AND INDUSTRY FORECAST, 2020–2027 MARKET, BY FORM, 2021-2031 ($MILLION)
TABLE 56. REST OF ASIA PACIFIC SULFAMIC ACID MARKET: GLOBAL OPPORTUNITY ANALYSIS AND INDUSTRY FORECAST, 2020–2027 MARKET, BY APPLICATION, 2021-2031 ($MILLION)
TABLE 57. LAMEA SULFAMIC ACID MARKET: GLOBAL OPPORTUNITY ANALYSIS AND INDUSTRY FORECAST, 2020–2027 MARKET, BY FORM, 2021-2031 ($MILLION)
TABLE 58. LAMEA SULFAMIC ACID MARKET: GLOBAL OPPORTUNITY ANALYSIS AND INDUSTRY FORECAST, 2020–2027 MARKET, BY APPLICATION, 2021-2031 ($MILLION)
TABLE 59. LAMEA SULFAMIC ACID MARKET: GLOBAL OPPORTUNITY ANALYSIS AND INDUSTRY FORECAST, 2020–2027 MARKET, BY COUNTRY, 2021-2031 ($MILLION)
TABLE 60. BRAZIL SULFAMIC ACID MARKET: GLOBAL OPPORTUNITY ANALYSIS AND INDUSTRY FORECAST, 2020–2027 MARKET, BY FORM, 2021-2031 ($MILLION)
TABLE 61. BRAZIL SULFAMIC ACID MARKET: GLOBAL OPPORTUNITY ANALYSIS AND INDUSTRY FORECAST, 2020–2027 MARKET, BY APPLICATION, 2021-2031 ($MILLION)
TABLE 62. SAUDI ARABIA SULFAMIC ACID MARKET: GLOBAL OPPORTUNITY ANALYSIS AND INDUSTRY FORECAST, 2020–2027 MARKET, BY FORM, 2021-2031 ($MILLION)
TABLE 63. SAUDI ARABIA SULFAMIC ACID MARKET: GLOBAL OPPORTUNITY ANALYSIS AND INDUSTRY FORECAST, 2020–2027 MARKET, BY APPLICATION, 2021-2031 ($MILLION)
TABLE 64. UAE SULFAMIC ACID MARKET: GLOBAL OPPORTUNITY ANALYSIS AND INDUSTRY FORECAST, 2020–2027 MARKET, BY FORM, 2021-2031 ($MILLION)
TABLE 65. UAE SULFAMIC ACID MARKET: GLOBAL OPPORTUNITY ANALYSIS AND INDUSTRY FORECAST, 2020–2027 MARKET, BY APPLICATION, 2021-2031 ($MILLION)
TABLE 66. SOUTH AFRICA SULFAMIC ACID MARKET: GLOBAL OPPORTUNITY ANALYSIS AND INDUSTRY FORECAST, 2020–2027 MARKET, BY FORM, 2021-2031 ($MILLION)
TABLE 67. SOUTH AFRICA SULFAMIC ACID MARKET: GLOBAL OPPORTUNITY ANALYSIS AND INDUSTRY FORECAST, 2020–2027 MARKET, BY APPLICATION, 2021-2031 ($MILLION)
TABLE 68. REST OF LAMEA SULFAMIC ACID MARKET: GLOBAL OPPORTUNITY ANALYSIS AND INDUSTRY FORECAST, 2020–2027 MARKET, BY FORM, 2021-2031 ($MILLION)
TABLE 69. REST OF LAMEA SULFAMIC ACID MARKET: GLOBAL OPPORTUNITY ANALYSIS AND INDUSTRY FORECAST, 2020–2027 MARKET, BY APPLICATION, 2021-2031 ($MILLION)
TABLE 70.RAVIRAJ GROUP: COMPANY SNAPSHOT
TABLE 71.RAVIRAJ GROUP: OPERATING SEGMENTS
TABLE 72.RAVIRAJ GROUP: PRODUCT PORTFOLIO
TABLE 73.RAVIRAJ GROUP: NET SALES,
TABLE 74.RAVIRAJ GROUP: KEY STRATERGIES
TABLE 75.SHANDONG MINGDA CHEMICAL TECHNOLOGY CO., LTD.: COMPANY SNAPSHOT
TABLE 76.SHANDONG MINGDA CHEMICAL TECHNOLOGY CO., LTD.: OPERATING SEGMENTS
TABLE 77.SHANDONG MINGDA CHEMICAL TECHNOLOGY CO., LTD.: PRODUCT PORTFOLIO
TABLE 78.SHANDONG MINGDA CHEMICAL TECHNOLOGY CO., LTD.: NET SALES,
TABLE 79.SHANDONG MINGDA CHEMICAL TECHNOLOGY CO., LTD.: KEY STRATERGIES
TABLE 80.LAIZHOU JINXING CHEMICAL CO. LTD.: COMPANY SNAPSHOT
TABLE 81.LAIZHOU JINXING CHEMICAL CO. LTD.: OPERATING SEGMENTS
TABLE 82.LAIZHOU JINXING CHEMICAL CO. LTD.: PRODUCT PORTFOLIO
TABLE 83.LAIZHOU JINXING CHEMICAL CO. LTD.: NET SALES,
TABLE 84.LAIZHOU JINXING CHEMICAL CO. LTD.: KEY STRATERGIES
TABLE 85.NANJING JINZHANG INDUSTRIAL CO., LTD.: COMPANY SNAPSHOT
TABLE 86.NANJING JINZHANG INDUSTRIAL CO., LTD.: OPERATING SEGMENTS
TABLE 87.NANJING JINZHANG INDUSTRIAL CO., LTD.: PRODUCT PORTFOLIO
TABLE 88.NANJING JINZHANG INDUSTRIAL CO., LTD.: NET SALES,
TABLE 89.NANJING JINZHANG INDUSTRIAL CO., LTD.: KEY STRATERGIES
TABLE 90.JIANGSU YAZHONG GROUP CO. LTD.: COMPANY SNAPSHOT
TABLE 91.JIANGSU YAZHONG GROUP CO. LTD.: OPERATING SEGMENTS
TABLE 92.JIANGSU YAZHONG GROUP CO. LTD.: PRODUCT PORTFOLIO
TABLE 93.JIANGSU YAZHONG GROUP CO. LTD.: NET SALES,
TABLE 94.JIANGSU YAZHONG GROUP CO. LTD.: KEY STRATERGIES
TABLE 95.NISSAN CHEMICAL CORPORATION: COMPANY SNAPSHOT
TABLE 96.NISSAN CHEMICAL CORPORATION: OPERATING SEGMENTS
TABLE 97.NISSAN CHEMICAL CORPORATION: PRODUCT PORTFOLIO
TABLE 98.NISSAN CHEMICAL CORPORATION: NET SALES,
TABLE 99.NISSAN CHEMICAL CORPORATION: KEY STRATERGIES
TABLE 100.PALM COMMODITIES INTERNATIONAL, LLC: COMPANY SNAPSHOT
TABLE 101.PALM COMMODITIES INTERNATIONAL, LLC: OPERATING SEGMENTS
TABLE 102.PALM COMMODITIES INTERNATIONAL, LLC: PRODUCT PORTFOLIO
TABLE 103.PALM COMMODITIES INTERNATIONAL, LLC: NET SALES,
TABLE 104.PALM COMMODITIES INTERNATIONAL, LLC: KEY STRATERGIES
TABLE 105.YANTAI SANDING CHEMICAL CO. LTD.: COMPANY SNAPSHOT
TABLE 106.YANTAI SANDING CHEMICAL CO. LTD.: OPERATING SEGMENTS
TABLE 107.YANTAI SANDING CHEMICAL CO. LTD.: PRODUCT PORTFOLIO
TABLE 108.YANTAI SANDING CHEMICAL CO. LTD.: NET SALES,
TABLE 109.YANTAI SANDING CHEMICAL CO. LTD.: KEY STRATERGIES
TABLE 110.SHANDONG XINGDA CHEMICAL CO. LTD.: COMPANY SNAPSHOT
TABLE 111.SHANDONG XINGDA CHEMICAL CO. LTD.: OPERATING SEGMENTS
TABLE 112.SHANDONG XINGDA CHEMICAL CO. LTD.: PRODUCT PORTFOLIO
TABLE 113.SHANDONG XINGDA CHEMICAL CO. LTD.: NET SALES,
TABLE 114.SHANDONG XINGDA CHEMICAL CO. LTD.: KEY STRATERGIES
TABLE 115.LAIZHOU GUANGCHENG CHEMICAL CO. LTD.: COMPANY SNAPSHOT
TABLE 116.LAIZHOU GUANGCHENG CHEMICAL CO. LTD.: OPERATING SEGMENTS
TABLE 117.LAIZHOU GUANGCHENG CHEMICAL CO. LTD.: PRODUCT PORTFOLIO
TABLE 118.LAIZHOU GUANGCHENG CHEMICAL CO. LTD.: NET SALES,
TABLE 119.LAIZHOU GUANGCHENG CHEMICAL CO. LTD.: KEY STRATERGIES
TABLE 120.DUPONT: COMPANY SNAPSHOT
TABLE 121.DUPONT: OPERATING SEGMENTS
TABLE 122.DUPONT: PRODUCT PORTFOLIO
TABLE 123.DUPONT: NET SALES,
TABLE 124.DUPONT: KEY STRATERGIES
TABLE 125.BASF SE: COMPANY SNAPSHOT
TABLE 126.BASF SE: OPERATING SEGMENTS
TABLE 127.BASF SE: PRODUCT PORTFOLIO
TABLE 128.BASF SE: NET SALES,
TABLE 129.BASF SE: KEY STRATERGIES
TABLE 130.AKZONOBEL N.V.: COMPANY SNAPSHOT
TABLE 131.AKZONOBEL N.V.: OPERATING SEGMENTS
TABLE 132.AKZONOBEL N.V.: PRODUCT PORTFOLIO
TABLE 133.AKZONOBEL N.V.: NET SALES,
TABLE 134.AKZONOBEL N.V.: KEY STRATERGIES LIST OF FIGURES
FIGURE 1.SULFAMIC ACID MARKET: GLOBAL OPPORTUNITY ANALYSIS AND INDUSTRY FORECAST, 2020–2027 MARKET SEGMENTATION
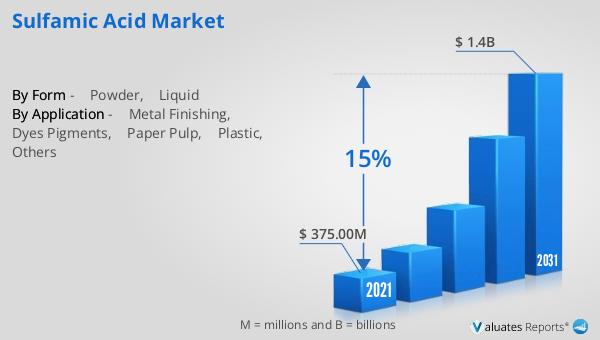
FIGURE 2.SULFAMIC ACID MARKET: GLOBAL OPPORTUNITY ANALYSIS AND INDUSTRY FORECAST, 2020–2027 MARKET,2021-2031
FIGURE 3.SULFAMIC ACID MARKET: GLOBAL OPPORTUNITY ANALYSIS AND INDUSTRY FORECAST, 2020–2027 MARKET,2021-2031
FIGURE 4. TOP INVESTMENT POCKETS, BY REGION
FIGURE 5.PORTER FIVE-1
FIGURE 6.PORTER FIVE-2
FIGURE 7.PORTER FIVE-3
FIGURE 8.PORTER FIVE-4
FIGURE 9.PORTER FIVE-5
FIGURE 10.TOP PLAYER POSITIONING
FIGURE 11.SULFAMIC ACID MARKET: GLOBAL OPPORTUNITY ANALYSIS AND INDUSTRY FORECAST, 2020–2027 MARKET:DRIVERS, RESTRAINTS AND OPPORTUNITIES
FIGURE 12.REGULATORY GUIDELINES
FIGURE 13.VALUE CHAIN ANALYSIS
FIGURE 14.MARKET SHARE ANALYSIS
FIGURE 15.KEY REGULATION ANALYSIS
FIGURE 16.PATENT ANALYSIS BY COMPANY
FIGURE 17.PATENT ANALYSIS BY COUNTRY
FIGURE 18.SULFAMIC ACID MARKET: GLOBAL OPPORTUNITY ANALYSIS AND INDUSTRY FORECAST, 2020–2027 MARKET,BY FORM,2021(%)
FIGURE 19.COMPARATIVE SHARE ANALYSIS OF POWDER SULFAMIC ACID MARKET: GLOBAL OPPORTUNITY ANALYSIS AND INDUSTRY FORECAST, 2020–2027 MARKET,2021-2031(%)
FIGURE 20.COMPARATIVE SHARE ANALYSIS OF LIQUID SULFAMIC ACID MARKET: GLOBAL OPPORTUNITY ANALYSIS AND INDUSTRY FORECAST, 2020–2027 MARKET,2021-2031(%)
FIGURE 21.SULFAMIC ACID MARKET: GLOBAL OPPORTUNITY ANALYSIS AND INDUSTRY FORECAST, 2020–2027 MARKET,BY APPLICATION,2021(%)
FIGURE 22.COMPARATIVE SHARE ANALYSIS OF METAL FINISHING SULFAMIC ACID MARKET: GLOBAL OPPORTUNITY ANALYSIS AND INDUSTRY FORECAST, 2020–2027 MARKET,2021-2031(%)
FIGURE 23.COMPARATIVE SHARE ANALYSIS OF DYES & PIGMENTS SULFAMIC ACID MARKET: GLOBAL OPPORTUNITY ANALYSIS AND INDUSTRY FORECAST, 2020–2027 MARKET,2021-2031(%)
FIGURE 24.COMPARATIVE SHARE ANALYSIS OF PAPER & PULP SULFAMIC ACID MARKET: GLOBAL OPPORTUNITY ANALYSIS AND INDUSTRY FORECAST, 2020–2027 MARKET,2021-2031(%)
FIGURE 25.COMPARATIVE SHARE ANALYSIS OF PLASTIC SULFAMIC ACID MARKET: GLOBAL OPPORTUNITY ANALYSIS AND INDUSTRY FORECAST, 2020–2027 MARKET,2021-2031(%)
FIGURE 26.COMPARATIVE SHARE ANALYSIS OF OTHERS SULFAMIC ACID MARKET: GLOBAL OPPORTUNITY ANALYSIS AND INDUSTRY FORECAST, 2020–2027 MARKET,2021-2031(%)
FIGURE 27.SULFAMIC ACID MARKET: GLOBAL OPPORTUNITY ANALYSIS AND INDUSTRY FORECAST, 2020–2027 MARKET BY REGION,2021
FIGURE 28.U.S. SULFAMIC ACID MARKET: GLOBAL OPPORTUNITY ANALYSIS AND INDUSTRY FORECAST, 2020–2027 MARKET,2021-2031($MILLION)
FIGURE 29.CANADA SULFAMIC ACID MARKET: GLOBAL OPPORTUNITY ANALYSIS AND INDUSTRY FORECAST, 2020–2027 MARKET,2021-2031($MILLION)
FIGURE 30.MEXICO SULFAMIC ACID MARKET: GLOBAL OPPORTUNITY ANALYSIS AND INDUSTRY FORECAST, 2020–2027 MARKET,2021-2031($MILLION)
FIGURE 31.GERMANY SULFAMIC ACID MARKET: GLOBAL OPPORTUNITY ANALYSIS AND INDUSTRY FORECAST, 2020–2027 MARKET,2021-2031($MILLION)
FIGURE 32.UNITED KINGDOM SULFAMIC ACID MARKET: GLOBAL OPPORTUNITY ANALYSIS AND INDUSTRY FORECAST, 2020–2027 MARKET,2021-2031($MILLION)
FIGURE 33.FRANCE SULFAMIC ACID MARKET: GLOBAL OPPORTUNITY ANALYSIS AND INDUSTRY FORECAST, 2020–2027 MARKET,2021-2031($MILLION)
FIGURE 34.SPAIN SULFAMIC ACID MARKET: GLOBAL OPPORTUNITY ANALYSIS AND INDUSTRY FORECAST, 2020–2027 MARKET,2021-2031($MILLION)
FIGURE 35.ITALY SULFAMIC ACID MARKET: GLOBAL OPPORTUNITY ANALYSIS AND INDUSTRY FORECAST, 2020–2027 MARKET,2021-2031($MILLION)
FIGURE 36.REST OF EUROPE SULFAMIC ACID MARKET: GLOBAL OPPORTUNITY ANALYSIS AND INDUSTRY FORECAST, 2020–2027 MARKET,2021-2031($MILLION)
FIGURE 37.CHINA SULFAMIC ACID MARKET: GLOBAL OPPORTUNITY ANALYSIS AND INDUSTRY FORECAST, 2020–2027 MARKET,2021-2031($MILLION)
FIGURE 38.JAPAN SULFAMIC ACID MARKET: GLOBAL OPPORTUNITY ANALYSIS AND INDUSTRY FORECAST, 2020–2027 MARKET,2021-2031($MILLION)
FIGURE 39.INDIA SULFAMIC ACID MARKET: GLOBAL OPPORTUNITY ANALYSIS AND INDUSTRY FORECAST, 2020–2027 MARKET,2021-2031($MILLION)
FIGURE 40.SOUTH KOREA SULFAMIC ACID MARKET: GLOBAL OPPORTUNITY ANALYSIS AND INDUSTRY FORECAST, 2020–2027 MARKET,2021-2031($MILLION)
FIGURE 41.AUSTRALIA SULFAMIC ACID MARKET: GLOBAL OPPORTUNITY ANALYSIS AND INDUSTRY FORECAST, 2020–2027 MARKET,2021-2031($MILLION)
FIGURE 42.REST OF ASIA PACIFIC SULFAMIC ACID MARKET: GLOBAL OPPORTUNITY ANALYSIS AND INDUSTRY FORECAST, 2020–2027 MARKET,2021-2031($MILLION)
FIGURE 43.BRAZIL SULFAMIC ACID MARKET: GLOBAL OPPORTUNITY ANALYSIS AND INDUSTRY FORECAST, 2020–2027 MARKET,2021-2031($MILLION)
FIGURE 44.SAUDI ARABIA SULFAMIC ACID MARKET: GLOBAL OPPORTUNITY ANALYSIS AND INDUSTRY FORECAST, 2020–2027 MARKET,2021-2031($MILLION)
FIGURE 45.UAE SULFAMIC ACID MARKET: GLOBAL OPPORTUNITY ANALYSIS AND INDUSTRY FORECAST, 2020–2027 MARKET,2021-2031($MILLION)
FIGURE 46.SOUTH AFRICA SULFAMIC ACID MARKET: GLOBAL OPPORTUNITY ANALYSIS AND INDUSTRY FORECAST, 2020–2027 MARKET,2021-2031($MILLION)
FIGURE 47.REST OF LAMEA SULFAMIC ACID MARKET: GLOBAL OPPORTUNITY ANALYSIS AND INDUSTRY FORECAST, 2020–2027 MARKET,2021-2031($MILLION)
FIGURE 48. TOP WINNING STRATEGIES, BY YEAR
FIGURE 49. TOP WINNING STRATEGIES, BY DEVELOPMENT
FIGURE 50. TOP WINNING STRATEGIES, BY COMPANY
FIGURE 51.PRODUCT MAPPING OF TOP 10 PLAYERS
FIGURE 52.COMPETITIVE DASHBOARD
FIGURE 53.COMPETITIVE HEATMAP OF TOP 10 KEY PLAYERS
FIGURE 54.RAVIRAJ GROUP.: NET SALES ,($MILLION)
FIGURE 55.SHANDONG MINGDA CHEMICAL TECHNOLOGY CO., LTD..: NET SALES ,($MILLION)
FIGURE 56.LAIZHOU JINXING CHEMICAL CO. LTD..: NET SALES ,($MILLION)
FIGURE 57.NANJING JINZHANG INDUSTRIAL CO., LTD..: NET SALES ,($MILLION)
FIGURE 58.JIANGSU YAZHONG GROUP CO. LTD..: NET SALES ,($MILLION)
FIGURE 59.NISSAN CHEMICAL CORPORATION.: NET SALES ,($MILLION)
FIGURE 60.PALM COMMODITIES INTERNATIONAL, LLC.: NET SALES ,($MILLION)
FIGURE 61.YANTAI SANDING CHEMICAL CO. LTD..: NET SALES ,($MILLION)
FIGURE 62.SHANDONG XINGDA CHEMICAL CO. LTD..: NET SALES ,($MILLION)
FIGURE 63.LAIZHOU GUANGCHENG CHEMICAL CO. LTD..: NET SALES ,($MILLION)
FIGURE 64.DUPONT.: NET SALES ,($MILLION)
FIGURE 65.BASF SE.: NET SALES ,($MILLION)
FIGURE 66.AKZONOBEL N.V..: NET SALES ,($MILLION
SELECT A FORMAT
Added to Cart
Electronic

$5730

Single User License
Electronic

$6450

Multi User License
Electronic

$9600

Enterprise License
Electronic

$3840

Data Pack License
Add to Cart
Buy Now (15% Discount)

OUR CUSTOMER

Strategic Venue Partners

SIMILAR REPORTS