0
U.S. (TOLL FREE)
+1 (315) 215-3225
Automative

0
U.S. (TOLL FREE)
+1 (315) 215-3225
Cryogenic Liquid Transport Vehicle Market By Vehicle Type (Flammable Liquid Transport Vehicle, Non-flammable Liquid Transport Vehicle), By Application (Liquid Oxygen, Liquid Nitrogen, Liquid Argon, Liquid Hydrogen, Others): Global Opportunity Analysis and Industry Forecast, 2023-2032
Published Date: April 2023
|
Report Code: ALLI-Auto-2U958
Home | Market Reports | Business & Industrial| Energy & Utilities| Oil & Gas
Cryogenic Liquid Transport Vehicle Market By Vehicle Type Flammable Liquid Transport Vehicle Non flammable Liquid Transport Vehicle By Application Liquid Oxygen Liquid Nitrogen Liquid Argon Liquid Hydrogen Others Global Opportunity Analysis and Industry Forecast 2023 2032
BUY CHAPTERS

Cryogenic Liquid Transport Vehicle Market By Vehicle Type (Flammable Liquid Transport Vehicle, Non-flammable Liquid Transport Vehicle), By Application (Liquid Oxygen, Liquid Nitrogen, Liquid Argon, Liquid Hydrogen, Others): Global Opportunity Analysis and Industry Forecast, 2023-2032

Code: ALLI-Auto-2U958
Report
April 2023
Pages:201
Allied Market Research
Buy Now with 15% Discount
DESCRIPTION
TABLE OF CONTENT
TABLES & FIGURES

Cryogenic Liquid Transport Vehicle Market Size

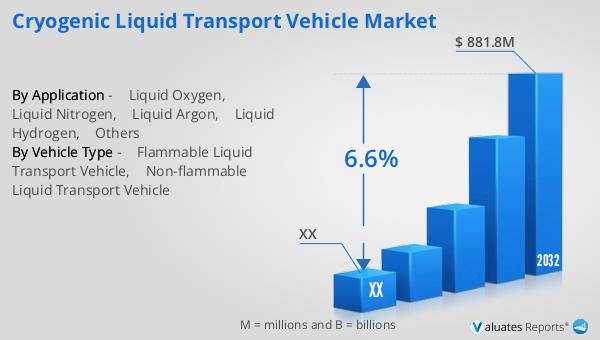
By vehicle type, the flammable liquid transport vehicle segment is expected to be the highest revenue contributor to the market, and is estimated to reach $881.8 million by 2032, with a CAGR of 6.6%.

Cryogenic Liquid Transport Vehicle Market

Cryogenic Liquid Transport Vehicle Market

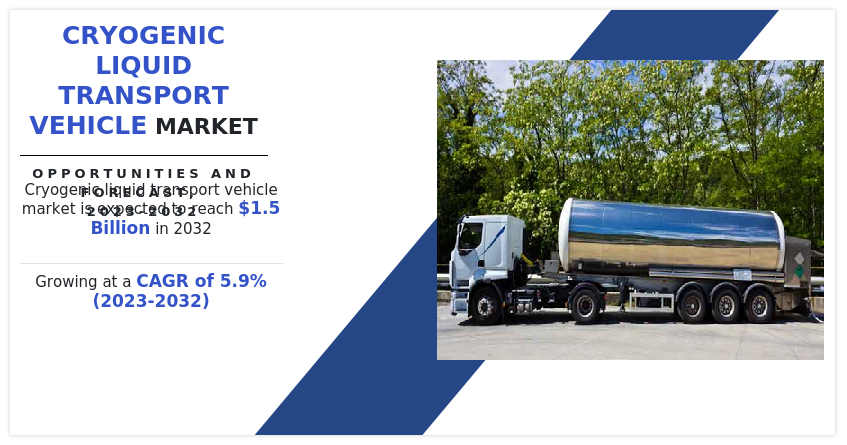
The cryogenic liquid transport vehicle market is likely to experience a growth rate of 5.9% from 2023-2032 owing to increasing market demand for transportation of LNG and hydrogen during the forecast period –
Cryogenic liquid transport vehicles are designed to maintain the required atmospheric conditions to transport cryogenic liquids safely. These vehicles comprise three layers namely outer vessel, the annular space, and the inner vessel. The annular layer is a vacuum layer that provides a barrier between heat from the exterior and the pressurized liquid on the interior to maintain stability. Cryogenic liquid transportation vehicles are also pressurized. Each vehicle has different specifications for maintenance of pressure levels and offer safety and efficient handling and transportation of cryogenics.
A non-flammable liquid transport vehicle is a specialized vehicle built to transport non-flammable liquids such as liquid nitrogen, argon, and CO2 in a safe and secure manner. These vehicles are meant to avoid leaks and spills during transit and are built to ensure compliance with strict safety standards. The liquid delivery vehicle is usually outfitted with specialized tanks or containers made of superior materials that can endure high temperatures and pressures. These tanks or containers are intended specifically to store and transport non-flammable liquids without the risk of combustion or explosion. Pressure relief valves, temperature sensors, and safety interlocks are among the vehicle's safety measures, which ensure that non-flammable liquids are transported within their safe working range. 
Safety restrictions and the need for reliable transportation of these gases are drivers for non-flammable liquid transport vehicles, such as those used for liquid nitrogen, argon, and CO2. Argon and CO2 are non-flammable gases that are employed in a variety of sectors such as welding and food and beverage processing. There are rules in place to ensure the safe handling and transportation of these gases. Demand for these liquified gases and their conveyance is projected to increase in a variety of industries.
Significant impacting factors in growth of the global cryogenic liquid transport vehicle market include greater demand for cryogenic gases from diverse industries, increase in demand for liquefied natural gas (LNG), and rise in adoption of clean energy sources. However, the high cost of cryogenic liquid transport vehicles hampers the growth of the market. Furthermore, technological advancement and rise in demand from developing countries are factors expected to offer growth opportunities during the forecast period.
The market also offers growth opportunities to the key players in the market. Rise in use of liquefied natural gas as fuel in vehicles across European countries and China has led to surge in its consumption in recent years. The liquefied natural gas fuel vehicle system carries natural gas to the engine at a required supply pressure while maximizing the fuel density of the fueling and tanks stations. These aspects are expected to fuel the demand for LNG during the forecast period. In addition, governments across the globe are now putting in efforts to reduce the share of coal-based power plants to reduce carbon emissions, which have the potential to render opportunities for increase in demand for liquefied natural gas for power generation, boosting the demand for cryogenic liquid transport vehicle market.
The cryogenic liquid transport vehicle market is segmented into vehicle type, application, and region. By vehicle type, it is segmented into non-flammable liquid transport vehicles and flammable liquid transport vehicles. By application, it is classified into liquid oxygen, liquid nitrogen, liquid argon, liquid hydrogen, and others.  By region, the market is analyzed across North America (the U.S., Canada, and Mexico), Europe (the UK, Germany, France, Italy, and rest of Europe), Asia-Pacific (China, India, Japan, South Korea, and rest of Asia-Pacific), and LAMEA (Latin America, Middle East, and Africa).
The key players profiled in the study include Chart Industries, Cryogenmash, FIBA Technologies, Inc., Shijiazhuang Enric Gas Equipment Co., Ltd., Karbonsan Pressure Vessel & Trading Co., Cryolor, Wessington Cryogenics, Eurotank GmbH, Cryogas Equipment Private Limited, and Zhangjiagang Furui CIT Co., Ltd. The players in the market have been actively engaged in the adoption of various strategies such as collaboration and acquisition to remain competitive and gain an advantage over the competitors in the market.
For instance, in April 2023, Chart Industries collaborated with Nikola Corporation, through the HYLA brand for liquid hydrogen storage tanks, transport trailers, and the development of new mobile & modular hydrogen refueling stations for quick deployment. It also includes the advancement of hydrogen technology for infrastructure and truck onboard fuel systems. Chart Industries also acquired cryogenic trailer and hydrogen trailer (transport) assets of Worthington Industries. This acquisition includes ownership of the Theodore, Alabama manufacturing site, all trailer-related intellectual property, manufacturing capabilities, equipment, and repair backlog.
Key Market Insights
Based on application, the liquid nitrogen segment is expected to be the highest revenue contributor to the market, with $225.5 million in 2022, and is estimated to reach $359.7 million by 2032, with a CAGR of 4.9%.
Based on region, Asia-Pacific is expected to be the highest revenue contributor, accounting for $342.4 million in 2022, and is estimated to reach $649.4 million by 2032, with a CAGR of 6.7%.

Overview

The cryogenic liquid transport vehicle market in Europe is developing due to increased demand for cryogenic liquids in healthcare, food and transportation industries and a shift towards sustainable energy sources. The UK, Germany, France, Italy, and other European countries are important players in this sector, with corporations spending on R&D to accommodate changing client needs. High levels of innovation and technological improvement characterize the market in Germany and France.
The increased demand for LNG is an important driver for flammable liquid cryogenic transport vehicles. Natural gas is a cleaner and more efficient fuel source than oil and coal, leading to a rise in demand for LNG. According to Shell, during 2021, global trading in liquefied natural gas surged. Trade reached 380 million tons, up by 21 million tons (or 6.0%) from 2020 and the global LNG demand is predicted to double by 2040. As the demand for LNG grows, so does the requirement for cryogenic transport vehicles that can safely transport the liquefied gas from production facilities to end users.
In May 2022, Chart Industries, Inc., a major global manufacturer of liquefaction and cryogenic equipment for many applications in the energy and industrial gas end sectors, finished the $4 million acquisition of CSC Cryogenic Service Centre AB of Sweden. This broadens regional presence and repair & service capabilities for mobile equipment, specifically trailers as well as ISO containers, stationary and transportable tanks, pumps, flowmeters, and LNG fueling stations.
The global demand for cryogenic liquids is driven by a surge in demand from energy and power generation, manufacturing, aerospace, biomedical & healthcare, and chemical industries. There is growth in demand for industrial gases such as liquid oxygen, nitrogen, liquid nitrogen, and specialty gases in diverse sectors. Liquid nitrogen is used during transplant procedures in blood bank storage units and for the cryogenic storage of body organs.
Furthermore, economic growth in emerging countries is anticipated to result in the establishment of new research facilities and institutes in the coming years. This rise in research and testing facilities, especially in the field of pharmaceuticals and biotechnology, is expected to propel the demand for cryogenic gases, in turn driving the demand for cryogenic liquid transport vehicles.
The cryogenic liquid transport vehicle market is segmented on the basis of vehicle type, application, and region. By vehicle type, it is segmented into non-flammable liquid transport vehicles and flammable liquid transport vehicles. By application, it is classified into liquid oxygen, liquid nitrogen, liquid argon, liquid hydrogen, and others. By region, the market is analyzed across North America, Europe, Asia-Pacific, and LAMEA.
Some leading companies profiled in the report comprise Chart Industries, Cryogenmash, FIBA Technologies, Inc., Shijiazhuang Enric Gas Equipment Co., Ltd., Karbonsan Pressure Vessel & Trading o., Cryolor, Wessington Cryogenics, Eurotank GmbH, Cryogas Equipment Private Limited, and Zhangjiagang Furui CIT Co., Ltd.

Key Benefits For Stakeholders

●This report provides a quantitative analysis of the market segments, current trends, estimations, and dynamics of the cryogenic liquid transport vehicle market analysis from 2022 to 2032 to identify the prevailing cryogenic liquid transport vehicle market opportunities.
●The market research is offered along with information related to key drivers, restraints, and opportunities.
●Porter's five forces analysis highlights the potency of buyers and suppliers to enable stakeholders make profit-oriented business decisions and strengthen their supplier-buyer network.
●In-depth analysis of the cryogenic liquid transport vehicle market segmentation assists to determine the prevailing market opportunities.
●Major countries in each region are mapped according to their revenue contribution to the global market.
●Market player positioning facilitates benchmarking and provides a clear understanding of the present position of the market players.
●The report includes the analysis of the regional as well as global cryogenic liquid transport vehicle market trends, key players, market segments, application areas, and market growth strategies.
Key Market Segments
○ Zhangjiagang Furui CIT Co., Ltd

Scope of Cryogenic Liquid Transport Vehicle Market Report

Report Metric Details
Report Name Cryogenic Liquid Transport Vehicle Market
Forecasted market size in 2032 $ 881.8 million
CAGR 6.6%
Forecasted years 2024 - 2032
By Vehicle Type ● Flammable Liquid Transport Vehicle
● Non-flammable Liquid Transport Vehicle
By Application ● Liquid Oxygen
● Liquid Nitrogen
● Liquid Argon
● Liquid Hydrogen
● Others
By Region
  • North America (United States, Canada)
  • Europe (Germany, France, UK, Italy, Russia) Rest of Europe
  • Nordic Countries
  • Asia-Pacific (China, Japan, South Korea)
  • Southeast Asia (India, Australia)
  • Rest of Asia
  • Latin America (Mexico, Brazil)
  • Rest of Latin America
  • Middle East & Africa (Turkey, Saudi Arabia, UAE, Rest of MEA)
Forecast units USD million in value
Report coverage Revenue and volume forecast, company share, competitive landscape, growth factors and trends

FAQ for this report

What is the Cryogenic Liquid Transport Vehicle Market size in 2032?

Ans: The Cryogenic Liquid Transport Vehicle Market size in 2032 will be $ 881.8 million.

What are the Application segmentation covered in the Cryogenic Liquid Transport Vehicle Market report?

Ans: The Applications covered in the Cryogenic Liquid Transport Vehicle Market report are ● Liquid Oxygen, ● Liquid Nitrogen, ● Liquid Argon, ● Liquid Hydrogen, ● Others

What are the Type segmentation covered in the Cryogenic Liquid Transport Vehicle Market report?

Ans: The Types covered in the Cryogenic Liquid Transport Vehicle Market report are ● Flammable Liquid Transport Vehicle, ● Non-flammable Liquid Transport Vehicle

CHAPTER 1: INTRODUCTION
1.1. Report description
1.2. Key market segments
1.3. Key benefits to the stakeholders
1.4. Research Methodology
1.4.1. Primary research
1.4.2. Secondary research
1.4.3. Analyst tools and models
CHAPTER 2: EXECUTIVE SUMMARY
2.1. CXO Perspective
CHAPTER 3: MARKET OVERVIEW
3.1. Market definition and scope
3.2. Key findings
3.2.1. Top impacting factors
3.2.2. Top investment pockets
3.3. Porter’s five forces analysis
3.3.1. Bargaining power of suppliers
3.3.2. Bargaining power of buyers
3.3.3. Threat of substitutes
3.3.4. Threat of new entrants
3.3.5. Intensity of rivalry
3.4. Market dynamics
3.4.1. Drivers
3.4.1.1. Increase in demand for cryogenic gases from diverse industries
3.4.1.2. Rise in demand for Liquefied Natural Gas (LNG)
3.4.1.3. Increase in adoption of clean energy sources
3.4.2. Restraints
3.4.2.1. High costs associated with cryogenic liquid transport vehicles
3.4.3. Opportunities
3.4.3.1. Technological advancement
3.4.3.2. Greater demand from developing countries
3.5. COVID-19 Impact Analysis on the market
CHAPTER 4: CRYOGENIC LIQUID TRANSPORT VEHICLE MARKET, BY VEHICLE TYPE
4.1. Overview
4.1.1. Market size and forecast
4.2. Flammable Liquid Transport Vehicle
4.2.1. Key market trends, growth factors and opportunities
4.2.2. Market size and forecast, by region
4.2.3. Market share analysis by country
4.3. Non-flammable Liquid Transport Vehicle
4.3.1. Key market trends, growth factors and opportunities
4.3.2. Market size and forecast, by region
4.3.3. Market share analysis by country
CHAPTER 5: CRYOGENIC LIQUID TRANSPORT VEHICLE MARKET, BY APPLICATION
5.1. Overview
5.1.1. Market size and forecast
5.2. Liquid Oxygen
5.2.1. Key market trends, growth factors and opportunities
5.2.2. Market size and forecast, by region
5.2.3. Market share analysis by country
5.3. Liquid Nitrogen
5.3.1. Key market trends, growth factors and opportunities
5.3.2. Market size and forecast, by region
5.3.3. Market share analysis by country
5.4. Liquid Argon
5.4.1. Key market trends, growth factors and opportunities
5.4.2. Market size and forecast, by region
5.4.3. Market share analysis by country
5.5. Liquid Hydrogen
5.5.1. Key market trends, growth factors and opportunities
5.5.2. Market size and forecast, by region
5.5.3. Market share analysis by country
5.6. Others
5.6.1. Key market trends, growth factors and opportunities
5.6.2. Market size and forecast, by region
5.6.3. Market share analysis by country
CHAPTER 6: CRYOGENIC LIQUID TRANSPORT VEHICLE MARKET, BY REGION
6.1. Overview
6.1.1. Market size and forecast By Region
6.2. North America
6.2.1. Key trends and opportunities
6.2.2. Market size and forecast, by Vehicle Type
6.2.3. Market size and forecast, by Application
6.2.4. Market size and forecast, by country
6.2.4.1. U.S.
6.2.4.1.1. Key market trends, growth factors and opportunities
6.2.4.1.2. Market size and forecast, by Vehicle Type
6.2.4.1.3. Market size and forecast, by Application
6.2.4.2. Canada
6.2.4.2.1. Key market trends, growth factors and opportunities
6.2.4.2.2. Market size and forecast, by Vehicle Type
6.2.4.2.3. Market size and forecast, by Application
6.2.4.3. Mexico
6.2.4.3.1. Key market trends, growth factors and opportunities
6.2.4.3.2. Market size and forecast, by Vehicle Type
6.2.4.3.3. Market size and forecast, by Application
6.3. Europe
6.3.1. Key trends and opportunities
6.3.2. Market size and forecast, by Vehicle Type
6.3.3. Market size and forecast, by Application
6.3.4. Market size and forecast, by country
6.3.4.1. Germany
6.3.4.1.1. Key market trends, growth factors and opportunities
6.3.4.1.2. Market size and forecast, by Vehicle Type
6.3.4.1.3. Market size and forecast, by Application
6.3.4.2. UK
6.3.4.2.1. Key market trends, growth factors and opportunities
6.3.4.2.2. Market size and forecast, by Vehicle Type
6.3.4.2.3. Market size and forecast, by Application
6.3.4.3. France
6.3.4.3.1. Key market trends, growth factors and opportunities
6.3.4.3.2. Market size and forecast, by Vehicle Type
6.3.4.3.3. Market size and forecast, by Application
6.3.4.4. Italy
6.3.4.4.1. Key market trends, growth factors and opportunities
6.3.4.4.2. Market size and forecast, by Vehicle Type
6.3.4.4.3. Market size and forecast, by Application
6.3.4.5. Rest of Europe
6.3.4.5.1. Key market trends, growth factors and opportunities
6.3.4.5.2. Market size and forecast, by Vehicle Type
6.3.4.5.3. Market size and forecast, by Application
6.4. Asia-Pacific
6.4.1. Key trends and opportunities
6.4.2. Market size and forecast, by Vehicle Type
6.4.3. Market size and forecast, by Application
6.4.4. Market size and forecast, by country
6.4.4.1. China
6.4.4.1.1. Key market trends, growth factors and opportunities
6.4.4.1.2. Market size and forecast, by Vehicle Type
6.4.4.1.3. Market size and forecast, by Application
6.4.4.2. Japan
6.4.4.2.1. Key market trends, growth factors and opportunities
6.4.4.2.2. Market size and forecast, by Vehicle Type
6.4.4.2.3. Market size and forecast, by Application
6.4.4.3. India
6.4.4.3.1. Key market trends, growth factors and opportunities
6.4.4.3.2. Market size and forecast, by Vehicle Type
6.4.4.3.3. Market size and forecast, by Application
6.4.4.4. South Korea
6.4.4.4.1. Key market trends, growth factors and opportunities
6.4.4.4.2. Market size and forecast, by Vehicle Type
6.4.4.4.3. Market size and forecast, by Application
6.4.4.5. Rest of Asia-Pacific
6.4.4.5.1. Key market trends, growth factors and opportunities
6.4.4.5.2. Market size and forecast, by Vehicle Type
6.4.4.5.3. Market size and forecast, by Application
6.5. LAMEA
6.5.1. Key trends and opportunities
6.5.2. Market size and forecast, by Vehicle Type
6.5.3. Market size and forecast, by Application
6.5.4. Market size and forecast, by country
6.5.4.1. Latin America
6.5.4.1.1. Key market trends, growth factors and opportunities
6.5.4.1.2. Market size and forecast, by Vehicle Type
6.5.4.1.3. Market size and forecast, by Application
6.5.4.2. Middle East
6.5.4.2.1. Key market trends, growth factors and opportunities
6.5.4.2.2. Market size and forecast, by Vehicle Type
6.5.4.2.3. Market size and forecast, by Application
6.5.4.3. Africa
6.5.4.3.1. Key market trends, growth factors and opportunities
6.5.4.3.2. Market size and forecast, by Vehicle Type
6.5.4.3.3. Market size and forecast, by Application
CHAPTER 7: COMPETITIVE LANDSCAPE
7.1. Introduction
7.2. Top winning strategies
7.3. Product Mapping of Top 10 Player
7.4. Competitive Dashboard
7.5. Competitive Heatmap
7.6. Top player positioning, 2022
CHAPTER 8: COMPANY PROFILES
8.1. Cryolor
8.1.1. Company overview
8.1.2. Key Executives
8.1.3. Company snapshot
8.1.4. Operating business segments
8.1.5. Product portfolio
8.1.6. Key strategic moves and developments
8.2. Eurotank GmbH
8.2.1. Company overview
8.2.2. Key Executives
8.2.3. Company snapshot
8.2.4. Operating business segments
8.2.5. Product portfolio
8.3. FIBA Technologies, Inc.
8.3.1. Company overview
8.3.2. Key Executives
8.3.3. Company snapshot
8.3.4. Operating business segments
8.3.5. Product portfolio
8.4. Zhangjiagang Furui CIT Co., Ltd.
8.4.1. Company overview
8.4.2. Key Executives
8.4.3. Company snapshot
8.4.4. Operating business segments
8.4.5. Product portfolio
8.4.6. Key strategic moves and developments
8.5. Karbonsan Pressure Vessel & Trading Co.
8.5.1. Company overview
8.5.2. Key Executives
8.5.3. Company snapshot
8.5.4. Operating business segments
8.5.5. Product portfolio
8.6. Chart Industries
8.6.1. Company overview
8.6.2. Key Executives
8.6.3. Company snapshot
8.6.4. Operating business segments
8.6.5. Product portfolio
8.6.6. Business performance
8.6.7. Key strategic moves and developments
8.7. Shijiazhuang Enric Gas Equipment Co., Ltd.
8.7.1. Company overview
8.7.2. Key Executives
8.7.3. Company snapshot
8.7.4. Operating business segments
8.7.5. Product portfolio
8.8. Cryogenmash
8.8.1. Company overview
8.8.2. Key Executives
8.8.3. Company snapshot
8.8.4. Operating business segments
8.8.5. Product portfolio
8.9. Wessington Cryogenics
8.9.1. Company overview
8.9.2. Key Executives
8.9.3. Company snapshot
8.9.4. Operating business segments
8.9.5. Product portfolio
8.10. Cryogas Equipment Private Limited
8.10.1. Company overview
8.10.2. Key Executives
8.10.3. Company snapshot
8.10.4. Operating business segments
8.10.5. Product portfoli
LIST OF TABLES
TABLE 01. GLOBAL CRYOGENIC LIQUID TRANSPORT VEHICLE MARKET, BY VEHICLE TYPE, 2022-2032 ($MILLION)
TABLE 02. CRYOGENIC LIQUID TRANSPORT VEHICLE MARKET FOR FLAMMABLE LIQUID TRANSPORT VEHICLE, BY REGION, 2022-2032 ($MILLION)
TABLE 03. CRYOGENIC LIQUID TRANSPORT VEHICLE MARKET FOR NON-FLAMMABLE LIQUID TRANSPORT VEHICLE, BY REGION, 2022-2032 ($MILLION)
TABLE 04. GLOBAL CRYOGENIC LIQUID TRANSPORT VEHICLE MARKET, BY APPLICATION, 2022-2032 ($MILLION)
TABLE 05. CRYOGENIC LIQUID TRANSPORT VEHICLE MARKET FOR LIQUID OXYGEN, BY REGION, 2022-2032 ($MILLION)
TABLE 06. CRYOGENIC LIQUID TRANSPORT VEHICLE MARKET FOR LIQUID NITROGEN, BY REGION, 2022-2032 ($MILLION)
TABLE 07. CRYOGENIC LIQUID TRANSPORT VEHICLE MARKET FOR LIQUID ARGON, BY REGION, 2022-2032 ($MILLION)
TABLE 08. CRYOGENIC LIQUID TRANSPORT VEHICLE MARKET FOR LIQUID HYDROGEN, BY REGION, 2022-2032 ($MILLION)
TABLE 09. CRYOGENIC LIQUID TRANSPORT VEHICLE MARKET FOR OTHERS, BY REGION, 2022-2032 ($MILLION)
TABLE 10. CRYOGENIC LIQUID TRANSPORT VEHICLE MARKET, BY REGION, 2022-2032 ($MILLION)
TABLE 11. NORTH AMERICA CRYOGENIC LIQUID TRANSPORT VEHICLE MARKET, BY VEHICLE TYPE, 2022-2032 ($MILLION)
TABLE 12. NORTH AMERICA CRYOGENIC LIQUID TRANSPORT VEHICLE MARKET, BY APPLICATION, 2022-2032 ($MILLION)
TABLE 13. NORTH AMERICA CRYOGENIC LIQUID TRANSPORT VEHICLE MARKET, BY COUNTRY, 2022-2032 ($MILLION)
TABLE 14. U.S. CRYOGENIC LIQUID TRANSPORT VEHICLE MARKET, BY VEHICLE TYPE, 2022-2032 ($MILLION)
TABLE 15. U.S. CRYOGENIC LIQUID TRANSPORT VEHICLE MARKET, BY APPLICATION, 2022-2032 ($MILLION)
TABLE 16. CANADA CRYOGENIC LIQUID TRANSPORT VEHICLE MARKET, BY VEHICLE TYPE, 2022-2032 ($MILLION)
TABLE 17. CANADA CRYOGENIC LIQUID TRANSPORT VEHICLE MARKET, BY APPLICATION, 2022-2032 ($MILLION)
TABLE 18. MEXICO CRYOGENIC LIQUID TRANSPORT VEHICLE MARKET, BY VEHICLE TYPE, 2022-2032 ($MILLION)
TABLE 19. MEXICO CRYOGENIC LIQUID TRANSPORT VEHICLE MARKET, BY APPLICATION, 2022-2032 ($MILLION)
TABLE 20. EUROPE CRYOGENIC LIQUID TRANSPORT VEHICLE MARKET, BY VEHICLE TYPE, 2022-2032 ($MILLION)
TABLE 21. EUROPE CRYOGENIC LIQUID TRANSPORT VEHICLE MARKET, BY APPLICATION, 2022-2032 ($MILLION)
TABLE 22. EUROPE CRYOGENIC LIQUID TRANSPORT VEHICLE MARKET, BY COUNTRY, 2022-2032 ($MILLION)
TABLE 23. GERMANY CRYOGENIC LIQUID TRANSPORT VEHICLE MARKET, BY VEHICLE TYPE, 2022-2032 ($MILLION)
TABLE 24. GERMANY CRYOGENIC LIQUID TRANSPORT VEHICLE MARKET, BY APPLICATION, 2022-2032 ($MILLION)
TABLE 25. UK CRYOGENIC LIQUID TRANSPORT VEHICLE MARKET, BY VEHICLE TYPE, 2022-2032 ($MILLION)
TABLE 26. UK CRYOGENIC LIQUID TRANSPORT VEHICLE MARKET, BY APPLICATION, 2022-2032 ($MILLION)
TABLE 27. FRANCE CRYOGENIC LIQUID TRANSPORT VEHICLE MARKET, BY VEHICLE TYPE, 2022-2032 ($MILLION)
TABLE 28. FRANCE CRYOGENIC LIQUID TRANSPORT VEHICLE MARKET, BY APPLICATION, 2022-2032 ($MILLION)
TABLE 29. ITALY CRYOGENIC LIQUID TRANSPORT VEHICLE MARKET, BY VEHICLE TYPE, 2022-2032 ($MILLION)
TABLE 30. ITALY CRYOGENIC LIQUID TRANSPORT VEHICLE MARKET, BY APPLICATION, 2022-2032 ($MILLION)
TABLE 31. REST OF EUROPE CRYOGENIC LIQUID TRANSPORT VEHICLE MARKET, BY VEHICLE TYPE, 2022-2032 ($MILLION)
TABLE 32. REST OF EUROPE CRYOGENIC LIQUID TRANSPORT VEHICLE MARKET, BY APPLICATION, 2022-2032 ($MILLION)
TABLE 33. ASIA-PACIFIC CRYOGENIC LIQUID TRANSPORT VEHICLE MARKET, BY VEHICLE TYPE, 2022-2032 ($MILLION)
TABLE 34. ASIA-PACIFIC CRYOGENIC LIQUID TRANSPORT VEHICLE MARKET, BY APPLICATION, 2022-2032 ($MILLION)
TABLE 35. ASIA-PACIFIC CRYOGENIC LIQUID TRANSPORT VEHICLE MARKET, BY COUNTRY, 2022-2032 ($MILLION)
TABLE 36. CHINA CRYOGENIC LIQUID TRANSPORT VEHICLE MARKET, BY VEHICLE TYPE, 2022-2032 ($MILLION)
TABLE 37. CHINA CRYOGENIC LIQUID TRANSPORT VEHICLE MARKET, BY APPLICATION, 2022-2032 ($MILLION)
TABLE 38. JAPAN CRYOGENIC LIQUID TRANSPORT VEHICLE MARKET, BY VEHICLE TYPE, 2022-2032 ($MILLION)
TABLE 39. JAPAN CRYOGENIC LIQUID TRANSPORT VEHICLE MARKET, BY APPLICATION, 2022-2032 ($MILLION)
TABLE 40. INDIA CRYOGENIC LIQUID TRANSPORT VEHICLE MARKET, BY VEHICLE TYPE, 2022-2032 ($MILLION)
TABLE 41. INDIA CRYOGENIC LIQUID TRANSPORT VEHICLE MARKET, BY APPLICATION, 2022-2032 ($MILLION)
TABLE 42. SOUTH KOREA CRYOGENIC LIQUID TRANSPORT VEHICLE MARKET, BY VEHICLE TYPE, 2022-2032 ($MILLION)
TABLE 43. SOUTH KOREA CRYOGENIC LIQUID TRANSPORT VEHICLE MARKET, BY APPLICATION, 2022-2032 ($MILLION)
TABLE 44. REST OF ASIA-PACIFIC CRYOGENIC LIQUID TRANSPORT VEHICLE MARKET, BY VEHICLE TYPE, 2022-2032 ($MILLION)
TABLE 45. REST OF ASIA-PACIFIC CRYOGENIC LIQUID TRANSPORT VEHICLE MARKET, BY APPLICATION, 2022-2032 ($MILLION)
TABLE 46. LAMEA CRYOGENIC LIQUID TRANSPORT VEHICLE MARKET, BY VEHICLE TYPE, 2022-2032 ($MILLION)
TABLE 47. LAMEA CRYOGENIC LIQUID TRANSPORT VEHICLE MARKET, BY APPLICATION, 2022-2032 ($MILLION)
TABLE 48. LAMEA CRYOGENIC LIQUID TRANSPORT VEHICLE MARKET, BY COUNTRY, 2022-2032 ($MILLION)
TABLE 49. LATIN AMERICA CRYOGENIC LIQUID TRANSPORT VEHICLE MARKET, BY VEHICLE TYPE, 2022-2032 ($MILLION)
TABLE 50. LATIN AMERICA CRYOGENIC LIQUID TRANSPORT VEHICLE MARKET, BY APPLICATION, 2022-2032 ($MILLION)
TABLE 51. MIDDLE EAST CRYOGENIC LIQUID TRANSPORT VEHICLE MARKET, BY VEHICLE TYPE, 2022-2032 ($MILLION)
TABLE 52. MIDDLE EAST CRYOGENIC LIQUID TRANSPORT VEHICLE MARKET, BY APPLICATION, 2022-2032 ($MILLION)
TABLE 53. AFRICA CRYOGENIC LIQUID TRANSPORT VEHICLE MARKET, BY VEHICLE TYPE, 2022-2032 ($MILLION)
TABLE 54. AFRICA CRYOGENIC LIQUID TRANSPORT VEHICLE MARKET, BY APPLICATION, 2022-2032 ($MILLION)
TABLE 55. CRYOLOR: KEY EXECUTIVES
TABLE 56. CRYOLOR: COMPANY SNAPSHOT
TABLE 57. CRYOLOR: PRODUCT SEGMENTS
TABLE 58. CRYOLOR: PRODUCT PORTFOLIO
TABLE 59. CRYOLOR: KEY STRATERGIES
TABLE 60. EUROTANK GMBH: KEY EXECUTIVES
TABLE 61. EUROTANK GMBH: COMPANY SNAPSHOT
TABLE 62. EUROTANK GMBH: PRODUCT SEGMENTS
TABLE 63. EUROTANK GMBH: PRODUCT PORTFOLIO
TABLE 64. FIBA TECHNOLOGIES, INC.: KEY EXECUTIVES
TABLE 65. FIBA TECHNOLOGIES, INC.: COMPANY SNAPSHOT
TABLE 66. FIBA TECHNOLOGIES, INC.: PRODUCT SEGMENTS
TABLE 67. FIBA TECHNOLOGIES, INC.: PRODUCT PORTFOLIO
TABLE 68. ZHANGJIAGANG FURUI CIT CO., LTD.: KEY EXECUTIVES
TABLE 69. ZHANGJIAGANG FURUI CIT CO., LTD.: COMPANY SNAPSHOT
TABLE 70. ZHANGJIAGANG FURUI CIT CO., LTD.: PRODUCT SEGMENTS
TABLE 71. ZHANGJIAGANG FURUI CIT CO., LTD.: PRODUCT PORTFOLIO
TABLE 72. ZHANGJIAGANG FURUI CIT CO., LTD.: KEY STRATERGIES
TABLE 73. KARBONSAN PRESSURE VESSEL & TRADING CO.: KEY EXECUTIVES
TABLE 74. KARBONSAN PRESSURE VESSEL & TRADING CO.: COMPANY SNAPSHOT
TABLE 75. KARBONSAN PRESSURE VESSEL & TRADING CO.: PRODUCT SEGMENTS
TABLE 76. KARBONSAN PRESSURE VESSEL & TRADING CO.: PRODUCT PORTFOLIO
TABLE 77. CHART INDUSTRIES: KEY EXECUTIVES
TABLE 78. CHART INDUSTRIES: COMPANY SNAPSHOT
TABLE 79. CHART INDUSTRIES: PRODUCT SEGMENTS
TABLE 80. CHART INDUSTRIES: PRODUCT PORTFOLIO
TABLE 81. CHART INDUSTRIES: KEY STRATERGIES
TABLE 82. SHIJIAZHUANG ENRIC GAS EQUIPMENT CO., LTD.: KEY EXECUTIVES
TABLE 83. SHIJIAZHUANG ENRIC GAS EQUIPMENT CO., LTD.: COMPANY SNAPSHOT
TABLE 84. SHIJIAZHUANG ENRIC GAS EQUIPMENT CO., LTD.: PRODUCT SEGMENTS
TABLE 85. SHIJIAZHUANG ENRIC GAS EQUIPMENT CO., LTD.: PRODUCT PORTFOLIO
TABLE 86. CRYOGENMASH: KEY EXECUTIVES
TABLE 87. CRYOGENMASH: COMPANY SNAPSHOT
TABLE 88. CRYOGENMASH: PRODUCT SEGMENTS
TABLE 89. CRYOGENMASH: PRODUCT PORTFOLIO
TABLE 90. WESSINGTON CRYOGENICS: KEY EXECUTIVES
TABLE 91. WESSINGTON CRYOGENICS: COMPANY SNAPSHOT
TABLE 92. WESSINGTON CRYOGENICS: PRODUCT SEGMENTS
TABLE 93. WESSINGTON CRYOGENICS: PRODUCT PORTFOLIO
TABLE 94. CRYOGAS EQUIPMENT PRIVATE LIMITED: KEY EXECUTIVES
TABLE 95. CRYOGAS EQUIPMENT PRIVATE LIMITED: COMPANY SNAPSHOT
TABLE 96. CRYOGAS EQUIPMENT PRIVATE LIMITED: PRODUCT SEGMENTS
TABLE 97. CRYOGAS EQUIPMENT PRIVATE LIMITED: PRODUCT PORTFOLIO LIST OF FIGURES
FIGURE 01. CRYOGENIC LIQUID TRANSPORT VEHICLE MARKET, 2022-2032
FIGURE 02. SEGMENTATION OF CRYOGENIC LIQUID TRANSPORT VEHICLE MARKET, 2022-2032
FIGURE 03. TOP INVESTMENT POCKETS IN CRYOGENIC LIQUID TRANSPORT VEHICLE MARKET (2023-2032)
FIGURE 04. LOW BARGAINING POWER OF SUPPLIERS
FIGURE 05. LOW BARGAINING POWER OF BUYERS
FIGURE 06. LOW THREAT OF SUBSTITUTES
FIGURE 07. LOW THREAT OF NEW ENTRANTS
FIGURE 08. LOW INTENSITY OF RIVALRY
FIGURE 09. DRIVERS, RESTRAINTS AND OPPORTUNITIES: GLOBALCRYOGENIC LIQUID TRANSPORT VEHICLE MARKET
FIGURE 10. CRYOGENIC LIQUID TRANSPORT VEHICLE MARKET, BY VEHICLE TYPE, 2022(%)
FIGURE 11. COMPARATIVE SHARE ANALYSIS OF CRYOGENIC LIQUID TRANSPORT VEHICLE MARKET FOR FLAMMABLE LIQUID TRANSPORT VEHICLE, BY COUNTRY 2022 AND 2032(%)
FIGURE 12. COMPARATIVE SHARE ANALYSIS OF CRYOGENIC LIQUID TRANSPORT VEHICLE MARKET FOR NON-FLAMMABLE LIQUID TRANSPORT VEHICLE, BY COUNTRY 2022 AND 2032(%)
FIGURE 13. CRYOGENIC LIQUID TRANSPORT VEHICLE MARKET, BY APPLICATION, 2022(%)
FIGURE 14. COMPARATIVE SHARE ANALYSIS OF CRYOGENIC LIQUID TRANSPORT VEHICLE MARKET FOR LIQUID OXYGEN, BY COUNTRY 2022 AND 2032(%)
FIGURE 15. COMPARATIVE SHARE ANALYSIS OF CRYOGENIC LIQUID TRANSPORT VEHICLE MARKET FOR LIQUID NITROGEN, BY COUNTRY 2022 AND 2032(%)
FIGURE 16. COMPARATIVE SHARE ANALYSIS OF CRYOGENIC LIQUID TRANSPORT VEHICLE MARKET FOR LIQUID ARGON, BY COUNTRY 2022 AND 2032(%)
FIGURE 17. COMPARATIVE SHARE ANALYSIS OF CRYOGENIC LIQUID TRANSPORT VEHICLE MARKET FOR LIQUID HYDROGEN, BY COUNTRY 2022 AND 2032(%)
FIGURE 18. COMPARATIVE SHARE ANALYSIS OF CRYOGENIC LIQUID TRANSPORT VEHICLE MARKET FOR OTHERS, BY COUNTRY 2022 AND 2032(%)
FIGURE 19. CRYOGENIC LIQUID TRANSPORT VEHICLE MARKET BY REGION, 2022
FIGURE 20. U.S. CRYOGENIC LIQUID TRANSPORT VEHICLE MARKET, 2022-2032 ($MILLION)
FIGURE 21. CANADA CRYOGENIC LIQUID TRANSPORT VEHICLE MARKET, 2022-2032 ($MILLION)
FIGURE 22. MEXICO CRYOGENIC LIQUID TRANSPORT VEHICLE MARKET, 2022-2032 ($MILLION)
FIGURE 23. GERMANY CRYOGENIC LIQUID TRANSPORT VEHICLE MARKET, 2022-2032 ($MILLION)
FIGURE 24. UK CRYOGENIC LIQUID TRANSPORT VEHICLE MARKET, 2022-2032 ($MILLION)
FIGURE 25. FRANCE CRYOGENIC LIQUID TRANSPORT VEHICLE MARKET, 2022-2032 ($MILLION)
FIGURE 26. ITALY CRYOGENIC LIQUID TRANSPORT VEHICLE MARKET, 2022-2032 ($MILLION)
FIGURE 27. REST OF EUROPE CRYOGENIC LIQUID TRANSPORT VEHICLE MARKET, 2022-2032 ($MILLION)
FIGURE 28. CHINA CRYOGENIC LIQUID TRANSPORT VEHICLE MARKET, 2022-2032 ($MILLION)
FIGURE 29. JAPAN CRYOGENIC LIQUID TRANSPORT VEHICLE MARKET, 2022-2032 ($MILLION)
FIGURE 30. INDIA CRYOGENIC LIQUID TRANSPORT VEHICLE MARKET, 2022-2032 ($MILLION)
FIGURE 31. SOUTH KOREA CRYOGENIC LIQUID TRANSPORT VEHICLE MARKET, 2022-2032 ($MILLION)
FIGURE 32. REST OF ASIA-PACIFIC CRYOGENIC LIQUID TRANSPORT VEHICLE MARKET, 2022-2032 ($MILLION)
FIGURE 33. LATIN AMERICA CRYOGENIC LIQUID TRANSPORT VEHICLE MARKET, 2022-2032 ($MILLION)
FIGURE 34. MIDDLE EAST CRYOGENIC LIQUID TRANSPORT VEHICLE MARKET, 2022-2032 ($MILLION)
FIGURE 35. AFRICA CRYOGENIC LIQUID TRANSPORT VEHICLE MARKET, 2022-2032 ($MILLION)
FIGURE 36. TOP WINNING STRATEGIES, BY YEAR
FIGURE 37. TOP WINNING STRATEGIES, BY DEVELOPMENT
FIGURE 38. TOP WINNING STRATEGIES, BY COMPANY
FIGURE 39. PRODUCT MAPPING OF TOP 10 PLAYERS
FIGURE 40. COMPETITIVE DASHBOARD
FIGURE 41. COMPETITIVE HEATMAP: CRYOGENIC LIQUID TRANSPORT VEHICLE MARKET
FIGURE 42. TOP PLAYER POSITIONING, 2022
FIGURE 43. CHART INDUSTRIES: NET SALES, 2020-2022 ($MILLION)
FIGURE 44. CHART INDUSTRIES: RESEARCH & DEVELOPMENT EXPENDITURE, 2020-2022 ($MILLION)
FIGURE 45. CHART INDUSTRIES: REVENUE SHARE BY REGION, 2022 (%)
FIGURE 46. CHART INDUSTRIES: REVENUE SHARE BY REGION, 2022 (%
SELECT A FORMAT
Added to Cart
Electronic (PDF)

$5730

This license allows only one user to access the PDF.
Electronic (PDF)

$6450

This license allows 1 - 5 user to access the PDF, license is suitable for small groups of 5 users working together
Electronic (PDF)

$9600

This license allows users/teams in a same Enterprise to use this report, various departments within an enterpise can use this report
Electronic (PDF)

$3840

This license just provides quantitative data in a excel sheet
Add to Cart
Buy Now (15% Discount)

OUR CUSTOMER

Leap India

SIMILAR REPORTS


RELATED REPORTS

High-Loft Nonwovens - Global Market Share and Ranking, Overall Sales and Demand Forecast 2024-2030

120 Pages
Type: Report
Code: QYRE-Auto-11L14477
Tue Apr 30 00:00:00 UTC 2024

Add to Cart

Global Oilfield Casing Centralizer Market Research Report 2024

120 Pages
Type: Report
Code: QYRE-Auto-22W12581
Tue Apr 30 00:00:00 UTC 2024

Add to Cart

Wax Dispersants - Global Market Share and Ranking, Overall Sales and Demand Forecast 2024-2030

120 Pages
Type: Report
Code: QYRE-Auto-11G14369
Tue Apr 30 00:00:00 UTC 2024

Add to Cart

Monotube Damper - Global Market Share and Ranking, Overall Sales and Demand Forecast 2024-2030

120 Pages
Type: Report
Code: QYRE-Auto-39Q14250
Tue Apr 30 00:00:00 UTC 2024

Add to Cart