
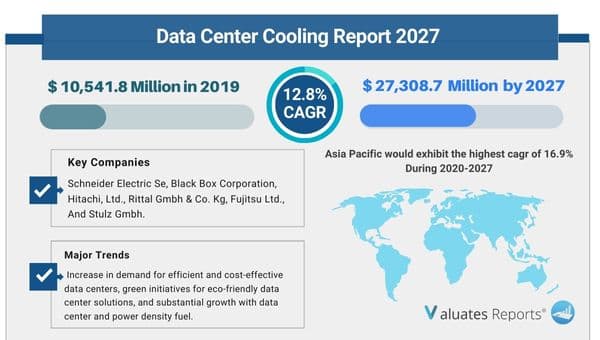
The global data center cooling market size was valued at $10,541.8 million in 2019 and is projected to reach $27,308.7 million by 2027, growing at a CAGR of 12.8% from 2020 to 2027.
Data center cooling refers to the collective tools, techniques, and equipment that ensure the temperature is within permissible limit in data centers. Cooling system maintains the required air circulation to each row and rack in the data centers. Data center cooling systems consist of infrastructure, management, and monitoring. Infrastructure includes air ducts, chillers, air conditioners, and cooling towers among others. Management includes management software deployed in data center cooling while monitoring includes equipment & procedure for monitoring data center temperature.
The factors such as increase in demand for efficient and cost-effective data centers, green initiatives for eco-friendly data center solutions, and substantial growth with data center and power density fuel the growth of the global data center cooling market. However, the requirement of specialized infrastructure & higher investment cost hinders the growth of the global market. In addition, cooling challenges during power outages are also expected to impede the growth of the global market. Furthermore, emergence of liquid-based & portable cooling and rise in requirement for modular data center cooling approach are anticipated to fuel the growth of the data center cooling market.
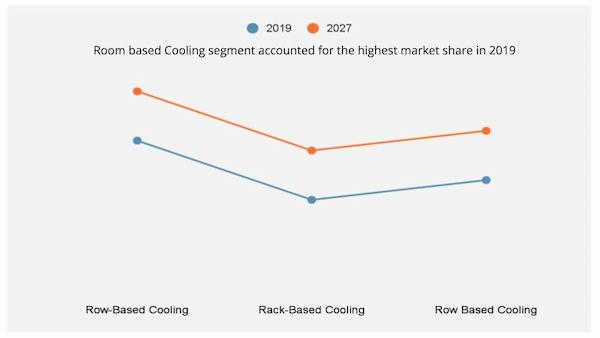
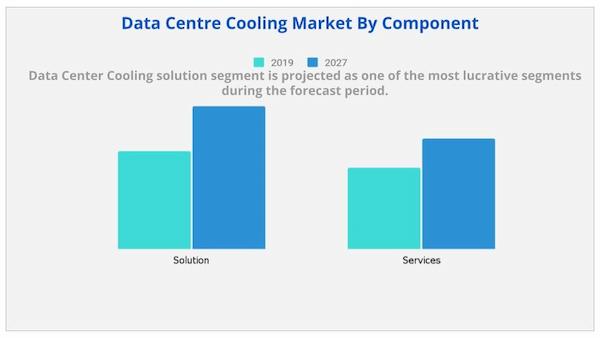
The global data center cooling market is segmented on the basis of component, type of cooling, type of data centers, industry verticals, and region. Based on component, it is categorized into solutions and services. Based on type of cooling, the market is divided into room-based cooling, rack-based cooling, and row-based cooling. Based on industry vertical, it is segmented into BFSI, manufacturing, IT & telecom, media & entertainment, retail, government & defense, healthcare, energy, and others. Region wise, it is analyzed across North America, Europe, Asia-Pacific, and LAMEA.
Key Benefits for Data Center Cooling Market:
Key Benefits for Data Center Cooling Market:
North America dominated the overall data center cooling market size in 2017 due to technological advancements and recent developments pertaining to the market. Moreover, companies in this region are focusing more on implementation of cost-effective and environment-friendly cooling solutions, which in turn fuels the market growth. However, Asia-Pacific is expected to witness the highest growth rate during the data center cooling market forecast period due to increase in the number of smartphones and rise in internet penetration in the region is expected to produce a huge chunk of data, which is required to be stored and processed in data centers.
The report focuses on the growth prospects, restraints, and data center cooling market trends. The study provides Porter’s five forces analysis of the data center cooling industry to understand the impact of various factors, such as bargaining power of suppliers, competitive intensity of competitors, threat of new entrants, threat of substitutes, and bargaining power of buyers on the data center cooling market.
Data center operators are reducing their price range for hiring enterprises to sustain in the competitive market. In the competitive scenario, data centers work 24/7 and generate immense heat, which can cause data loss or breakdown of data centers. Cooling solutions of data centers maintain the temperature inside data centers within permissible limits and help data centers to work uninterrupted. These advanced cooling systems are cost-effective as they are highly energy efficient and use less power. Additionally, these cooling systems prevent damage of equipment in data centers, which in turn reduce the maintenance cost of the data centers. Hence, the advanced cooling systems in data centers are driving the market growth, owing to the growing demand for cost-effective data centers.
The green initiative by government bodies is a key growth factor that drives the growth of the data center cooling market. Furthermore, traditional cooling systems emit polluted air into the environment which is hazardous, while advanced cooling systems leave less carbon footprint to the environment. Additionally, the advanced cooling systems use less water for cooling data centers as compared to the traditional cooling systems. Furthermore, data center cooling solutions are also adapting modular glasses and steel climate-controlled boxes and are run by geothermal power, which results in reduced carbon footprints to the environment. In addition, data center solutions have started using biofuels and renewable energy for its energy requirement, which makes these cooling solutions almost carbon neutral. Aforementioned green initiatives by data centers to reduce their carbon footprint in the environment are proliferating the growth of the data center cooling market.
|
Report Metric |
Details |
|
Report Name |
Data Centre Cooling Market |
|
Market size value in 20219 |
USD 10,541.8 Million |
|
Revenue forecast in 2027 |
USD 27,308.7 Million |
|
Growth Rate |
12.8 % |
|
Base year considered |
2019 |
|
Forecast Period |
2019-2027 |
|
By Component |
Solutions, Services |
|
By Data Centers |
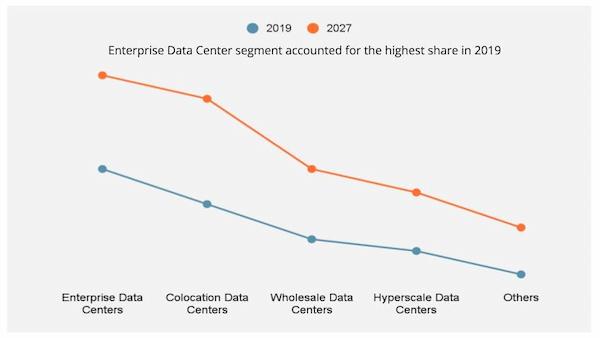
Enterprise Data Centers, Colocation Data Centers, Wholesale Data Centers, Hyperscale Data Centers |
|
Report Coverage |
Revenue & volume forecast, company share, competitive landscape, growth factors, and trends |
|
Segments Covered |
By Type, Component, and Region |
|
Geographic Regions Covered |
North America, Europe, Asia Pacific, Latin America, Middle East & Africa |
Ans. Due to the COVID-19 pandemic, The global data center cooling market size was valued at $10,541.8 million in 2019 and is projected to reach $27,308.7 million by 2027, growing at a CAGR of 12.8% from 2020 to 2027.
Ans. Some of the Major companies are Schneider Electric Se, Black Box Corporation, Hitachi, Ltd., Rittal Gmbh & Co. Kg, Fujitsu Ltd., And Stulz Gmbh.
Ans. Yes, the report includes a COVID-19 impact analysis. Also, it is further extended into every individual segment of the report.
$5370
$10665
HAVE A QUERY?
OUR CUSTOMER

SIMILAR REPORTS