0
U.S. (TOLL FREE)
+1 (315) 215-3225
Automative

0
U.S. (TOLL FREE)
+1 (315) 215-3225
IoT in Construction Market By Application (Asset monitoring, Predictive maintenance, Fleet management, Wearables, Others), By End User (Residential, Non-residential), By Component (Hardware, Software, Services, Connectivity): Global Opportunity Analysis and Industry Forecast, 2021-2031
Published Date: 2023-03-01
|
Report Code: ALLI-Auto-2V404
Home | Market Reports | Business & Industrial| Construction & Maintenance
IoT in Construction Market by Application Machine Control Site Monitoring Fleet Management Wearables and Others End User Residential and Non residential and Component Hardware Software Connectivity and Services Global Opportunity Analysis and Industry Forecast 2020 2027
BUY CHAPTERS

IoT in Construction Market By Application (Asset monitoring, Predictive maintenance, Fleet management, Wearables, Others), By End User (Residential, Non-residential), By Component (Hardware, Software, Services, Connectivity): Global Opportunity Analysis and Industry Forecast, 2021-2031

Code: ALLI-Auto-2V404
Report
2023-03-01
Pages:220
Allied Market Research
Buy Now with 15% Discount
DESCRIPTION
TABLE OF CONTENT
TABLES & FIGURES

IoT in Construction Market Size

According to a new report published by , titled, “IoT in Construction Market," The IoT in construction market was valued at $11.2 billion in 2021, and is estimated to reach $44.2 billion by 2031, growing at a CAGR of 14.6% from 2022 to 2031.

IoT in Construction Market

IoT in Construction Market

IoT in the construction industry primarily serves the purpose of utilizing electronically connected hardware and software to ensure the optimal use of resources, a well-thought-out technological strategy, and controlled construction costs. The Internet of Things (IoT) provides a platform for connecting to a central server that manages and tracks their operations in real-time for employees, inventories, and equipment. The construction industry currently employs a wide variety of devices for a variety of tasks.
Key factors driving the growth of the IOT In Construction market such as the use of IoT-based goods, can help cut costs, reduce resource waste, improve accuracy, and ultimately manage the building project effectively, which decreases reliance on personnel. For instance, surveying of 20,000 sq. meters site by conventional methods can require up to 3 days. On the contrary, the Komatsu Everyday Drone solution, offered by Japan based Komatsu Limited, can complete the same surveying job in 30 minutes using the 3D point cloud technology. This not only saves time required for completion of the activity, but also reduces the manpower required for the same project. With better skill development programs, and remote operation technologies provided by IoT in construction, the labor shortages in the construction industry are likely to drive the IoT in the construction industry. 
Most third-party businesses involved in business operations maintain the information technology systems and networks. Data processing and maintenance involving connected IoT devices is vulnerable to coordinated and targeted cyberattacks. The integrity and confidentiality of the data are compromised as a result. According to a study by Safetydetectives.com found that construction firms accounted for more than 13% of all industries targeted by hackers, placing them third on the list. Also, roughly one out of every six construction companies reported a ransomware attack in 2020–2021, according to the website Cybertalk.org. Such cyberattacks may harm consumers' reputations, which may result in fines, legal action from the government, litigation with third parties, and other consequences in addition to informational harm. Such flaws pose a serious risk to IoT implementation, particularly in the construction sector. Thus, rising security threats in connected devices restrain the growth of IoT in the construction market. 
Further, robotic machines involve the use of technologies such as artificial intelligence, cloud-based solution, IoT, and others which makes it easy to collect real time data on site without the assistance of special instruments. In addition, remote monitoring and controlling features of robots reduce fatalities, and help in obtaining more efficiencies. For instance, in September 2020 – Trimble has launched its new integration of BIMcollab and Microsoft 365 software with the Trimble Connect cloud-based collaboration platform. The integration of both platforms is aimed at connecting project stakeholders with data necessary to improve team efficiency and inform better decisions.  Thus, the increase in demand for robotics in construction is anticipated to boost the growth of IoT in the construction market. 
The global IoT in construction market is segmented on the basis of application, end user, component, and region. Based on application, the IoT in construction market is fragmented into asset monitoring, predictive maintenance, fleet management, wearables, and others. According to end user, the global IoT in construction market is categorized into residential and non-residential. By component, the market is classified into hardware, software, connectivity, and services. By region, it is analyzed across North America, Europe, Asia-Pacific, and LAMEA. 
The key players profiled in the study include Advanced Opto-Mechanical Systems and Technologies Inc., Autodesk, Inc., CalAmp Corporation, Hexagon AB, Hilti Corporation, Oracle Corporation, Topcon Corporation, Trimble, Inc., Triax Technologies, Inc., and Pillar Technologies, Inc.  The players in the market have been actively engaged in the adoption of various strategies to remain competitive and gain an advantage over the competitors in the market.
For instance, in March 2021, Trimble launched the Tekla Structures 2020, Tekla Tedds 2020, Tekla Structural Designer 2020, and Tekla PowerFab 2020 latest versions of Tekla software solutions for advanced Building Information Modelling (BIM). The new Tekla software versions are aimed at transforming the build, operate, and design lifecycle of building structures. In addition, in March 2020, Trimble launched Trimble Platform as a Service. The products offer contractors the ability to purchase civil construction hardware and software solutions. The solutions include Trimble Siteworks Positioning Systems, Trimble Earthworks Grade Control Platform, Trimble Correction Services, and other office software solutions.
Key Market Insights
By application, the predictive maintenance segment was the highest revenue contributor to the market and is estimated to reach $ 1,1508.6 million by 2031. Moreover, the wearables segment is estimated to be the fastest-growing segment with a CAGR of 16% during the forecast period.
By end user, the non-residential segment dominated the global market. However, the residential segment is expected to be the fastest growing segment with a CAGR of 15.4% during the forecast period.
By component, the hardware segment was the highest revenue contributor to the market in 2021, and services segment is expected to grow with a CAGR of 15.8% during the forecast period.
By region, Asia-Pacific held the largest revenue share in 2021, and is anticipated to grow at the highest CAGR of 15.5% during the forecast period.
 

Overview

The global IoT in construction market was valued at $11,156.4 million in 2021, and is projected to reach $44,215.7 million by 2031, registering a CAGR of 14.6% from 2022 to 2031.
The Internet of Things (IoT) has penetrated nearly all major industries as well as the human way of living. It has transformed the construction industry significantly with the integration of new technologies not only in construction activities such as plastering, bricklaying, and surveying, however also in construction site management, asset tracking, worker tracking, and risk management.
The inclusion of internet connected devices such as equipment monitoring sensors, smart wearables, building information modelling (BIM) software, RFID tagging & tracking, and others have reduced the wastage of resources. This decreased the number of accidents and fatalities occurring on construction sites. While, remote monitoring and data collection, has resulted in surged productivity and optimization of monetary resources. For instance, in October 2021, Kenzen partnered with McCarthy Building Companies, Inc. to boost their wearable heat safety technology. Kenzen's smart PPE devices monitor workers' heat status in hot situations, assisting in the prediction and prevention of heat stress and disease. By means of this, launched companies have learnt how to use this technology to reduce the risk of heat sickness and protect the overall health of construction workers.
Efficient safety management on construction sites is a major driving factor for the implementation of IoT technologies in the construction industry. Industry is one of the major employers of human resources. These workers are constantly prone to accidents on sites due to falling objects, fatigue, working on dangerous areas, and others. Use of IoT connected devices such as exoskeletons, sensors, and smartwatches assist in increasing the endurance of a worker, and track biological, physical, and environmental conditions such as temperature, blood pressure, heart rate, and location. Thus, efficient safety management on construction sites due to use of connected devices drives the growth of IoT in the construction market.
Moreover, augmented productivities and proper resource management boost the growth of IoT in construction market. Use of sensors and radio-frequency Identification (RFID) tags helps in obtaining real-time data regarding inventory, workers, and on-site activities, which reduce operational downtime and optimize resource planning using digital platforms such as building information modelling (BIM). For instance, in May 2021, Bosch launched its new AIoT platform that offers real-time information on energy usage at manufacturing facilities. The Phantom Edge platform provides fast and actionable insights through production efficiency, real-time warnings, and notifications. By giving managers quick, reliable, and precise data that serves as the foundation for goal setting, performance monitoring, analysis, and continuous improvement, it also automates data collection and measures correct downtimes.
Hence, the advantage of huge productivity on construction sites drives the growth of IoT in the construction industry. However, the rise in concerns regarding cyber security hinders the penetration of IoT technologies in the construction industry. Confidentiality and data integrity are an important part of construction projects and centralized data collection possesses’ risks of data theft and monetary damage to not only construction companies, however, also the customers. Hence, security threats in connected devices is likely to restrain the growth of IoT in construction market. On the contrary, better resource management and waste optimization are likely to create opportunities that propel the growth of the market. Data-driven decision-making at the planning stage of construction projects is likely to foster better management of resources; thereby, improving project efficiency.
The IoT in construction market is segmented on the basis of application, end user, component, and region. By application, the IoT in construction market is fragmented into asset monitoring, predictive maintenance, fleet management, wearables, and others. By end user, the IoT in construction market is categorized into residential and non-residential. By component, the market is classified into hardware, software, connectivity, and services. By region, the IoT in construction Market has been analyzed across North America (the U.S., Canada, and Mexico), Europe (Germany, UK, France, and rest of Europe), Asia Pacific (China, Japan, South Korea, and rest of Asia-Pacific), and LAMEA (Latin America, Middle East, and Africa).
Key companies profiled in the report include Advanced Opto-Mechanical Systems and Technologies Inc., Autodesk, Inc., CalAmp Corporation, Hexagon AB, Hilti Corporation, Oracle Corporation, Pillar Technologies, Inc Topcon Corporation, Trimble, Inc., and Triax Technologies, Inc. Major companies in the market have adopted product launch, acquisition, and partnership as their key developmental strategies to offer better products and services to customers in the IoT in construction market.

Key Benefits For Stakeholders

●This report provides a quantitative analysis of the market segments, current trends, estimations, and dynamics of the iot in construction market analysis from 2021 to 2031 to identify the prevailing iot in construction market opportunities.
●The market research is offered along with information related to key drivers, restraints, and opportunities.
●Porter's five forces analysis highlights the potency of buyers and suppliers to enable stakeholders make profit-oriented business decisions and strengthen their supplier-buyer network.
●In-depth analysis of the iot in construction market segmentation assists to determine the prevailing market opportunities.
●Major countries in each region are mapped according to their revenue contribution to the global market.
●Market player positioning facilitates benchmarking and provides a clear understanding of the present position of the market players.
●The report includes the analysis of the regional as well as global iot in construction market trends, key players, market segments, application areas, and market growth strategies.
Key Market Segments
○ Trimble, Inc

Scope of IoT in Construction Market Report

Report Metric Details
Report Name IoT in Construction Market
Accounted market size in 2021 $ 11.2 billion
Forecasted market size in 2031 $ 44.2 billion
CAGR 14.6%
Base Year 2021
Forecasted years 2024 - 2031
By Application ● Asset monitoring
● Predictive maintenance
● Fleet management
● Wearables
● Others
By End User ● Residential
● Non-residential
By Component ● Hardware
● Software
● Services
● Connectivity
By Region
  • North America (United States, Canada)
  • Europe (Germany, France, UK, Italy, Russia) Rest of Europe
  • Nordic Countries
  • Asia-Pacific (China, Japan, South Korea)
  • Southeast Asia (India, Australia)
  • Rest of Asia
  • Latin America (Mexico, Brazil)
  • Rest of Latin America
  • Middle East & Africa (Turkey, Saudi Arabia, UAE, Rest of MEA)
Forecast units USD million in value
Report coverage Revenue and volume forecast, company share, competitive landscape, growth factors and trends

FAQ for this report

How fast is IoT in Construction Market growing?

Ans: The IoT in Construction Market witnessing a CAGR of 14.6% during the forecast period 2024-2031.

What is the IoT in Construction Market size in 2031?

Ans: The IoT in Construction Market size in 2031 will be $ 44.2 billion.

What are the Application segmentation covered in the IoT in Construction Market report?

Ans: The Applications covered in the IoT in Construction Market report are ● Asset monitoring, ● Predictive maintenance, ● Fleet management, ● Wearables, ● Others

What are the End User segmentation covered in the IoT in Construction Market report?

Ans: The End users covered in the IoT in Construction Market report are ● Residential, ● Non-residential

CHAPTER 1: INTRODUCTION
1.1. Report description
1.2. Key market segments
1.3. Key benefits to the stakeholders
1.4. Research Methodology
1.4.1. Primary research
1.4.2. Secondary research
1.4.3. Analyst tools and models
CHAPTER 2: EXECUTIVE SUMMARY
2.1. CXO Perspective
CHAPTER 3: MARKET OVERVIEW
3.1. Market definition and scope
3.2. Key findings
3.2.1. Top impacting factors
3.2.2. Top investment pockets
3.3. Porter’s five forces analysis
3.3.1. Bargaining power of suppliers
3.3.2. Bargaining power of buyers
3.3.3. Threat of substitutes
3.3.4. Threat of new entrants
3.3.5. Intensity of rivalry
3.4. Market dynamics
3.4.1. Drivers
3.4.1.1. Labor shortages on construction sites
3.4.1.2. Efficient safety management on construction sites.
3.4.1.3. Increased efficiency and productivity on construction sites.
3.4.2. Restraints
3.4.2.1. Increased security threats in connected devices
3.4.3. Opportunities
3.4.3.1. Robotics in construction.
3.4.3.2. Resource and waste optimization
3.5. COVID-19 Impact Analysis on the market
CHAPTER 4: IOT IN CONSTRUCTION MARKET, BY APPLICATION
4.1. Overview
4.1.1. Market size and forecast
4.2. Asset monitoring
4.2.1. Key market trends, growth factors and opportunities
4.2.2. Market size and forecast, by region
4.2.3. Market share analysis by country
4.3. Predictive maintenance
4.3.1. Key market trends, growth factors and opportunities
4.3.2. Market size and forecast, by region
4.3.3. Market share analysis by country
4.4. Fleet management
4.4.1. Key market trends, growth factors and opportunities
4.4.2. Market size and forecast, by region
4.4.3. Market share analysis by country
4.5. Wearables
4.5.1. Key market trends, growth factors and opportunities
4.5.2. Market size and forecast, by region
4.5.3. Market share analysis by country
4.6. Others
4.6.1. Key market trends, growth factors and opportunities
4.6.2. Market size and forecast, by region
4.6.3. Market share analysis by country
CHAPTER 5: IOT IN CONSTRUCTION MARKET, BY END USER
5.1. Overview
5.1.1. Market size and forecast
5.2. Residential
5.2.1. Key market trends, growth factors and opportunities
5.2.2. Market size and forecast, by region
5.2.3. Market share analysis by country
5.3. Non-residential
5.3.1. Key market trends, growth factors and opportunities
5.3.2. Market size and forecast, by region
5.3.3. Market share analysis by country
CHAPTER 6: IOT IN CONSTRUCTION MARKET, BY COMPONENT
6.1. Overview
6.1.1. Market size and forecast
6.2. Hardware
6.2.1. Key market trends, growth factors and opportunities
6.2.2. Market size and forecast, by region
6.2.3. Market share analysis by country
6.3. Software
6.3.1. Key market trends, growth factors and opportunities
6.3.2. Market size and forecast, by region
6.3.3. Market share analysis by country
6.4. Services
6.4.1. Key market trends, growth factors and opportunities
6.4.2. Market size and forecast, by region
6.4.3. Market share analysis by country
6.5. Connectivity
6.5.1. Key market trends, growth factors and opportunities
6.5.2. Market size and forecast, by region
6.5.3. Market share analysis by country
CHAPTER 7: IOT IN CONSTRUCTION MARKET, BY REGION
7.1. Overview
7.1.1. Market size and forecast By Region
7.2. North America
7.2.1. Key trends and opportunities
7.2.2. Market size and forecast, by Application
7.2.3. Market size and forecast, by End User
7.2.4. Market size and forecast, by Component
7.2.5. Market size and forecast, by country
7.2.5.1. U.S.
7.2.5.1.1. Key market trends, growth factors and opportunities
7.2.5.1.2. Market size and forecast, by Application
7.2.5.1.3. Market size and forecast, by End User
7.2.5.1.4. Market size and forecast, by Component
7.2.5.2. Canada
7.2.5.2.1. Key market trends, growth factors and opportunities
7.2.5.2.2. Market size and forecast, by Application
7.2.5.2.3. Market size and forecast, by End User
7.2.5.2.4. Market size and forecast, by Component
7.2.5.3. Mexico
7.2.5.3.1. Key market trends, growth factors and opportunities
7.2.5.3.2. Market size and forecast, by Application
7.2.5.3.3. Market size and forecast, by End User
7.2.5.3.4. Market size and forecast, by Component
7.3. Europe
7.3.1. Key trends and opportunities
7.3.2. Market size and forecast, by Application
7.3.3. Market size and forecast, by End User
7.3.4. Market size and forecast, by Component
7.3.5. Market size and forecast, by country
7.3.5.1. Germany
7.3.5.1.1. Key market trends, growth factors and opportunities
7.3.5.1.2. Market size and forecast, by Application
7.3.5.1.3. Market size and forecast, by End User
7.3.5.1.4. Market size and forecast, by Component
7.3.5.2. UK
7.3.5.2.1. Key market trends, growth factors and opportunities
7.3.5.2.2. Market size and forecast, by Application
7.3.5.2.3. Market size and forecast, by End User
7.3.5.2.4. Market size and forecast, by Component
7.3.5.3. France
7.3.5.3.1. Key market trends, growth factors and opportunities
7.3.5.3.2. Market size and forecast, by Application
7.3.5.3.3. Market size and forecast, by End User
7.3.5.3.4. Market size and forecast, by Component
7.3.5.4. Rest of Europe
7.3.5.4.1. Key market trends, growth factors and opportunities
7.3.5.4.2. Market size and forecast, by Application
7.3.5.4.3. Market size and forecast, by End User
7.3.5.4.4. Market size and forecast, by Component
7.4. Asia-Pacific
7.4.1. Key trends and opportunities
7.4.2. Market size and forecast, by Application
7.4.3. Market size and forecast, by End User
7.4.4. Market size and forecast, by Component
7.4.5. Market size and forecast, by country
7.4.5.1. China
7.4.5.1.1. Key market trends, growth factors and opportunities
7.4.5.1.2. Market size and forecast, by Application
7.4.5.1.3. Market size and forecast, by End User
7.4.5.1.4. Market size and forecast, by Component
7.4.5.2. Japan
7.4.5.2.1. Key market trends, growth factors and opportunities
7.4.5.2.2. Market size and forecast, by Application
7.4.5.2.3. Market size and forecast, by End User
7.4.5.2.4. Market size and forecast, by Component
7.4.5.3. South Korea
7.4.5.3.1. Key market trends, growth factors and opportunities
7.4.5.3.2. Market size and forecast, by Application
7.4.5.3.3. Market size and forecast, by End User
7.4.5.3.4. Market size and forecast, by Component
7.4.5.4. Rest of Asia-Pacific
7.4.5.4.1. Key market trends, growth factors and opportunities
7.4.5.4.2. Market size and forecast, by Application
7.4.5.4.3. Market size and forecast, by End User
7.4.5.4.4. Market size and forecast, by Component
7.5. LAMEA
7.5.1. Key trends and opportunities
7.5.2. Market size and forecast, by Application
7.5.3. Market size and forecast, by End User
7.5.4. Market size and forecast, by Component
7.5.5. Market size and forecast, by country
7.5.5.1. Latin America
7.5.5.1.1. Key market trends, growth factors and opportunities
7.5.5.1.2. Market size and forecast, by Application
7.5.5.1.3. Market size and forecast, by End User
7.5.5.1.4. Market size and forecast, by Component
7.5.5.2. Middle East
7.5.5.2.1. Key market trends, growth factors and opportunities
7.5.5.2.2. Market size and forecast, by Application
7.5.5.2.3. Market size and forecast, by End User
7.5.5.2.4. Market size and forecast, by Component
7.5.5.3. Africa
7.5.5.3.1. Key market trends, growth factors and opportunities
7.5.5.3.2. Market size and forecast, by Application
7.5.5.3.3. Market size and forecast, by End User
7.5.5.3.4. Market size and forecast, by Component
CHAPTER 8: COMPETITIVE LANDSCAPE
8.1. Introduction
8.2. Top winning strategies
8.3. Product Mapping of Top 10 Player
8.4. Competitive Dashboard
8.5. Competitive Heatmap
8.6. Top player positioning, 2021
CHAPTER 9: COMPANY PROFILES
9.1. Advanced Opto-Mechanical Systems and Technologies Inc.
9.1.1. Company overview
9.1.2. Key Executives
9.1.3. Company snapshot
9.1.4. Operating business segments
9.1.5. Product portfolio
9.1.6. Key strategic moves and developments
9.2. Autodesk, Inc.
9.2.1. Company overview
9.2.2. Key Executives
9.2.3. Company snapshot
9.2.4. Operating business segments
9.2.5. Product portfolio
9.2.6. Business performance
9.2.7. Key strategic moves and developments
9.3. CalAmp Corporation
9.3.1. Company overview
9.3.2. Key Executives
9.3.3. Company snapshot
9.3.4. Operating business segments
9.3.5. Product portfolio
9.3.6. Business performance
9.3.7. Key strategic moves and developments
9.4. Hexagon AB
9.4.1. Company overview
9.4.2. Key Executives
9.4.3. Company snapshot
9.4.4. Operating business segments
9.4.5. Product portfolio
9.4.6. Business performance
9.4.7. Key strategic moves and developments
9.5. Hilti Corporation
9.5.1. Company overview
9.5.2. Key Executives
9.5.3. Company snapshot
9.5.4. Operating business segments
9.5.5. Product portfolio
9.5.6. Business performance
9.5.7. Key strategic moves and developments
9.6. Oracle Corporation
9.6.1. Company overview
9.6.2. Key Executives
9.6.3. Company snapshot
9.6.4. Operating business segments
9.6.5. Product portfolio
9.6.6. Business performance
9.6.7. Key strategic moves and developments
9.7. Pillar Technologies, Inc.
9.7.1. Company overview
9.7.2. Key Executives
9.7.3. Company snapshot
9.7.4. Operating business segments
9.7.5. Product portfolio
9.8. Topcon Corporation
9.8.1. Company overview
9.8.2. Key Executives
9.8.3. Company snapshot
9.8.4. Operating business segments
9.8.5. Product portfolio
9.8.6. Business performance
9.8.7. Key strategic moves and developments
9.9. Triax Technologies, Inc.
9.9.1. Company overview
9.9.2. Key Executives
9.9.3. Company snapshot
9.9.4. Operating business segments
9.9.5. Product portfolio
9.10. Trimble, Inc.
9.10.1. Company overview
9.10.2. Key Executives
9.10.3. Company snapshot
9.10.4. Operating business segments
9.10.5. Product portfolio
9.10.6. Business performance
9.10.7. Key strategic moves and development
LIST OF TABLES
TABLE 01. GLOBAL IOT IN CONSTRUCTION MARKET, BY APPLICATION, 2021-2031 ($MILLION)
TABLE 02. IOT IN CONSTRUCTION MARKET FOR ASSET MONITORING, BY REGION, 2021-2031 ($MILLION)
TABLE 03. IOT IN CONSTRUCTION MARKET FOR PREDICTIVE MAINTENANCE, BY REGION, 2021-2031 ($MILLION)
TABLE 04. IOT IN CONSTRUCTION MARKET FOR FLEET MANAGEMENT, BY REGION, 2021-2031 ($MILLION)
TABLE 05. IOT IN CONSTRUCTION MARKET FOR WEARABLES, BY REGION, 2021-2031 ($MILLION)
TABLE 06. IOT IN CONSTRUCTION MARKET FOR OTHERS, BY REGION, 2021-2031 ($MILLION)
TABLE 07. GLOBAL IOT IN CONSTRUCTION MARKET, BY END USER, 2021-2031 ($MILLION)
TABLE 08. IOT IN CONSTRUCTION MARKET FOR RESIDENTIAL, BY REGION, 2021-2031 ($MILLION)
TABLE 09. IOT IN CONSTRUCTION MARKET FOR NON-RESIDENTIAL, BY REGION, 2021-2031 ($MILLION)
TABLE 10. GLOBAL IOT IN CONSTRUCTION MARKET, BY COMPONENT, 2021-2031 ($MILLION)
TABLE 11. IOT IN CONSTRUCTION MARKET FOR HARDWARE, BY REGION, 2021-2031 ($MILLION)
TABLE 12. IOT IN CONSTRUCTION MARKET FOR SOFTWARE, BY REGION, 2021-2031 ($MILLION)
TABLE 13. IOT IN CONSTRUCTION MARKET FOR SERVICES, BY REGION, 2021-2031 ($MILLION)
TABLE 14. IOT IN CONSTRUCTION MARKET FOR CONNECTIVITY, BY REGION, 2021-2031 ($MILLION)
TABLE 15. IOT IN CONSTRUCTION MARKET, BY REGION, 2021-2031 ($MILLION)
TABLE 16. NORTH AMERICA IOT IN CONSTRUCTION MARKET, BY APPLICATION, 2021-2031 ($MILLION)
TABLE 17. NORTH AMERICA IOT IN CONSTRUCTION MARKET, BY END USER, 2021-2031 ($MILLION)
TABLE 18. NORTH AMERICA IOT IN CONSTRUCTION MARKET, BY COMPONENT, 2021-2031 ($MILLION)
TABLE 19. NORTH AMERICA IOT IN CONSTRUCTION MARKET, BY COUNTRY, 2021-2031 ($MILLION)
TABLE 20. U.S. IOT IN CONSTRUCTION MARKET, BY APPLICATION, 2021-2031 ($MILLION)
TABLE 21. U.S. IOT IN CONSTRUCTION MARKET, BY END USER, 2021-2031 ($MILLION)
TABLE 22. U.S. IOT IN CONSTRUCTION MARKET, BY COMPONENT, 2021-2031 ($MILLION)
TABLE 23. CANADA IOT IN CONSTRUCTION MARKET, BY APPLICATION, 2021-2031 ($MILLION)
TABLE 24. CANADA IOT IN CONSTRUCTION MARKET, BY END USER, 2021-2031 ($MILLION)
TABLE 25. CANADA IOT IN CONSTRUCTION MARKET, BY COMPONENT, 2021-2031 ($MILLION)
TABLE 26. MEXICO IOT IN CONSTRUCTION MARKET, BY APPLICATION, 2021-2031 ($MILLION)
TABLE 27. MEXICO IOT IN CONSTRUCTION MARKET, BY END USER, 2021-2031 ($MILLION)
TABLE 28. MEXICO IOT IN CONSTRUCTION MARKET, BY COMPONENT, 2021-2031 ($MILLION)
TABLE 29. EUROPE IOT IN CONSTRUCTION MARKET, BY APPLICATION, 2021-2031 ($MILLION)
TABLE 30. EUROPE IOT IN CONSTRUCTION MARKET, BY END USER, 2021-2031 ($MILLION)
TABLE 31. EUROPE IOT IN CONSTRUCTION MARKET, BY COMPONENT, 2021-2031 ($MILLION)
TABLE 32. EUROPE IOT IN CONSTRUCTION MARKET, BY COUNTRY, 2021-2031 ($MILLION)
TABLE 33. GERMANY IOT IN CONSTRUCTION MARKET, BY APPLICATION, 2021-2031 ($MILLION)
TABLE 34. GERMANY IOT IN CONSTRUCTION MARKET, BY END USER, 2021-2031 ($MILLION)
TABLE 35. GERMANY IOT IN CONSTRUCTION MARKET, BY COMPONENT, 2021-2031 ($MILLION)
TABLE 36. UK IOT IN CONSTRUCTION MARKET, BY APPLICATION, 2021-2031 ($MILLION)
TABLE 37. UK IOT IN CONSTRUCTION MARKET, BY END USER, 2021-2031 ($MILLION)
TABLE 38. UK IOT IN CONSTRUCTION MARKET, BY COMPONENT, 2021-2031 ($MILLION)
TABLE 39. FRANCE IOT IN CONSTRUCTION MARKET, BY APPLICATION, 2021-2031 ($MILLION)
TABLE 40. FRANCE IOT IN CONSTRUCTION MARKET, BY END USER, 2021-2031 ($MILLION)
TABLE 41. FRANCE IOT IN CONSTRUCTION MARKET, BY COMPONENT, 2021-2031 ($MILLION)
TABLE 42. REST OF EUROPE IOT IN CONSTRUCTION MARKET, BY APPLICATION, 2021-2031 ($MILLION)
TABLE 43. REST OF EUROPE IOT IN CONSTRUCTION MARKET, BY END USER, 2021-2031 ($MILLION)
TABLE 44. REST OF EUROPE IOT IN CONSTRUCTION MARKET, BY COMPONENT, 2021-2031 ($MILLION)
TABLE 45. ASIA-PACIFIC IOT IN CONSTRUCTION MARKET, BY APPLICATION, 2021-2031 ($MILLION)
TABLE 46. ASIA-PACIFIC IOT IN CONSTRUCTION MARKET, BY END USER, 2021-2031 ($MILLION)
TABLE 47. ASIA-PACIFIC IOT IN CONSTRUCTION MARKET, BY COMPONENT, 2021-2031 ($MILLION)
TABLE 48. ASIA-PACIFIC IOT IN CONSTRUCTION MARKET, BY COUNTRY, 2021-2031 ($MILLION)
TABLE 49. CHINA IOT IN CONSTRUCTION MARKET, BY APPLICATION, 2021-2031 ($MILLION)
TABLE 50. CHINA IOT IN CONSTRUCTION MARKET, BY END USER, 2021-2031 ($MILLION)
TABLE 51. CHINA IOT IN CONSTRUCTION MARKET, BY COMPONENT, 2021-2031 ($MILLION)
TABLE 52. JAPAN IOT IN CONSTRUCTION MARKET, BY APPLICATION, 2021-2031 ($MILLION)
TABLE 53. JAPAN IOT IN CONSTRUCTION MARKET, BY END USER, 2021-2031 ($MILLION)
TABLE 54. JAPAN IOT IN CONSTRUCTION MARKET, BY COMPONENT, 2021-2031 ($MILLION)
TABLE 55. SOUTH KOREA IOT IN CONSTRUCTION MARKET, BY APPLICATION, 2021-2031 ($MILLION)
TABLE 56. SOUTH KOREA IOT IN CONSTRUCTION MARKET, BY END USER, 2021-2031 ($MILLION)
TABLE 57. SOUTH KOREA IOT IN CONSTRUCTION MARKET, BY COMPONENT, 2021-2031 ($MILLION)
TABLE 58. REST OF ASIA-PACIFIC IOT IN CONSTRUCTION MARKET, BY APPLICATION, 2021-2031 ($MILLION)
TABLE 59. REST OF ASIA-PACIFIC IOT IN CONSTRUCTION MARKET, BY END USER, 2021-2031 ($MILLION)
TABLE 60. REST OF ASIA-PACIFIC IOT IN CONSTRUCTION MARKET, BY COMPONENT, 2021-2031 ($MILLION)
TABLE 61. LAMEA IOT IN CONSTRUCTION MARKET, BY APPLICATION, 2021-2031 ($MILLION)
TABLE 62. LAMEA IOT IN CONSTRUCTION MARKET, BY END USER, 2021-2031 ($MILLION)
TABLE 63. LAMEA IOT IN CONSTRUCTION MARKET, BY COMPONENT, 2021-2031 ($MILLION)
TABLE 64. LAMEA IOT IN CONSTRUCTION MARKET, BY COUNTRY, 2021-2031 ($MILLION)
TABLE 65. LATIN AMERICA IOT IN CONSTRUCTION MARKET, BY APPLICATION, 2021-2031 ($MILLION)
TABLE 66. LATIN AMERICA IOT IN CONSTRUCTION MARKET, BY END USER, 2021-2031 ($MILLION)
TABLE 67. LATIN AMERICA IOT IN CONSTRUCTION MARKET, BY COMPONENT, 2021-2031 ($MILLION)
TABLE 68. MIDDLE EAST IOT IN CONSTRUCTION MARKET, BY APPLICATION, 2021-2031 ($MILLION)
TABLE 69. MIDDLE EAST IOT IN CONSTRUCTION MARKET, BY END USER, 2021-2031 ($MILLION)
TABLE 70. MIDDLE EAST IOT IN CONSTRUCTION MARKET, BY COMPONENT, 2021-2031 ($MILLION)
TABLE 71. AFRICA IOT IN CONSTRUCTION MARKET, BY APPLICATION, 2021-2031 ($MILLION)
TABLE 72. AFRICA IOT IN CONSTRUCTION MARKET, BY END USER, 2021-2031 ($MILLION)
TABLE 73. AFRICA IOT IN CONSTRUCTION MARKET, BY COMPONENT, 2021-2031 ($MILLION)
TABLE 74. ADVANCED OPTO-MECHANICAL SYSTEMS AND TECHNOLOGIES INC.: KEY EXECUTIVES
TABLE 75. ADVANCED OPTO-MECHANICAL SYSTEMS AND TECHNOLOGIES INC.: COMPANY SNAPSHOT
TABLE 76. ADVANCED OPTO-MECHANICAL SYSTEMS AND TECHNOLOGIES INC.: PRODUCT SEGMENTS
TABLE 77. ADVANCED OPTO-MECHANICAL SYSTEMS AND TECHNOLOGIES INC.: PRODUCT PORTFOLIO
TABLE 78. ADVANCED OPTO-MECHANICAL SYSTEMS AND TECHNOLOGIES INC.: KEY STRATERGIES
TABLE 79. AUTODESK, INC.: KEY EXECUTIVES
TABLE 80. AUTODESK, INC.: COMPANY SNAPSHOT
TABLE 81. AUTODESK, INC.: PRODUCT SEGMENTS
TABLE 82. AUTODESK, INC.: PRODUCT PORTFOLIO
TABLE 83. AUTODESK, INC.: KEY STRATERGIES
TABLE 84. CALAMP CORPORATION: KEY EXECUTIVES
TABLE 85. CALAMP CORPORATION: COMPANY SNAPSHOT
TABLE 86. CALAMP CORPORATION: PRODUCT SEGMENTS
TABLE 87. CALAMP CORPORATION: PRODUCT PORTFOLIO
TABLE 88. CALAMP CORPORATION: KEY STRATERGIES
TABLE 89. HEXAGON AB: KEY EXECUTIVES
TABLE 90. HEXAGON AB: COMPANY SNAPSHOT
TABLE 91. HEXAGON AB: PRODUCT SEGMENTS
TABLE 92. HEXAGON AB: PRODUCT PORTFOLIO
TABLE 93. HEXAGON AB: KEY STRATERGIES
TABLE 94. HILTI CORPORATION: KEY EXECUTIVES
TABLE 95. HILTI CORPORATION: COMPANY SNAPSHOT
TABLE 96. HILTI CORPORATION: PRODUCT SEGMENTS
TABLE 97. HILTI CORPORATION: PRODUCT PORTFOLIO
TABLE 98. HILTI CORPORATION: KEY STRATERGIES
TABLE 99. ORACLE CORPORATION: KEY EXECUTIVES
TABLE 100. ORACLE CORPORATION: COMPANY SNAPSHOT
TABLE 101. ORACLE CORPORATION: PRODUCT SEGMENTS
TABLE 102. ORACLE CORPORATION: PRODUCT PORTFOLIO
TABLE 103. ORACLE CORPORATION: KEY STRATERGIES
TABLE 104. PILLAR TECHNOLOGIES, INC.: KEY EXECUTIVES
TABLE 105. PILLAR TECHNOLOGIES, INC.: COMPANY SNAPSHOT
TABLE 106. PILLAR TECHNOLOGIES, INC.: PRODUCT SEGMENTS
TABLE 107. PILLAR TECHNOLOGIES, INC.: PRODUCT PORTFOLIO
TABLE 108. TOPCON CORPORATION: KEY EXECUTIVES
TABLE 109. TOPCON CORPORATION: COMPANY SNAPSHOT
TABLE 110. TOPCON CORPORATION: PRODUCT SEGMENTS
TABLE 111. TOPCON CORPORATION: PRODUCT PORTFOLIO
TABLE 112. TOPCON CORPORATION: KEY STRATERGIES
TABLE 113. TRIAX TECHNOLOGIES, INC.: KEY EXECUTIVES
TABLE 114. TRIAX TECHNOLOGIES, INC.: COMPANY SNAPSHOT
TABLE 115. TRIAX TECHNOLOGIES, INC.: PRODUCT SEGMENTS
TABLE 116. TRIAX TECHNOLOGIES, INC.: PRODUCT PORTFOLIO
TABLE 117. TRIMBLE, INC.: KEY EXECUTIVES
TABLE 118. TRIMBLE, INC.: COMPANY SNAPSHOT
TABLE 119. TRIMBLE, INC.: PRODUCT SEGMENTS
TABLE 120. TRIMBLE, INC.: PRODUCT PORTFOLIO
TABLE 121. TRIMBLE, INC.: KEY STRATERGIES LIST OF FIGURES
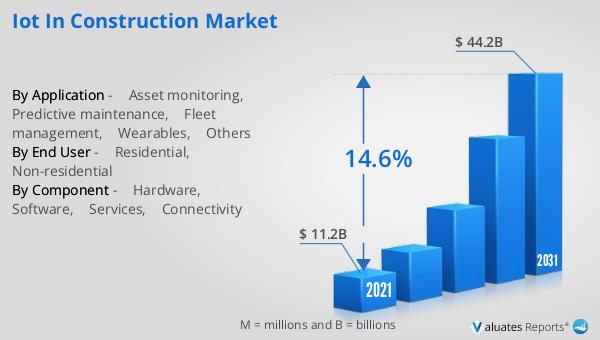
FIGURE 01. IOT IN CONSTRUCTION MARKET, 2021-2031
FIGURE 02. SEGMENTATION OF IOT IN CONSTRUCTION MARKET, 2021-2031
FIGURE 03. TOP INVESTMENT POCKETS IN IOT IN CONSTRUCTION MARKET (2022-2031)
FIGURE 04. LOW BARGAINING POWER OF SUPPLIERS
FIGURE 05. LOW BARGAINING POWER OF BUYERS
FIGURE 06. LOW THREAT OF SUBSTITUTES
FIGURE 07. LOW THREAT OF NEW ENTRANTS
FIGURE 08. LOW INTENSITY OF RIVALRY
FIGURE 09. DRIVERS, RESTRAINTS AND OPPORTUNITIES: GLOBALIOT IN CONSTRUCTION MARKET
FIGURE 10. IOT IN CONSTRUCTION MARKET, BY APPLICATION, 2021(%)
FIGURE 11. COMPARATIVE SHARE ANALYSIS OF IOT IN CONSTRUCTION MARKET FOR ASSET MONITORING, BY COUNTRY 2021 AND 2031(%)
FIGURE 12. COMPARATIVE SHARE ANALYSIS OF IOT IN CONSTRUCTION MARKET FOR PREDICTIVE MAINTENANCE, BY COUNTRY 2021 AND 2031(%)
FIGURE 13. COMPARATIVE SHARE ANALYSIS OF IOT IN CONSTRUCTION MARKET FOR FLEET MANAGEMENT, BY COUNTRY 2021 AND 2031(%)
FIGURE 14. COMPARATIVE SHARE ANALYSIS OF IOT IN CONSTRUCTION MARKET FOR WEARABLES, BY COUNTRY 2021 AND 2031(%)
FIGURE 15. COMPARATIVE SHARE ANALYSIS OF IOT IN CONSTRUCTION MARKET FOR OTHERS, BY COUNTRY 2021 AND 2031(%)
FIGURE 16. IOT IN CONSTRUCTION MARKET, BY END USER, 2021(%)
FIGURE 17. COMPARATIVE SHARE ANALYSIS OF IOT IN CONSTRUCTION MARKET FOR RESIDENTIAL, BY COUNTRY 2021 AND 2031(%)
FIGURE 18. COMPARATIVE SHARE ANALYSIS OF IOT IN CONSTRUCTION MARKET FOR NON-RESIDENTIAL, BY COUNTRY 2021 AND 2031(%)
FIGURE 19. IOT IN CONSTRUCTION MARKET, BY COMPONENT, 2021(%)
FIGURE 20. COMPARATIVE SHARE ANALYSIS OF IOT IN CONSTRUCTION MARKET FOR HARDWARE, BY COUNTRY 2021 AND 2031(%)
FIGURE 21. COMPARATIVE SHARE ANALYSIS OF IOT IN CONSTRUCTION MARKET FOR SOFTWARE, BY COUNTRY 2021 AND 2031(%)
FIGURE 22. COMPARATIVE SHARE ANALYSIS OF IOT IN CONSTRUCTION MARKET FOR SERVICES, BY COUNTRY 2021 AND 2031(%)
FIGURE 23. COMPARATIVE SHARE ANALYSIS OF IOT IN CONSTRUCTION MARKET FOR CONNECTIVITY, BY COUNTRY 2021 AND 2031(%)
FIGURE 24. IOT IN CONSTRUCTION MARKET BY REGION, 2021
FIGURE 25. U.S. IOT IN CONSTRUCTION MARKET, 2021-2031 ($MILLION)
FIGURE 26. CANADA IOT IN CONSTRUCTION MARKET, 2021-2031 ($MILLION)
FIGURE 27. MEXICO IOT IN CONSTRUCTION MARKET, 2021-2031 ($MILLION)
FIGURE 28. GERMANY IOT IN CONSTRUCTION MARKET, 2021-2031 ($MILLION)
FIGURE 29. UK IOT IN CONSTRUCTION MARKET, 2021-2031 ($MILLION)
FIGURE 30. FRANCE IOT IN CONSTRUCTION MARKET, 2021-2031 ($MILLION)
FIGURE 31. REST OF EUROPE IOT IN CONSTRUCTION MARKET, 2021-2031 ($MILLION)
FIGURE 32. CHINA IOT IN CONSTRUCTION MARKET, 2021-2031 ($MILLION)
FIGURE 33. JAPAN IOT IN CONSTRUCTION MARKET, 2021-2031 ($MILLION)
FIGURE 34. SOUTH KOREA IOT IN CONSTRUCTION MARKET, 2021-2031 ($MILLION)
FIGURE 35. REST OF ASIA-PACIFIC IOT IN CONSTRUCTION MARKET, 2021-2031 ($MILLION)
FIGURE 36. LATIN AMERICA IOT IN CONSTRUCTION MARKET, 2021-2031 ($MILLION)
FIGURE 37. MIDDLE EAST IOT IN CONSTRUCTION MARKET, 2021-2031 ($MILLION)
FIGURE 38. AFRICA IOT IN CONSTRUCTION MARKET, 2021-2031 ($MILLION)
FIGURE 39. TOP WINNING STRATEGIES, BY YEAR
FIGURE 40. TOP WINNING STRATEGIES, BY DEVELOPMENT
FIGURE 41. TOP WINNING STRATEGIES, BY COMPANY
FIGURE 42. PRODUCT MAPPING OF TOP 10 PLAYERS
FIGURE 43. COMPETITIVE DASHBOARD
FIGURE 44. COMPETITIVE HEATMAP: IOT IN CONSTRUCTION MARKET
FIGURE 45. TOP PLAYER POSITIONING, 2021
FIGURE 46. AUTODESK, INC.: NET REVENUE, 2020-2022 ($MILLION)
FIGURE 47. AUTODESK, INC.: REVENUE SHARE BY SEGMENT, 2022 (%)
FIGURE 48. AUTODESK, INC.: REVENUE SHARE BY REGION, 2022 (%)
FIGURE 49. CALAMP CORPORATION: NET REVENUE, 2020-2022 ($MILLION)
FIGURE 50. CALAMP CORPORATION: RESEARCH & DEVELOPMENT EXPENDITURE, 2020-2022 ($MILLION)
FIGURE 51. CALAMP CORPORATION: REVENUE SHARE BY SEGMENT, 2022 (%)
FIGURE 52. CALAMP CORPORATION: REVENUE SHARE BY REGION, 2022 (%)
FIGURE 53. HEXAGON AB: NET REVENUE, 2020-2022 ($MILLION)
FIGURE 54. HEXAGON AB: REVENUE SHARE BY REGION, 2022 (%)
FIGURE 55. HEXAGON AB: REVENUE SHARE BY SEGMENT, 2022 (%)
FIGURE 56. HILTI CORPORATION: NET SALES, 2020-2022 ($MILLION)
FIGURE 57. HILTI CORPORATION: RESEARCH & DEVELOPMENT EXPENDITURE, 2020-2022 ($MILLION)
FIGURE 58. HILTI CORPORATION: REVENUE SHARE BY REGION, 2022 (%)
FIGURE 59. HILTI CORPORATION: REVENUE SHARE BY SEGMENT, 2022 (%)
FIGURE 60. ORACLE CORPORATION: NET REVENUE, 2020-2022 ($MILLION)
FIGURE 61. ORACLE CORPORATION: RESEARCH & DEVELOPMENT EXPENDITURE, 2020-2022 ($MILLION)
FIGURE 62. ORACLE CORPORATION: REVENUE SHARE BY SEGMENT, 2022 (%)
FIGURE 63. ORACLE CORPORATION: REVENUE SHARE BY REGION, 2022 (%)
FIGURE 64. TOPCON CORPORATION: NET SALES, 2019-2021 ($MILLION)
FIGURE 65. TOPCON CORPORATION: REVENUE SHARE BY SEGMENT, 2021 (%)
FIGURE 66. TOPCON CORPORATION: REVENUE SHARE BY REGION, 2021 (%)
FIGURE 67. TRIMBLE, INC.: NET REVENUE, 2019-2021 ($MILLION)
FIGURE 68. TRIMBLE, INC.: REVENUE SHARE BY SEGMENT, 2021 (%)
FIGURE 69. TRIMBLE, INC.: REVENUE SHARE BY REGION, 2021 (%
SELECT A FORMAT
Added to Cart
Electronic

$5730

Single User License
Electronic

$6450

Multi User License
Electronic

$9600

Enterprise License
Electronic

$3840

Data Pack License
Add to Cart
Buy Now (15% Discount)

OUR CUSTOMER

Leap India

SIMILAR REPORTS