0
U.S. (TOLL FREE)
+1 (315) 215-3225
Automative

0
U.S. (TOLL FREE)
+1 (315) 215-3225
Fossil Fuel Energy Market By Sources (Coal, Oil, Natural Gas), By End-user (Residential, Commercial, Industrial, Transportation): Global Opportunity Analysis and Industry Forecast, 2022-2031
Published Date: April 2023
|
Report Code: ALLI-Auto-2Z963
Home | Market Reports | Business & Industrial| Energy & Utilities| Oil & Gas
Fossil Fuel Energy Market By Sources Coal Oil Natural Gas By End user Residential Commercial Industrial Transportation Global Opportunity Analysis and Industry Forecast 2022 2031
BUY CHAPTERS

Fossil Fuel Energy Market By Sources (Coal, Oil, Natural Gas), By End-user (Residential, Commercial, Industrial, Transportation): Global Opportunity Analysis and Industry Forecast, 2022-2031

Code: ALLI-Auto-2Z963
Report
April 2023
Pages:280
Allied Market Research
Buy Now with 15% Discount
DESCRIPTION
TABLE OF CONTENT
TABLES & FIGURES

Fossil Fuel Energy Market Size

According to a new report published by , titled, “Fossil Fuel Energy Market," The fossil fuel energy market was valued at $6.3 trillion in 2021, and is estimated to reach $10.6 trillion by 2031, growing at a CAGR of 5.3% from 2022 to 2031.

Fossil Fuel Energy Market

Fossil Fuel Energy Market

Fossil fuel energy, also known as non-renewable energy sources, is a group of materials that generate electricity. Increased energy efficiency, lower operational costs, and other advantages are provided by fossil fuel energy. Fossil fuel energy installation results in significant energy savings that are acceptable for a range of end users. The energy generated is used for several purposes across various sectors.
Fossil fuels, which include coal, oil, and natural gas, have long served as the main sources of energy and are still in high demand on a global scale. Future demand for fossil fuels is projected to increase as the global population continues to climb and developing nations use more energy to drive economic expansion. However, numerous industries and sectors, like manufacturing, transportation, and energy production, rely significantly on fossil fuels to run their operations. Even though renewable energy sources like wind, solar, and hydroelectric power are gaining popularity, they still constitute only an insignificant part of the worldwide energy mix. In the following years, it is anticipated that the demand for fossil fuels will remain high.
For fossil fuel corporations, diversification can be a wise approach to lower risk and expand market opportunities. Companies can spread their resources and investments across a variety of fossil fuels, which can assist to protect them against changes in any one specific market. For instance, a corporation that also produces natural gas could continue to make money from that market even if the demand for oil fell sharply. Similar to the way a corporation with a diversified portfolio could continue to rely on revenue from oil production even if natural gas prices fell. This can defend against market swings and help to stabilise the company's earnings. All of these factors are anticipated to increase the size of the fossil fuel energy market in
Economic considerations like the expansion of industrialization and the rising demand for energy to run homes, businesses, and transportation are the major factors driving the demand for fossil fuels. Global oil reserves, production levels, and other supply and demand variables also affect the price of fossil fuels. Fossil fuel availability and industry expansion have also been aided by technological developments in the extraction and production of fossil fuels, such as horizontal drilling and hydraulic fracturing. The market for fossil fuel energy is also significantly driven by the transportation industry. The majority of vehicles, from automobiles and trucks to buses and airplanes, are powered by gasoline and diesel fuel. The demand for these fuels rises along with the number of automobiles. The amount of gasoline required to power transportation might vary depending on the distance traveled by vehicles, the effectiveness of their engines, and the intensity of traffic congestion. These factors significantly influence the market for fossil fuel energy.
For fossil fuel organizations, diversification can be a wise approach to lower risk and expand market prospects. Companies can diversify their resources and investments by investing in a variety of fossil fuels, which can help protect them against shifts in any one particular market. For instance, an organization that also produces natural gas could continue to make money from that market even if the demand for oil falls sharply. Similar to how an organization with a broad portfolio could continue to rely on revenue from oil production even if natural gas prices fall. This can serve as a buffer against market turbulence and help to stabilise the organization’s earnings.
The key players profiled in the study include Iberdrola, SA, Huaneng Power International, Inc,  Engie SA, Enel SpA, State Power Investment Corporation Limited., AGL Energy Limited, Origin Energy Limited, Energy Australia Holdings Limited, Stanwell Corporation Limited, and American Electric Power. The players in the market are actively engaged in the adoption of various strategies such as acquisitions, product launches, and expansion to remain competitive and gain advantage over competitors in the market. The portfolio of 6,750 MW fossil-fuel plants owned by Public Service Enterprise Group (PSEG) was purchased for $1.92 billion in August 2021 by ArcLight Capital Partners, LLC, a U.S.-based corporation that specializes in energy infrastructure investments. ArcLight Capital Partners LLC's expansion into a renewable energy infrastructure company, which will aid them in achieving their objective of a low-carbon economy, includes this acquisition. Electricity generated from fossil fuels is provided by Public Service Enterprise Group (PSEG), a U.S.-based provider of electric services.
Key Market Insights
On the basis of source, the oil segment had a dominating market share in 2021 and is estimated to be the fastest growing during the forecast period
On the basis of end user, the industrial segment accounted for a dominating market share in 2021
On the basis of region, Asia-Pacific accounted for the highest market share in 2021
 

Overview

The global fossil fuel energy market is anticipated to reach $10,646.5 million by 2031, growing from $6,263.6 million in 2021 at a CAGR of 5.3% from 2022 to 2031.
Electricity produced by businesses using fossil fuels including coal, oil, and natural gas as energy sources is referred to as fossil fuel energy. The term ‘fossil fuels’ refers to underground, flammable deposits of organic material that are generated from decomposing plants and animals and have undergone heat and pressure in the earth's crust to become crude oil, coal, natural gas, or heavy oils.    
The demand for fossil fuels is mostly being driven by economic causes including the growth of industrialization and the increase in need for energy to power buildings, businesses, and transportation. Fossil fuel costs are also influenced by factors such as supply and demand, production levels, and global oil reserves. The advancement of technology in the extraction and production of fossil fuels, such as horizontal drilling and hydraulic fracturing, has also contributed to the availability of fossil fuels and the growth of the sector. The transportation sector plays a crucial role in driving the demand for fossil fuel energy.
Rising awareness among the population regarding the use of renewable energy sources such as wind, solar, and hydro power is expected to steadily increase the market share of fossil fuels. This is expected to happen as green technologies are cost- and efficient-effective. The cost of renewable energies has been falling due to economies of scale, government policies promoting the development of clean energy sources, and technical advancements. These factors are anticipated to hamper the fossil fuel energy market growth during the forecast period.
Diversification can be a smart strategy for fossil fuel companies to reduce risk and increase market opportunities. By investing in a variety of fossil fuels, businesses can spread their resources and investments across a range of products, which can help shield them from changes in any one specific market. For instance, even if the demand for oil dropped significantly, a company that also produces natural gas could continue to profit from that market. The same way that a company with a diverse portfolio could continue to depend on income from oil output in the event that natural gas prices declined. This can protect against market volatility and aid in stabilizing the company's profits.
The COVID-19 pandemic has created a number of challenges that have greatly impeded the growth of the fossil fuel energy market due to low demand from end-use sectors. The fall in economic activity, travel restrictions, and lockdowns led to a sudden drop in demand for oil and gas, which precipitated a price collapse and reduced the profitability of fossil fuel producers. The oil and gas industry was especially hard hit owing to the sharp drop in demand for transportation fuels like gasoline and jet fuel. Oil prices dropped for the first time in the last few years due to a shortage in the market and a price war between the major oil-producing countries.
The key players profiled in this report include Iberdrola, SA, Huaneng Power International, Inc,  Engie SA, Enel SpA, State Power Investment Corporation Limited., AGL Energy Limited, Origin Energy Limited, Energy Australia Holdings Limited, Stanwell Corporation Limited, and American Electric Power.

Key Benefits For Stakeholders

●This report provides a quantitative analysis of the market segments, current trends, estimations, and dynamics of the fossil fuel energy market analysis from 2021 to 2031 to identify the prevailing fossil fuel energy market opportunities.
●The market research is offered along with information related to key drivers, restraints, and opportunities.
●Porter's five forces analysis highlights the potency of buyers and suppliers to enable stakeholders make profit-oriented business decisions and strengthen their supplier-buyer network.
●In-depth analysis of the fossil fuel energy market segmentation assists to determine the prevailing market opportunities.
●Major countries in each region are mapped according to their revenue contribution to the global market.
●Market player positioning facilitates benchmarking and provides a clear understanding of the present position of the market players.
●The report includes the analysis of the regional as well as global fossil fuel energy market trends, key players, market segments, application areas, and market growth strategies.
Key Market Segments
○ american electric powe

Scope of Fossil Fuel Energy Market Report

Report Metric Details
Report Name Fossil Fuel Energy Market
CAGR 5.3%
By Sources ● Natural Gas
● Coal
● Oil
By End-user ● Residential
● Commercial
● Industrial
● Transportation
By Region
  • North America (United States, Canada)
  • Europe (Germany, France, UK, Italy, Russia) Rest of Europe
  • Nordic Countries
  • Asia-Pacific (China, Japan, South Korea)
  • Southeast Asia (India, Australia)
  • Rest of Asia
  • Latin America (Mexico, Brazil)
  • Rest of Latin America
  • Middle East & Africa (Turkey, Saudi Arabia, UAE, Rest of MEA)
Forecast units USD million in value
Report coverage Revenue and volume forecast, company share, competitive landscape, growth factors and trends
CHAPTER 1: INTRODUCTION
1.1. Report description
1.2. Key market segments
1.3. Key benefits to the stakeholders
1.4. Research Methodology
1.4.1. Primary research
1.4.2. Secondary research
1.4.3. Analyst tools and models
CHAPTER 2: EXECUTIVE SUMMARY
2.1. CXO Perspective
CHAPTER 3: MARKET OVERVIEW
3.1. Market definition and scope
3.2. Key findings
3.2.1. Top impacting factors
3.2.2. Top investment pockets
3.3. Porter’s five forces analysis
3.4. Market dynamics
3.4.1. Drivers
3.4.2. Restraints
3.4.3. Opportunities
3.5. COVID-19 Impact Analysis on the market
3.6. Key Regulation Analysis
3.7. Market Share Analysis
3.8. Patent Landscape
3.9. Regulatory Guidelines
3.10. Value Chain Analysis
CHAPTER 4: FOSSIL FUEL ENERGY MARKET, BY SOURCES
4.1. Overview
4.1.1. Market size and forecast
4.2. Coal
4.2.1. Key market trends, growth factors and opportunities
4.2.2. Market size and forecast, by region
4.2.3. Market share analysis by country
4.3. Oil
4.3.1. Key market trends, growth factors and opportunities
4.3.2. Market size and forecast, by region
4.3.3. Market share analysis by country
4.4. Natural Gas
4.4.1. Key market trends, growth factors and opportunities
4.4.2. Market size and forecast, by region
4.4.3. Market share analysis by country
CHAPTER 5: FOSSIL FUEL ENERGY MARKET, BY END-USER
5.1. Overview
5.1.1. Market size and forecast
5.2. Residential
5.2.1. Key market trends, growth factors and opportunities
5.2.2. Market size and forecast, by region
5.2.3. Market share analysis by country
5.3. Commercial
5.3.1. Key market trends, growth factors and opportunities
5.3.2. Market size and forecast, by region
5.3.3. Market share analysis by country
5.4. Industrial
5.4.1. Key market trends, growth factors and opportunities
5.4.2. Market size and forecast, by region
5.4.3. Market share analysis by country
5.5. Transportation
5.5.1. Key market trends, growth factors and opportunities
5.5.2. Market size and forecast, by region
5.5.3. Market share analysis by country
CHAPTER 6: FOSSIL FUEL ENERGY MARKET, BY REGION
6.1. Overview
6.1.1. Market size and forecast By Region
6.2. North America
6.2.1. Key trends and opportunities
6.2.2. Market size and forecast, by Sources
6.2.3. Market size and forecast, by End-user
6.2.4. Market size and forecast, by country
6.2.4.1. U.S.
6.2.4.1.1. Key market trends, growth factors and opportunities
6.2.4.1.2. Market size and forecast, by Sources
6.2.4.1.3. Market size and forecast, by End-user
6.2.4.2. Canada
6.2.4.2.1. Key market trends, growth factors and opportunities
6.2.4.2.2. Market size and forecast, by Sources
6.2.4.2.3. Market size and forecast, by End-user
6.2.4.3. Mexico
6.2.4.3.1. Key market trends, growth factors and opportunities
6.2.4.3.2. Market size and forecast, by Sources
6.2.4.3.3. Market size and forecast, by End-user
6.3. Europe
6.3.1. Key trends and opportunities
6.3.2. Market size and forecast, by Sources
6.3.3. Market size and forecast, by End-user
6.3.4. Market size and forecast, by country
6.3.4.1. Germany
6.3.4.1.1. Key market trends, growth factors and opportunities
6.3.4.1.2. Market size and forecast, by Sources
6.3.4.1.3. Market size and forecast, by End-user
6.3.4.2. UK
6.3.4.2.1. Key market trends, growth factors and opportunities
6.3.4.2.2. Market size and forecast, by Sources
6.3.4.2.3. Market size and forecast, by End-user
6.3.4.3. France
6.3.4.3.1. Key market trends, growth factors and opportunities
6.3.4.3.2. Market size and forecast, by Sources
6.3.4.3.3. Market size and forecast, by End-user
6.3.4.4. Spain
6.3.4.4.1. Key market trends, growth factors and opportunities
6.3.4.4.2. Market size and forecast, by Sources
6.3.4.4.3. Market size and forecast, by End-user
6.3.4.5. Italy
6.3.4.5.1. Key market trends, growth factors and opportunities
6.3.4.5.2. Market size and forecast, by Sources
6.3.4.5.3. Market size and forecast, by End-user
6.3.4.6. Rest of Europe
6.3.4.6.1. Key market trends, growth factors and opportunities
6.3.4.6.2. Market size and forecast, by Sources
6.3.4.6.3. Market size and forecast, by End-user
6.4. Asia-Pacific
6.4.1. Key trends and opportunities
6.4.2. Market size and forecast, by Sources
6.4.3. Market size and forecast, by End-user
6.4.4. Market size and forecast, by country
6.4.4.1. China
6.4.4.1.1. Key market trends, growth factors and opportunities
6.4.4.1.2. Market size and forecast, by Sources
6.4.4.1.3. Market size and forecast, by End-user
6.4.4.2. Japan
6.4.4.2.1. Key market trends, growth factors and opportunities
6.4.4.2.2. Market size and forecast, by Sources
6.4.4.2.3. Market size and forecast, by End-user
6.4.4.3. India
6.4.4.3.1. Key market trends, growth factors and opportunities
6.4.4.3.2. Market size and forecast, by Sources
6.4.4.3.3. Market size and forecast, by End-user
6.4.4.4. South Korea
6.4.4.4.1. Key market trends, growth factors and opportunities
6.4.4.4.2. Market size and forecast, by Sources
6.4.4.4.3. Market size and forecast, by End-user
6.4.4.5. Australia
6.4.4.5.1. Key market trends, growth factors and opportunities
6.4.4.5.2. Market size and forecast, by Sources
6.4.4.5.3. Market size and forecast, by End-user
6.4.4.6. Rest of Asia-Pacific
6.4.4.6.1. Key market trends, growth factors and opportunities
6.4.4.6.2. Market size and forecast, by Sources
6.4.4.6.3. Market size and forecast, by End-user
6.5. LAMEA
6.5.1. Key trends and opportunities
6.5.2. Market size and forecast, by Sources
6.5.3. Market size and forecast, by End-user
6.5.4. Market size and forecast, by country
6.5.4.1. Brazil
6.5.4.1.1. Key market trends, growth factors and opportunities
6.5.4.1.2. Market size and forecast, by Sources
6.5.4.1.3. Market size and forecast, by End-user
6.5.4.2. UAE
6.5.4.2.1. Key market trends, growth factors and opportunities
6.5.4.2.2. Market size and forecast, by Sources
6.5.4.2.3. Market size and forecast, by End-user
6.5.4.3. Saudi Arabia
6.5.4.3.1. Key market trends, growth factors and opportunities
6.5.4.3.2. Market size and forecast, by Sources
6.5.4.3.3. Market size and forecast, by End-user
6.5.4.4. South Africa
6.5.4.4.1. Key market trends, growth factors and opportunities
6.5.4.4.2. Market size and forecast, by Sources
6.5.4.4.3. Market size and forecast, by End-user
6.5.4.5. Rest of LAMEA
6.5.4.5.1. Key market trends, growth factors and opportunities
6.5.4.5.2. Market size and forecast, by Sources
6.5.4.5.3. Market size and forecast, by End-user
CHAPTER 7: COMPETITIVE LANDSCAPE
7.1. Introduction
7.2. Top winning strategies
7.3. Product Mapping of Top 10 Player
7.4. Competitive Dashboard
7.5. Competitive Heatmap
7.6. Top player positioning, 2021
CHAPTER 8: COMPANY PROFILES
8.1. Iberdrola, SA
8.1.1. Company overview
8.1.2. Key Executives
8.1.3. Company snapshot
8.2. huaneng power international, inc.
8.2.1. Company overview
8.2.2. Key Executives
8.2.3. Company snapshot
8.3. Engie SA
8.3.1. Company overview
8.3.2. Key Executives
8.3.3. Company snapshot
8.4. Enel Spa
8.4.1. Company overview
8.4.2. Key Executives
8.4.3. Company snapshot
8.5. State Power Investment Corporation Limited.
8.5.1. Company overview
8.5.2. Key Executives
8.5.3. Company snapshot
8.6. AGL Energy Limited
8.6.1. Company overview
8.6.2. Key Executives
8.6.3. Company snapshot
8.7. Origin Energy Limited
8.7.1. Company overview
8.7.2. Key Executives
8.7.3. Company snapshot
8.8. EnergyAustralia Holdings Limited
8.8.1. Company overview
8.8.2. Key Executives
8.8.3. Company snapshot
8.9. stanwell corporation limited
8.9.1. Company overview
8.9.2. Key Executives
8.9.3. Company snapshot
8.10. american electric power
8.10.1. Company overview
8.10.2. Key Executives
8.10.3. Company snapsho
LIST OF TABLES
TABLE 01. GLOBAL FOSSIL FUEL ENERGY MARKET, BY SOURCES, 2021-2031 ($BILLION)
TABLE 02. FOSSIL FUEL ENERGY MARKET FOR COAL, BY REGION, 2021-2031 ($BILLION)
TABLE 03. FOSSIL FUEL ENERGY MARKET FOR OIL, BY REGION, 2021-2031 ($BILLION)
TABLE 04. FOSSIL FUEL ENERGY MARKET FOR NATURAL GAS, BY REGION, 2021-2031 ($BILLION)
TABLE 05. GLOBAL FOSSIL FUEL ENERGY MARKET, BY END-USER, 2021-2031 ($BILLION)
TABLE 06. FOSSIL FUEL ENERGY MARKET FOR RESIDENTIAL, BY REGION, 2021-2031 ($BILLION)
TABLE 07. FOSSIL FUEL ENERGY MARKET FOR COMMERCIAL, BY REGION, 2021-2031 ($BILLION)
TABLE 08. FOSSIL FUEL ENERGY MARKET FOR INDUSTRIAL, BY REGION, 2021-2031 ($BILLION)
TABLE 09. FOSSIL FUEL ENERGY MARKET FOR TRANSPORTATION, BY REGION, 2021-2031 ($BILLION)
TABLE 10. FOSSIL FUEL ENERGY MARKET, BY REGION, 2021-2031 ($BILLION)
TABLE 11. NORTH AMERICA FOSSIL FUEL ENERGY MARKET, BY SOURCES, 2021-2031 ($BILLION)
TABLE 12. NORTH AMERICA FOSSIL FUEL ENERGY MARKET, BY END-USER, 2021-2031 ($BILLION)
TABLE 13. NORTH AMERICA FOSSIL FUEL ENERGY MARKET, BY COUNTRY, 2021-2031 ($BILLION)
TABLE 14. U.S. FOSSIL FUEL ENERGY MARKET, BY SOURCES, 2021-2031 ($BILLION)
TABLE 15. U.S. FOSSIL FUEL ENERGY MARKET, BY END-USER, 2021-2031 ($BILLION)
TABLE 16. CANADA FOSSIL FUEL ENERGY MARKET, BY SOURCES, 2021-2031 ($BILLION)
TABLE 17. CANADA FOSSIL FUEL ENERGY MARKET, BY END-USER, 2021-2031 ($BILLION)
TABLE 18. MEXICO FOSSIL FUEL ENERGY MARKET, BY SOURCES, 2021-2031 ($BILLION)
TABLE 19. MEXICO FOSSIL FUEL ENERGY MARKET, BY END-USER, 2021-2031 ($BILLION)
TABLE 20. EUROPE FOSSIL FUEL ENERGY MARKET, BY SOURCES, 2021-2031 ($BILLION)
TABLE 21. EUROPE FOSSIL FUEL ENERGY MARKET, BY END-USER, 2021-2031 ($BILLION)
TABLE 22. EUROPE FOSSIL FUEL ENERGY MARKET, BY COUNTRY, 2021-2031 ($BILLION)
TABLE 23. GERMANY FOSSIL FUEL ENERGY MARKET, BY SOURCES, 2021-2031 ($BILLION)
TABLE 24. GERMANY FOSSIL FUEL ENERGY MARKET, BY END-USER, 2021-2031 ($BILLION)
TABLE 25. UK FOSSIL FUEL ENERGY MARKET, BY SOURCES, 2021-2031 ($BILLION)
TABLE 26. UK FOSSIL FUEL ENERGY MARKET, BY END-USER, 2021-2031 ($BILLION)
TABLE 27. FRANCE FOSSIL FUEL ENERGY MARKET, BY SOURCES, 2021-2031 ($BILLION)
TABLE 28. FRANCE FOSSIL FUEL ENERGY MARKET, BY END-USER, 2021-2031 ($BILLION)
TABLE 29. SPAIN FOSSIL FUEL ENERGY MARKET, BY SOURCES, 2021-2031 ($BILLION)
TABLE 30. SPAIN FOSSIL FUEL ENERGY MARKET, BY END-USER, 2021-2031 ($BILLION)
TABLE 31. ITALY FOSSIL FUEL ENERGY MARKET, BY SOURCES, 2021-2031 ($BILLION)
TABLE 32. ITALY FOSSIL FUEL ENERGY MARKET, BY END-USER, 2021-2031 ($BILLION)
TABLE 33. REST OF EUROPE FOSSIL FUEL ENERGY MARKET, BY SOURCES, 2021-2031 ($BILLION)
TABLE 34. REST OF EUROPE FOSSIL FUEL ENERGY MARKET, BY END-USER, 2021-2031 ($BILLION)
TABLE 35. ASIA-PACIFIC FOSSIL FUEL ENERGY MARKET, BY SOURCES, 2021-2031 ($BILLION)
TABLE 36. ASIA-PACIFIC FOSSIL FUEL ENERGY MARKET, BY END-USER, 2021-2031 ($BILLION)
TABLE 37. ASIA-PACIFIC FOSSIL FUEL ENERGY MARKET, BY COUNTRY, 2021-2031 ($BILLION)
TABLE 38. CHINA FOSSIL FUEL ENERGY MARKET, BY SOURCES, 2021-2031 ($BILLION)
TABLE 39. CHINA FOSSIL FUEL ENERGY MARKET, BY END-USER, 2021-2031 ($BILLION)
TABLE 40. JAPAN FOSSIL FUEL ENERGY MARKET, BY SOURCES, 2021-2031 ($BILLION)
TABLE 41. JAPAN FOSSIL FUEL ENERGY MARKET, BY END-USER, 2021-2031 ($BILLION)
TABLE 42. INDIA FOSSIL FUEL ENERGY MARKET, BY SOURCES, 2021-2031 ($BILLION)
TABLE 43. INDIA FOSSIL FUEL ENERGY MARKET, BY END-USER, 2021-2031 ($BILLION)
TABLE 44. SOUTH KOREA FOSSIL FUEL ENERGY MARKET, BY SOURCES, 2021-2031 ($BILLION)
TABLE 45. SOUTH KOREA FOSSIL FUEL ENERGY MARKET, BY END-USER, 2021-2031 ($BILLION)
TABLE 46. AUSTRALIA FOSSIL FUEL ENERGY MARKET, BY SOURCES, 2021-2031 ($BILLION)
TABLE 47. AUSTRALIA FOSSIL FUEL ENERGY MARKET, BY END-USER, 2021-2031 ($BILLION)
TABLE 48. REST OF ASIA-PACIFIC FOSSIL FUEL ENERGY MARKET, BY SOURCES, 2021-2031 ($BILLION)
TABLE 49. REST OF ASIA-PACIFIC FOSSIL FUEL ENERGY MARKET, BY END-USER, 2021-2031 ($BILLION)
TABLE 50. LAMEA FOSSIL FUEL ENERGY MARKET, BY SOURCES, 2021-2031 ($BILLION)
TABLE 51. LAMEA FOSSIL FUEL ENERGY MARKET, BY END-USER, 2021-2031 ($BILLION)
TABLE 52. LAMEA FOSSIL FUEL ENERGY MARKET, BY COUNTRY, 2021-2031 ($BILLION)
TABLE 53. BRAZIL FOSSIL FUEL ENERGY MARKET, BY SOURCES, 2021-2031 ($BILLION)
TABLE 54. BRAZIL FOSSIL FUEL ENERGY MARKET, BY END-USER, 2021-2031 ($BILLION)
TABLE 55. UAE FOSSIL FUEL ENERGY MARKET, BY SOURCES, 2021-2031 ($BILLION)
TABLE 56. UAE FOSSIL FUEL ENERGY MARKET, BY END-USER, 2021-2031 ($BILLION)
TABLE 57. SAUDI ARABIA FOSSIL FUEL ENERGY MARKET, BY SOURCES, 2021-2031 ($BILLION)
TABLE 58. SAUDI ARABIA FOSSIL FUEL ENERGY MARKET, BY END-USER, 2021-2031 ($BILLION)
TABLE 59. SOUTH AFRICA FOSSIL FUEL ENERGY MARKET, BY SOURCES, 2021-2031 ($BILLION)
TABLE 60. SOUTH AFRICA FOSSIL FUEL ENERGY MARKET, BY END-USER, 2021-2031 ($BILLION)
TABLE 61. REST OF LAMEA FOSSIL FUEL ENERGY MARKET, BY SOURCES, 2021-2031 ($BILLION)
TABLE 62. REST OF LAMEA FOSSIL FUEL ENERGY MARKET, BY END-USER, 2021-2031 ($BILLION)
TABLE 63. IBERDROLA, SA: KEY EXECUTIVES
TABLE 64. IBERDROLA, SA: COMPANY SNAPSHOT
TABLE 65. HUANENG POWER INTERNATIONAL, INC.: KEY EXECUTIVES
TABLE 66. HUANENG POWER INTERNATIONAL, INC.: COMPANY SNAPSHOT
TABLE 67. ENGIE SA: KEY EXECUTIVES
TABLE 68. ENGIE SA: COMPANY SNAPSHOT
TABLE 69. ENEL SPA: KEY EXECUTIVES
TABLE 70. ENEL SPA: COMPANY SNAPSHOT
TABLE 71. STATE POWER INVESTMENT CORPORATION LIMITED.: KEY EXECUTIVES
TABLE 72. STATE POWER INVESTMENT CORPORATION LIMITED.: COMPANY SNAPSHOT
TABLE 73. AGL ENERGY LIMITED: KEY EXECUTIVES
TABLE 74. AGL ENERGY LIMITED: COMPANY SNAPSHOT
TABLE 75. ORIGIN ENERGY LIMITED: KEY EXECUTIVES
TABLE 76. ORIGIN ENERGY LIMITED: COMPANY SNAPSHOT
TABLE 77. ENERGYAUSTRALIA HOLDINGS LIMITED: KEY EXECUTIVES
TABLE 78. ENERGYAUSTRALIA HOLDINGS LIMITED: COMPANY SNAPSHOT
TABLE 79. STANWELL CORPORATION LIMITED: KEY EXECUTIVES
TABLE 80. STANWELL CORPORATION LIMITED: COMPANY SNAPSHOT
TABLE 81. AMERICAN ELECTRIC POWER: KEY EXECUTIVES
TABLE 82. AMERICAN ELECTRIC POWER: COMPANY SNAPSHOT LIST OF FIGURES
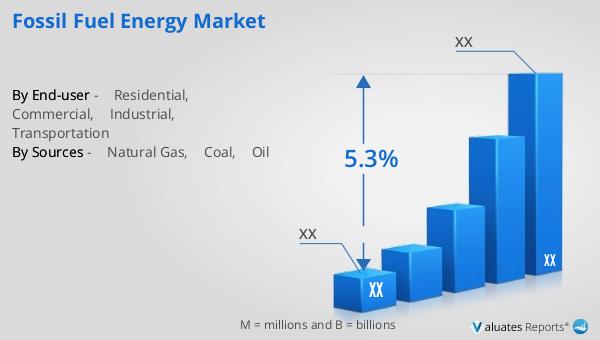
FIGURE 01. FOSSIL FUEL ENERGY MARKET, 2021-2031
FIGURE 02. SEGMENTATION OF FOSSIL FUEL ENERGY MARKET, 2021-2031
FIGURE 03. TOP INVESTMENT POCKETS IN FOSSIL FUEL ENERGY MARKET (2022-2031)
FIGURE 04. PORTER FIVE-1
FIGURE 05. PORTER FIVE-2
FIGURE 06. PORTER FIVE-3
FIGURE 07. PORTER FIVE-4
FIGURE 08. PORTER FIVE-5
FIGURE 09. DRIVERS, RESTRAINTS AND OPPORTUNITIES: GLOBALFOSSIL FUEL ENERGY MARKET
FIGURE 10. IMPACT OF KEY REGULATION: FOSSIL FUEL ENERGY MARKET
FIGURE 11. MARKET SHARE ANALYSIS: FOSSIL FUEL ENERGY MARKET
FIGURE 12. PATENT ANALYSIS BY COMPANY
FIGURE 13. PATENT ANALYSIS BY COUNTRY
FIGURE 14. REGULATORY GUIDELINES: FOSSIL FUEL ENERGY MARKET
FIGURE 15. VALUE CHAIN ANALYSIS: FOSSIL FUEL ENERGY MARKET
FIGURE 16. FOSSIL FUEL ENERGY MARKET, BY SOURCES, 2021(%)
FIGURE 17. COMPARATIVE SHARE ANALYSIS OF FOSSIL FUEL ENERGY MARKET FOR COAL, BY COUNTRY 2021 AND 2031(%)
FIGURE 18. COMPARATIVE SHARE ANALYSIS OF FOSSIL FUEL ENERGY MARKET FOR OIL, BY COUNTRY 2021 AND 2031(%)
FIGURE 19. COMPARATIVE SHARE ANALYSIS OF FOSSIL FUEL ENERGY MARKET FOR NATURAL GAS, BY COUNTRY 2021 AND 2031(%)
FIGURE 20. FOSSIL FUEL ENERGY MARKET, BY END-USER, 2021(%)
FIGURE 21. COMPARATIVE SHARE ANALYSIS OF FOSSIL FUEL ENERGY MARKET FOR RESIDENTIAL, BY COUNTRY 2021 AND 2031(%)
FIGURE 22. COMPARATIVE SHARE ANALYSIS OF FOSSIL FUEL ENERGY MARKET FOR COMMERCIAL, BY COUNTRY 2021 AND 2031(%)
FIGURE 23. COMPARATIVE SHARE ANALYSIS OF FOSSIL FUEL ENERGY MARKET FOR INDUSTRIAL, BY COUNTRY 2021 AND 2031(%)
FIGURE 24. COMPARATIVE SHARE ANALYSIS OF FOSSIL FUEL ENERGY MARKET FOR TRANSPORTATION, BY COUNTRY 2021 AND 2031(%)
FIGURE 25. FOSSIL FUEL ENERGY MARKET BY REGION, 2021
FIGURE 26. U.S. FOSSIL FUEL ENERGY MARKET, 2021-2031 ($BILLION)
FIGURE 27. CANADA FOSSIL FUEL ENERGY MARKET, 2021-2031 ($BILLION)
FIGURE 28. MEXICO FOSSIL FUEL ENERGY MARKET, 2021-2031 ($BILLION)
FIGURE 29. GERMANY FOSSIL FUEL ENERGY MARKET, 2021-2031 ($BILLION)
FIGURE 30. UK FOSSIL FUEL ENERGY MARKET, 2021-2031 ($BILLION)
FIGURE 31. FRANCE FOSSIL FUEL ENERGY MARKET, 2021-2031 ($BILLION)
FIGURE 32. SPAIN FOSSIL FUEL ENERGY MARKET, 2021-2031 ($BILLION)
FIGURE 33. ITALY FOSSIL FUEL ENERGY MARKET, 2021-2031 ($BILLION)
FIGURE 34. REST OF EUROPE FOSSIL FUEL ENERGY MARKET, 2021-2031 ($BILLION)
FIGURE 35. CHINA FOSSIL FUEL ENERGY MARKET, 2021-2031 ($BILLION)
FIGURE 36. JAPAN FOSSIL FUEL ENERGY MARKET, 2021-2031 ($BILLION)
FIGURE 37. INDIA FOSSIL FUEL ENERGY MARKET, 2021-2031 ($BILLION)
FIGURE 38. SOUTH KOREA FOSSIL FUEL ENERGY MARKET, 2021-2031 ($BILLION)
FIGURE 39. AUSTRALIA FOSSIL FUEL ENERGY MARKET, 2021-2031 ($BILLION)
FIGURE 40. REST OF ASIA-PACIFIC FOSSIL FUEL ENERGY MARKET, 2021-2031 ($BILLION)
FIGURE 41. BRAZIL FOSSIL FUEL ENERGY MARKET, 2021-2031 ($BILLION)
FIGURE 42. UAE FOSSIL FUEL ENERGY MARKET, 2021-2031 ($BILLION)
FIGURE 43. SAUDI ARABIA FOSSIL FUEL ENERGY MARKET, 2021-2031 ($BILLION)
FIGURE 44. SOUTH AFRICA FOSSIL FUEL ENERGY MARKET, 2021-2031 ($BILLION)
FIGURE 45. REST OF LAMEA FOSSIL FUEL ENERGY MARKET, 2021-2031 ($BILLION)
FIGURE 46. TOP WINNING STRATEGIES, BY YEAR
FIGURE 47. TOP WINNING STRATEGIES, BY DEVELOPMENT
FIGURE 48. TOP WINNING STRATEGIES, BY COMPANY
FIGURE 49. PRODUCT MAPPING OF TOP 10 PLAYERS
FIGURE 50. COMPETITIVE DASHBOARD
FIGURE 51. COMPETITIVE HEATMAP: FOSSIL FUEL ENERGY MARKET
FIGURE 52. TOP PLAYER POSITIONING, 202
SELECT A FORMAT
Added to Cart
Electronic (PDF)

$5730

This license allows only one user to access the PDF.
Electronic (PDF)

$6450

This license allows 1 - 5 user to access the PDF, license is suitable for small groups of 5 users working together
Electronic (PDF)

$9600

This license allows users/teams in a same Enterprise to use this report, various departments within an enterpise can use this report
Electronic (PDF)

$3840

This license just provides quantitative data in a excel sheet
Add to Cart
Buy Now (15% Discount)

OUR CUSTOMER

Samsung SD

SIMILAR REPORTS


RELATED REPORTS

Global Virtual Pipeline Solutions Market Research Report 2024

120 Pages
Type: Report
Code: QYRE-Auto-34F12015
Thu May 16 00:00:00 UTC 2024

Add to Cart

Global 1,4-Xylene Market Research Report 2024

120 Pages
Type: Report
Code: QYRE-Auto-17N9486
Thu May 16 00:00:00 UTC 2024

Add to Cart

Global Vegetable Oil Transformer Market Research Report 2024

120 Pages
Type: Report
Code: QYRE-Auto-30N14699
Wed May 15 00:00:00 UTC 2024

Add to Cart

Global Transmission Housing Market Research Report 2024

120 Pages
Type: Report
Code: QYRE-Auto-14C12470
Wed May 15 00:00:00 UTC 2024

Add to Cart