0
U.S. (TOLL FREE)
+1 (315) 215-3225
Automative

0
U.S. (TOLL FREE)
+1 (315) 215-3225
Rubber Testing Equipment Market By Product Type (Rubber Process Analyzers, Moving Die Rheometer, Mooney Viscometer), By End Use (Tires, General rubber Goods, Industrial Rubber Products, Others): Global Opportunity Analysis and Industry Forecast, 2023-2032
Published Date: September 2023
|
Report Code: ALLI-Auto-3A665
Home | Market Reports | Business & Industrial| Industrial Materials & Equipment
Rubber Testing Equipment Market By Product Type Rubber Process Analyzers Moving Die Rheometer Mooney Viscometer By End Use Tires General rubber Goods Industrial Rubber Products Others Global Opportunity Analysis and Industry Forecast 2023 2032
BUY CHAPTERS

Rubber Testing Equipment Market By Product Type (Rubber Process Analyzers, Moving Die Rheometer, Mooney Viscometer), By End Use (Tires, General rubber Goods, Industrial Rubber Products, Others): Global Opportunity Analysis and Industry Forecast, 2023-2032

Code: ALLI-Auto-3A665
Report
September 2023
Pages:260
Allied Market Research
Buy Now with 15% Discount
DESCRIPTION
TABLE OF CONTENT
TABLES & FIGURES

Rubber Testing Equipment Market Size

According to a new report published by , titled, “Rubber Testing Equipment Market," The rubber testing equipment market was valued at $13.69 billion in 2022, and is estimated to reach $22.2 billion by 2032, growing at a CAGR of 5% from 2023 to 2032.

Rubber Testing Equipment Market

Rubber Testing Equipment Market

Rubber testing is a broad collection of processes and studies used to evaluate the physical, mechanical, and chemical properties of rubber materials. These tests play an important role in verifying the quality and performance of rubber goods in industries ranging from automotive to aerospace to manufacturing. Tensile strength tests are commonly used to determine material strength, hardness tests to determine resistance to deformation, and abrasion tests to determine wear resistance. Moreover, rubber testing may involve examinations for elasticity, temperature resistance, chemical compatibility, and durability. The results of these tests inform the development and production of rubber products, enhancing their reliability and safety. The main objective of rubber testing equipment is to assess and measure various properties of rubber materials. These tests aim to ensure the quality, reliability, and performance of rubber products in different applications and industries. By quantifying characteristics such as tensile strength, hardness, elasticity, abrasion resistance, and chemical compatibility, rubber testing equipment helps manufacturers and researchers make informed decisions about material selection, formulation, and product development. Ultimately, the main goal is to produce rubber products that meet or exceed specific standards and requirements, ensuring safety, durability, and effectiveness in their intended uses.
Key factors driving the growth of the rubber testing equipment market include increase in safety concerns, growing environmental awareness, and others. Increase in safety concerns is a paramount concern in industries such as healthcare (medical equipment), transportation (tires), and construction (seals and gaskets). Reliable testing equipment helps identify potential safety hazards and prevent accidents. Rubber testing equipment plays a crucial role in identifying potential hazards and vulnerabilities in these critical applications. For instance, in the automotive sector, tires must meet stringent safety standards to ensure stability and grip on the road. Any defects or weaknesses in the rubber can lead to accidents. Similarly, in the healthcare sector, the integrity of rubber components in medical devices, such as seals and tubing, is vital to prevent leaks or contamination, which could jeopardize patient safety. Moreover, growing environmental awareness fuels the rubber testing equipment market by supporting the development and validation of sustainable rubber solutions. As environmental concerns become more prominent, industries are increasingly focused on reducing their carbon footprint and minimizing the environmental impact of their products. This necessitates the development and testing of rubber materials that are environmentally friendly, recyclable, and comply with sustainability standards. Rubber testing equipment plays a crucial role in assessing the eco-friendliness and sustainability of these materials, measuring factors such as biodegradability, recyclability, and the absence of harmful chemicals. Additionally, as regulations and consumer preferences shift towards greener products, industries must ensure their rubber components meet these requirements, making rubber testing equipment an essential tool for verifying compliance and enabling eco-conscious product development.
The market also offers growth opportunities to the key players in the market. Technological advancement, and others. Technological advancement is a promising opportunity within the rubber testing equipment market. Continuous innovation in testing equipment, such as the development of automated systems and advanced sensors, allows companies to offer cutting-edge solutions that enhance testing accuracy, efficiency, and data analysis. Investing in and offering these innovations can be a significant growth driver.
The rubber testing equipment market is segmented based on product type, end user, and region. By product type, the market is segmented into rubber process analyzers, moving die rheometer, and mooney viscometer. By user, the market is classified into tires, general rubber goods, industrial rubber products, and others. 
Region wise, it is analyzed across North America (the U.S., Canada, and Mexico), Europe (UK, Germany, France, and the rest of Europe), Asia-Pacific (China, Japan, India, South Korea, Australia, and rest of Asia-Pacific), and LAMEA (Latin America, the Middle East, and Africa). 
The key players profiled in the report Alpha Technologies Services, Inc., TA Instruments, U-Can Dynatex Inc., MonTech Rubber Testing Solutions, Goettfert Inc., Ektron Tek Co., Ltd., Illinois Tool Works Inc., Norka Instruments, Prescott Instruments, and Qualitest. These key players have adopted strategies, such as product portfolio investments, expansion, acquisition and product launch to enhance their position in the Rubber testing equipment market. For instance, in April 2023, Qualitest acquire Q-Analysts, a US-based quality engineering company. The Q Analysts acquisition adds significant expertise in quality engineering for cutting-edge technologies. Through this acquisition, Qualitest expands its US geographical footprint to include new test labs in California and the State of Washington and capabilities in other key US service locations. It also enhances Qualitest’s presence in the UK, Madagascar, Switzerland, and India.
Key Market Insights
By Product Type, the Moving Die Rheometer segment was the highest revenue contributor to the market, and is estimated to reach $ 11.38 billion by 2032, with a CAGR of 5.76% during the forecast period.
By end use, the Industrial Rubber Products segment dominated the global market, and is estimated to reach $ 6.6 billion by 2032, with a CAGR of 3.84% during the forecast period.
Based on region, North America was the highest revenue contributor, accounting for $ 4.65 billion in 2022. However, Asia-Pacific was the fastest growing region with a CAGR of 6.19%.

Overview

The rubber testing equipment market was valued for $13.69 billion in 2022 and is estimated to reach $22.19 billion by 2032, exhibiting a CAGR of 5.01% from 2023 to 2032.
A rubber testing equipment market refers to the global industry that involves the manufacturing, distribution, and utilization of specialized instruments and devices designed to evaluate the properties and characteristics of rubber materials. This equipment can be of different types such as dielectric testers, rheometers, dynamic mechanical analyzers, tear resistance testers, proximity sensors, gas permeability testers etc. They serve to collect raw data or signals, which are processed and analyzed by algorithms and models to extract meaningful information. 
The growth of the global rubber testing equipment market is driven by a combination of factors that contribute to the increasing demand for rubber testing solutions across various industries, such as industry expansion and diversification, quality assurance and compliance, material optimization, advancements in testing technology and more. This demand is fueled by the popularity of rubber testing equipment in various industries, ranging from automotive and aerospace to construction and consumer goods, driving the growth of rubber testing equipment. Furthermore, the growing preference for rubber testing equipment, such as rubber process analyzers, and tensile testing machines opens an opportunity for the rubber testing equipment market. For instance, U-Can Dynatex Inc. incorporates rubber testing equipment such as rubber process analyzer, moving die rheometer, and tensile testing machines, enabling to track tensile strength, elongation, mechanical properties of rubber samples, analyze the flow and deformation characteristics of rubber compounds during processing, offering insights into their viscoelastic behavior. However, high Installation and maintenance costs hinder the growth of the market. The initial investment required for deploying rubber testing equipment can be substantial, including the costs of purchasing and integrating the different instruments into existing infrastructure. In addition, ongoing maintenance and calibration expenses can add to the overall cost burden, limiting the adoption of rubber testing equipment, particularly for small-scale businesses or organizations with budget constraints.
The main purpose of rubber testing equipment is to collect and process data from the different instruments and later manufacturer can improve those rubber-based products which give safe and sound end user experience. These instruments play a key role in identifying material defects and checking the strength of rubber, which helps the machines to analyze and interpret information. 
The rubber testing equipment market is segmented based on product type, end user, and region. By product type, the market is segmented into rubber process analyzers, moving die rheometer and mooney viscometer. As per end user, the market is classified into tires, general rubber goods, industrial rubber products, and others. 
Region wise, it is analyzed across North America (the U.S., Canada, and Mexico), Europe (UK, Germany, France, and the rest of Europe), Asia-Pacific (China, Japan, India, South Korea, and rest of Asia-Pacific), and LAMEA (Latin America, the Middle East, and Africa). 
Competitive analysis and profiles of the major rubber testing equipment market players, such as Alpha Technologies Services, Inc., TA Instruments, U-Can Dynatex Inc.,  MonTech Rubber Testing Solutions, Goettfert Inc., Ektron Tek Co., Ltd., Illinois Tool Works Inc., Norka Instruments, Prescott Instruments, and Qualitest are provided in this report. Product launch and acquisition business strategies were adopted by the major market players in 2022.

Key Benefits For Stakeholders

●This report provides a quantitative analysis of the market segments, current trends, estimations, and dynamics of the rubber testing equipment market analysis from 2022 to 2032 to identify the prevailing rubber testing equipment market opportunities.
●The market research is offered along with information related to key drivers, restraints, and opportunities.
●Porter's five forces analysis highlights the potency of buyers and suppliers to enable stakeholders make profit-oriented business decisions and strengthen their supplier-buyer network.
●In-depth analysis of the rubber testing equipment market segmentation assists to determine the prevailing market opportunities.
●Major countries in each region are mapped according to their revenue contribution to the global market.
●Market player positioning facilitates benchmarking and provides a clear understanding of the present position of the market players.
●The report includes the analysis of the regional as well as global rubber testing equipment market trends, key players, market segments, application areas, and market growth strategies.

Additional benefits you will get with this purchase are:

● Quarterly Update and* (only available with a corporate license, on listed price)
● 5 additional Company Profile of client Choice pre- or Post-purchase, as a free update.
● Free Upcoming Version on the Purchase of Five and Enterprise User License.
● 16 analyst hours of support* (post-purchase, if you find additional data requirements upon review of the report, you may receive support amounting to 16 analyst hours to solve questions, and post-sale queries)
● 15% Free Customization* (in case the scope or segment of the report does not match your requirements, 15% is equivalent to 3 working days of free work, applicable once)
● Free data Pack on the Five and Enterprise User License. (Excel version of the report)
● Free Updated report if the report is 6-12 months old or older.
● 24-hour priority response*
● Free Industry updates and white papers.
Possible Customization with this report (with additional cost and timeline, please talk to the sales executive to know more)
● Product Life Cycles
○ TA Instrument

Scope of Rubber Testing Equipment Market Report

Report Metric Details
Report Name Rubber Testing Equipment Market
Accounted market size in 2022 $ 13.69 in billion
Forecasted market size in 2032 $ 22.2 billion
CAGR 5%
Base Year 2022
Forecasted years 2024 - 2032
By Product Type ● Rubber Process Analyzers
● Moving Die Rheometer
● Mooney Viscometer
By End Use ● Tires
● General rubber Goods
● Industrial Rubber Products
● Others
By Region
  • North America (United States, Canada)
  • Europe (Germany, France, UK, Italy, Russia) Rest of Europe
  • Nordic Countries
  • Asia-Pacific (China, Japan, South Korea)
  • Southeast Asia (India, Australia)
  • Rest of Asia
  • Latin America (Mexico, Brazil)
  • Rest of Latin America
  • Middle East & Africa (Turkey, Saudi Arabia, UAE, Rest of MEA)
● New Product Development/ Product Matrix of Key Players ● Additional company profiles with specific to client's interest, ● Additional country or region analysis- market size and forecast, ● Key player details (including location, contact details, supplier/vendor network etc. in excel format), ● Market share analysis of players at global/region/country level, ● SWOT Analysis, Key Market Segments
Forecast units USD million in value
Report coverage Revenue and volume forecast, company share, competitive landscape, growth factors and trends

FAQ for this report

How fast is Rubber Testing Equipment Market growing?

Ans: The Rubber Testing Equipment Market witnessing a CAGR of 5% during the forecast period 2024-2032.

What is the Rubber Testing Equipment Market size in 2032?

Ans: The Rubber Testing Equipment Market size in 2032 will be $ 22.2 billion.

Who are the main players in the Rubber Testing Equipment Market report?

Ans: The main players in the Rubber Testing Equipment Market are ● Additional company profiles with specific to client's interest, ● Additional country or region analysis- market size and forecast, ● Key player details (including location, contact details, supplier/vendor network etc. in excel format), ● Market share analysis of players at global/region/country level, ● SWOT Analysis, Key Market Segments

What are the Type segmentation covered in the Rubber Testing Equipment Market report?

Ans: The Types covered in the Rubber Testing Equipment Market report are ● Rubber Process Analyzers, ● Moving Die Rheometer, ● Mooney Viscometer

CHAPTER 1: INTRODUCTION
1.1. Report description
1.2. Key market segments
1.3. Key benefits to the stakeholders
1.4. Research methodology
1.4.1. Primary research
1.4.2. Secondary research
1.4.3. Analyst tools and models
CHAPTER 2: EXECUTIVE SUMMARY
2.1. CXO Perspective
CHAPTER 3: MARKET OVERVIEW
3.1. Market definition and scope
3.2. Key findings
3.2.1. Top impacting factors
3.2.2. Top investment pockets
3.3. Porter’s five forces analysis
3.3.1. Low to high bargaining power of suppliers
3.3.2. Low to high threat of new entrants
3.3.3. Low to moderate threat of substitutes
3.3.4. Low to moderate intensity of rivalry
3.3.5. Low to high bargaining power of buyers
3.4. Market dynamics
3.4.1. Drivers
3.4.1.1. Growing awareness about product quality
3.4.1.2. Increase in demand for quality control
3.4.1.3. The rise of automobile industry and tire testing
3.4.2. Restraints
3.4.2.1. High ownership cost
3.4.3. Opportunities
3.4.3.1. Rising demand for eco-friendly rubber testing equipment
3.4.3.2. Advancements in technology
CHAPTER 4: RUBBER TESTING EQUIPMENT MARKET, BY PRODUCT TYPE
4.1. Overview
4.1.1. Market size and forecast
4.2. Rubber Process Analyzers
4.2.1. Key market trends, growth factors and opportunities
4.2.2. Market size and forecast, by region
4.2.3. Market share analysis by country
4.3. Moving Die Rheometer
4.3.1. Key market trends, growth factors and opportunities
4.3.2. Market size and forecast, by region
4.3.3. Market share analysis by country
4.4. Mooney Viscometer
4.4.1. Key market trends, growth factors and opportunities
4.4.2. Market size and forecast, by region
4.4.3. Market share analysis by country
CHAPTER 5: RUBBER TESTING EQUIPMENT MARKET, BY END USE
5.1. Overview
5.1.1. Market size and forecast
5.2. Tires
5.2.1. Key market trends, growth factors and opportunities
5.2.2. Market size and forecast, by region
5.2.3. Market share analysis by country
5.3. General rubber Goods
5.3.1. Key market trends, growth factors and opportunities
5.3.2. Market size and forecast, by region
5.3.3. Market share analysis by country
5.4. Industrial Rubber Products
5.4.1. Key market trends, growth factors and opportunities
5.4.2. Market size and forecast, by region
5.4.3. Market share analysis by country
5.5. Others
5.5.1. Key market trends, growth factors and opportunities
5.5.2. Market size and forecast, by region
5.5.3. Market share analysis by country
CHAPTER 6: RUBBER TESTING EQUIPMENT MARKET, BY REGION
6.1. Overview
6.1.1. Market size and forecast By Region
6.2. North America
6.2.1. Key market trends, growth factors and opportunities
6.2.2. Market size and forecast, by Product Type
6.2.3. Market size and forecast, by End Use
6.2.4. Market size and forecast, by country
6.2.4.1. U.S.
6.2.4.1.1. Market size and forecast, by Product Type
6.2.4.1.2. Market size and forecast, by End Use
6.2.4.2. Canada
6.2.4.2.1. Market size and forecast, by Product Type
6.2.4.2.2. Market size and forecast, by End Use
6.2.4.3. Mexico
6.2.4.3.1. Market size and forecast, by Product Type
6.2.4.3.2. Market size and forecast, by End Use
6.3. Europe
6.3.1. Key market trends, growth factors and opportunities
6.3.2. Market size and forecast, by Product Type
6.3.3. Market size and forecast, by End Use
6.3.4. Market size and forecast, by country
6.3.4.1. UK
6.3.4.1.1. Market size and forecast, by Product Type
6.3.4.1.2. Market size and forecast, by End Use
6.3.4.2. Germany
6.3.4.2.1. Market size and forecast, by Product Type
6.3.4.2.2. Market size and forecast, by End Use
6.3.4.3. France
6.3.4.3.1. Market size and forecast, by Product Type
6.3.4.3.2. Market size and forecast, by End Use
6.3.4.4. Italy
6.3.4.4.1. Market size and forecast, by Product Type
6.3.4.4.2. Market size and forecast, by End Use
6.3.4.5. Rest of Europe
6.3.4.5.1. Market size and forecast, by Product Type
6.3.4.5.2. Market size and forecast, by End Use
6.4. Asia-Pacific
6.4.1. Key market trends, growth factors and opportunities
6.4.2. Market size and forecast, by Product Type
6.4.3. Market size and forecast, by End Use
6.4.4. Market size and forecast, by country
6.4.4.1. China
6.4.4.1.1. Market size and forecast, by Product Type
6.4.4.1.2. Market size and forecast, by End Use
6.4.4.2. India
6.4.4.2.1. Market size and forecast, by Product Type
6.4.4.2.2. Market size and forecast, by End Use
6.4.4.3. Japan
6.4.4.3.1. Market size and forecast, by Product Type
6.4.4.3.2. Market size and forecast, by End Use
6.4.4.4. South Korea
6.4.4.4.1. Market size and forecast, by Product Type
6.4.4.4.2. Market size and forecast, by End Use
6.4.4.5. Australia
6.4.4.5.1. Market size and forecast, by Product Type
6.4.4.5.2. Market size and forecast, by End Use
6.4.4.6. Rest of Asia-Pacific
6.4.4.6.1. Market size and forecast, by Product Type
6.4.4.6.2. Market size and forecast, by End Use
6.5. LAMEA
6.5.1. Key market trends, growth factors and opportunities
6.5.2. Market size and forecast, by Product Type
6.5.3. Market size and forecast, by End Use
6.5.4. Market size and forecast, by country
6.5.4.1. Latin America
6.5.4.1.1. Market size and forecast, by Product Type
6.5.4.1.2. Market size and forecast, by End Use
6.5.4.2. Middle East
6.5.4.2.1. Market size and forecast, by Product Type
6.5.4.2.2. Market size and forecast, by End Use
6.5.4.3. Africa
6.5.4.3.1. Market size and forecast, by Product Type
6.5.4.3.2. Market size and forecast, by End Use
CHAPTER 7: COMPETITIVE LANDSCAPE
7.1. Introduction
7.2. Top winning strategies
7.3. Product mapping of top 10 player
7.4. Competitive dashboard
7.5. Competitive heatmap
7.6. Top player positioning, 2022
CHAPTER 8: COMPANY PROFILES
8.1. Alpha Technologies Services, Inc.
8.1.1. Company overview
8.1.2. Key executives
8.1.3. Company snapshot
8.1.4. Operating business segments
8.1.5. Product portfolio
8.2. TA Instruments
8.2.1. Company overview
8.2.2. Key executives
8.2.3. Company snapshot
8.2.4. Operating business segments
8.2.5. Product portfolio
8.2.6. Business performance
8.2.7. Key strategic moves and developments
8.3. U-Can Dynatex Inc.
8.3.1. Company overview
8.3.2. Key executives
8.3.3. Company snapshot
8.3.4. Operating business segments
8.3.5. Product portfolio
8.4. MonTech Rubber Testing Solutions
8.4.1. Company overview
8.4.2. Key executives
8.4.3. Company snapshot
8.4.4. Operating business segments
8.4.5. Product portfolio
8.4.6. Key strategic moves and developments
8.5. Goettfert Inc.
8.5.1. Company overview
8.5.2. Key executives
8.5.3. Company snapshot
8.5.4. Operating business segments
8.5.5. Product portfolio
8.6. Ektron Tek Co., Ltd.
8.6.1. Company overview
8.6.2. Key executives
8.6.3. Company snapshot
8.6.4. Operating business segments
8.6.5. Product portfolio
8.7. Illinois Tool Works Inc.
8.7.1. Company overview
8.7.2. Key executives
8.7.3. Company snapshot
8.7.4. Operating business segments
8.7.5. Product portfolio
8.7.6. Business performance
8.8. Norka Instruments
8.8.1. Company overview
8.8.2. Key executives
8.8.3. Company snapshot
8.8.4. Operating business segments
8.8.5. Product portfolio
8.9. Prescott Instruments Ltd.
8.9.1. Company overview
8.9.2. Key executives
8.9.3. Company snapshot
8.9.4. Operating business segments
8.9.5. Product portfolio
8.10. Qualitest Group, Inc.
8.10.1. Company overview
8.10.2. Key executives
8.10.3. Company snapshot
8.10.4. Operating business segments
8.10.5. Product portfolio
8.10.6. Key strategic moves and development
LIST OF TABLES
TABLE 01. GLOBAL RUBBER TESTING EQUIPMENT MARKET, BY PRODUCT TYPE, 2022-2032 ($BILLION)
TABLE 02. RUBBER TESTING EQUIPMENT MARKET FOR RUBBER PROCESS ANALYZERS, BY REGION, 2022-2032 ($BILLION)
TABLE 03. RUBBER TESTING EQUIPMENT MARKET FOR MOVING DIE RHEOMETER, BY REGION, 2022-2032 ($BILLION)
TABLE 04. RUBBER TESTING EQUIPMENT MARKET FOR MOONEY VISCOMETER, BY REGION, 2022-2032 ($BILLION)
TABLE 05. GLOBAL RUBBER TESTING EQUIPMENT MARKET, BY END USE, 2022-2032 ($BILLION)
TABLE 06. RUBBER TESTING EQUIPMENT MARKET FOR TIRES, BY REGION, 2022-2032 ($BILLION)
TABLE 07. RUBBER TESTING EQUIPMENT MARKET FOR GENERAL RUBBER GOODS, BY REGION, 2022-2032 ($BILLION)
TABLE 08. RUBBER TESTING EQUIPMENT MARKET FOR INDUSTRIAL RUBBER PRODUCTS, BY REGION, 2022-2032 ($BILLION)
TABLE 09. RUBBER TESTING EQUIPMENT MARKET FOR OTHERS, BY REGION, 2022-2032 ($BILLION)
TABLE 10. RUBBER TESTING EQUIPMENT MARKET, BY REGION, 2022-2032 ($BILLION)
TABLE 11. NORTH AMERICA RUBBER TESTING EQUIPMENT MARKET, BY PRODUCT TYPE, 2022-2032 ($BILLION)
TABLE 12. NORTH AMERICA RUBBER TESTING EQUIPMENT MARKET, BY END USE, 2022-2032 ($BILLION)
TABLE 13. NORTH AMERICA RUBBER TESTING EQUIPMENT MARKET, BY COUNTRY, 2022-2032 ($BILLION)
TABLE 14. U.S. RUBBER TESTING EQUIPMENT MARKET, BY PRODUCT TYPE, 2022-2032 ($BILLION)
TABLE 15. U.S. RUBBER TESTING EQUIPMENT MARKET, BY END USE, 2022-2032 ($BILLION)
TABLE 16. CANADA RUBBER TESTING EQUIPMENT MARKET, BY PRODUCT TYPE, 2022-2032 ($BILLION)
TABLE 17. CANADA RUBBER TESTING EQUIPMENT MARKET, BY END USE, 2022-2032 ($BILLION)
TABLE 18. MEXICO RUBBER TESTING EQUIPMENT MARKET, BY PRODUCT TYPE, 2022-2032 ($BILLION)
TABLE 19. MEXICO RUBBER TESTING EQUIPMENT MARKET, BY END USE, 2022-2032 ($BILLION)
TABLE 20. EUROPE RUBBER TESTING EQUIPMENT MARKET, BY PRODUCT TYPE, 2022-2032 ($BILLION)
TABLE 21. EUROPE RUBBER TESTING EQUIPMENT MARKET, BY END USE, 2022-2032 ($BILLION)
TABLE 22. EUROPE RUBBER TESTING EQUIPMENT MARKET, BY COUNTRY, 2022-2032 ($BILLION)
TABLE 23. UK RUBBER TESTING EQUIPMENT MARKET, BY PRODUCT TYPE, 2022-2032 ($BILLION)
TABLE 24. UK RUBBER TESTING EQUIPMENT MARKET, BY END USE, 2022-2032 ($BILLION)
TABLE 25. GERMANY RUBBER TESTING EQUIPMENT MARKET, BY PRODUCT TYPE, 2022-2032 ($BILLION)
TABLE 26. GERMANY RUBBER TESTING EQUIPMENT MARKET, BY END USE, 2022-2032 ($BILLION)
TABLE 27. FRANCE RUBBER TESTING EQUIPMENT MARKET, BY PRODUCT TYPE, 2022-2032 ($BILLION)
TABLE 28. FRANCE RUBBER TESTING EQUIPMENT MARKET, BY END USE, 2022-2032 ($BILLION)
TABLE 29. ITALY RUBBER TESTING EQUIPMENT MARKET, BY PRODUCT TYPE, 2022-2032 ($BILLION)
TABLE 30. ITALY RUBBER TESTING EQUIPMENT MARKET, BY END USE, 2022-2032 ($BILLION)
TABLE 31. REST OF EUROPE RUBBER TESTING EQUIPMENT MARKET, BY PRODUCT TYPE, 2022-2032 ($BILLION)
TABLE 32. REST OF EUROPE RUBBER TESTING EQUIPMENT MARKET, BY END USE, 2022-2032 ($BILLION)
TABLE 33. ASIA-PACIFIC RUBBER TESTING EQUIPMENT MARKET, BY PRODUCT TYPE, 2022-2032 ($BILLION)
TABLE 34. ASIA-PACIFIC RUBBER TESTING EQUIPMENT MARKET, BY END USE, 2022-2032 ($BILLION)
TABLE 35. ASIA-PACIFIC RUBBER TESTING EQUIPMENT MARKET, BY COUNTRY, 2022-2032 ($BILLION)
TABLE 36. CHINA RUBBER TESTING EQUIPMENT MARKET, BY PRODUCT TYPE, 2022-2032 ($BILLION)
TABLE 37. CHINA RUBBER TESTING EQUIPMENT MARKET, BY END USE, 2022-2032 ($BILLION)
TABLE 38. INDIA RUBBER TESTING EQUIPMENT MARKET, BY PRODUCT TYPE, 2022-2032 ($BILLION)
TABLE 39. INDIA RUBBER TESTING EQUIPMENT MARKET, BY END USE, 2022-2032 ($BILLION)
TABLE 40. JAPAN RUBBER TESTING EQUIPMENT MARKET, BY PRODUCT TYPE, 2022-2032 ($BILLION)
TABLE 41. JAPAN RUBBER TESTING EQUIPMENT MARKET, BY END USE, 2022-2032 ($BILLION)
TABLE 42. SOUTH KOREA RUBBER TESTING EQUIPMENT MARKET, BY PRODUCT TYPE, 2022-2032 ($BILLION)
TABLE 43. SOUTH KOREA RUBBER TESTING EQUIPMENT MARKET, BY END USE, 2022-2032 ($BILLION)
TABLE 44. AUSTRALIA RUBBER TESTING EQUIPMENT MARKET, BY PRODUCT TYPE, 2022-2032 ($BILLION)
TABLE 45. AUSTRALIA RUBBER TESTING EQUIPMENT MARKET, BY END USE, 2022-2032 ($BILLION)
TABLE 46. REST OF ASIA-PACIFIC RUBBER TESTING EQUIPMENT MARKET, BY PRODUCT TYPE, 2022-2032 ($BILLION)
TABLE 47. REST OF ASIA-PACIFIC RUBBER TESTING EQUIPMENT MARKET, BY END USE, 2022-2032 ($BILLION)
TABLE 48. LAMEA RUBBER TESTING EQUIPMENT MARKET, BY PRODUCT TYPE, 2022-2032 ($BILLION)
TABLE 49. LAMEA RUBBER TESTING EQUIPMENT MARKET, BY END USE, 2022-2032 ($BILLION)
TABLE 50. LAMEA RUBBER TESTING EQUIPMENT MARKET, BY COUNTRY, 2022-2032 ($BILLION)
TABLE 51. LATIN AMERICA RUBBER TESTING EQUIPMENT MARKET, BY PRODUCT TYPE, 2022-2032 ($BILLION)
TABLE 52. LATIN AMERICA RUBBER TESTING EQUIPMENT MARKET, BY END USE, 2022-2032 ($BILLION)
TABLE 53. MIDDLE EAST RUBBER TESTING EQUIPMENT MARKET, BY PRODUCT TYPE, 2022-2032 ($BILLION)
TABLE 54. MIDDLE EAST RUBBER TESTING EQUIPMENT MARKET, BY END USE, 2022-2032 ($BILLION)
TABLE 55. AFRICA RUBBER TESTING EQUIPMENT MARKET, BY PRODUCT TYPE, 2022-2032 ($BILLION)
TABLE 56. AFRICA RUBBER TESTING EQUIPMENT MARKET, BY END USE, 2022-2032 ($BILLION)
TABLE 57. ALPHA TECHNOLOGIES SERVICES, INC.: KEY EXECUTIVES
TABLE 58. ALPHA TECHNOLOGIES SERVICES, INC.: COMPANY SNAPSHOT
TABLE 59. ALPHA TECHNOLOGIES SERVICES, INC.: PRODUCT SEGMENTS
TABLE 60. ALPHA TECHNOLOGIES SERVICES, INC.: PRODUCT PORTFOLIO
TABLE 61. TA INSTRUMENTS: KEY EXECUTIVES
TABLE 62. TA INSTRUMENTS: COMPANY SNAPSHOT
TABLE 63. TA INSTRUMENTS: PRODUCT SEGMENTS
TABLE 64. TA INSTRUMENTS: PRODUCT PORTFOLIO
TABLE 65. TA INSTRUMENTS: KEY STRATERGIES
TABLE 66. U-CAN DYNATEX INC.: KEY EXECUTIVES
TABLE 67. U-CAN DYNATEX INC.: COMPANY SNAPSHOT
TABLE 68. U-CAN DYNATEX INC.: PRODUCT SEGMENTS
TABLE 69. U-CAN DYNATEX INC.: PRODUCT PORTFOLIO
TABLE 70. MONTECH RUBBER TESTING SOLUTIONS: KEY EXECUTIVES
TABLE 71. MONTECH RUBBER TESTING SOLUTIONS: COMPANY SNAPSHOT
TABLE 72. MONTECH RUBBER TESTING SOLUTIONS: PRODUCT SEGMENTS
TABLE 73. MONTECH RUBBER TESTING SOLUTIONS: PRODUCT PORTFOLIO
TABLE 74. MONTECH RUBBER TESTING SOLUTIONS: KEY STRATERGIES
TABLE 75. GOETTFERT INC.: KEY EXECUTIVES
TABLE 76. GOETTFERT INC.: COMPANY SNAPSHOT
TABLE 77. GOETTFERT INC.: PRODUCT SEGMENTS
TABLE 78. GOETTFERT INC.: PRODUCT PORTFOLIO
TABLE 79. EKTRON TEK CO., LTD.: KEY EXECUTIVES
TABLE 80. EKTRON TEK CO., LTD.: COMPANY SNAPSHOT
TABLE 81. EKTRON TEK CO., LTD.: PRODUCT SEGMENTS
TABLE 82. EKTRON TEK CO., LTD.: PRODUCT PORTFOLIO
TABLE 83. ILLINOIS TOOL WORKS INC.: KEY EXECUTIVES
TABLE 84. ILLINOIS TOOL WORKS INC.: COMPANY SNAPSHOT
TABLE 85. ILLINOIS TOOL WORKS INC.: PRODUCT SEGMENTS
TABLE 86. ILLINOIS TOOL WORKS INC.: PRODUCT PORTFOLIO
TABLE 87. NORKA INSTRUMENTS: KEY EXECUTIVES
TABLE 88. NORKA INSTRUMENTS: COMPANY SNAPSHOT
TABLE 89. NORKA INSTRUMENTS: PRODUCT SEGMENTS
TABLE 90. NORKA INSTRUMENTS: PRODUCT PORTFOLIO
TABLE 91. PRESCOTT INSTRUMENTS LTD.: KEY EXECUTIVES
TABLE 92. PRESCOTT INSTRUMENTS LTD.: COMPANY SNAPSHOT
TABLE 93. PRESCOTT INSTRUMENTS LTD.: PRODUCT SEGMENTS
TABLE 94. PRESCOTT INSTRUMENTS LTD.: PRODUCT PORTFOLIO
TABLE 95. QUALITEST GROUP, INC.: KEY EXECUTIVES
TABLE 96. QUALITEST GROUP, INC.: COMPANY SNAPSHOT
TABLE 97. QUALITEST GROUP, INC.: PRODUCT SEGMENTS
TABLE 98. QUALITEST GROUP, INC.: PRODUCT PORTFOLIO
TABLE 99. QUALITEST GROUP, INC.: KEY STRATERGIES LIST OF FIGURES
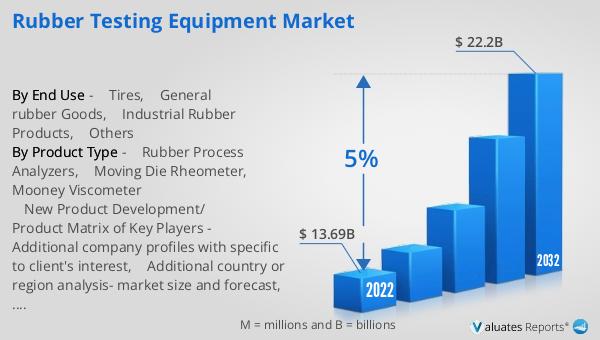
FIGURE 01. RUBBER TESTING EQUIPMENT MARKET, 2022-2032
FIGURE 02. SEGMENTATION OF RUBBER TESTING EQUIPMENT MARKET,2022-2032
FIGURE 03. TOP IMPACTING FACTORS IN RUBBER TESTING EQUIPMENT MARKET
FIGURE 04. TOP INVESTMENT POCKETS IN RUBBER TESTING EQUIPMENT MARKET (2023-2032)
FIGURE 05. LOW TO HIGH BARGAINING POWER OF SUPPLIERS
FIGURE 06. LOW TO HIGH THREAT OF NEW ENTRANTS
FIGURE 07. LOW TO MODERATE THREAT OF SUBSTITUTES
FIGURE 08. LOW TO MODERATE INTENSITY OF RIVALRY
FIGURE 09. LOW TO HIGH BARGAINING POWER OF BUYERS
FIGURE 10. GLOBAL RUBBER TESTING EQUIPMENT MARKET:DRIVERS, RESTRAINTS AND OPPORTUNITIES
FIGURE 11. RUBBER TESTING EQUIPMENT MARKET, BY PRODUCT TYPE, 2022 AND 2032(%)
FIGURE 12. COMPARATIVE SHARE ANALYSIS OF RUBBER TESTING EQUIPMENT MARKET FOR RUBBER PROCESS ANALYZERS, BY COUNTRY 2022 AND 2032(%)
FIGURE 13. COMPARATIVE SHARE ANALYSIS OF RUBBER TESTING EQUIPMENT MARKET FOR MOVING DIE RHEOMETER, BY COUNTRY 2022 AND 2032(%)
FIGURE 14. COMPARATIVE SHARE ANALYSIS OF RUBBER TESTING EQUIPMENT MARKET FOR MOONEY VISCOMETER, BY COUNTRY 2022 AND 2032(%)
FIGURE 15. RUBBER TESTING EQUIPMENT MARKET, BY END USE, 2022 AND 2032(%)
FIGURE 16. COMPARATIVE SHARE ANALYSIS OF RUBBER TESTING EQUIPMENT MARKET FOR TIRES, BY COUNTRY 2022 AND 2032(%)
FIGURE 17. COMPARATIVE SHARE ANALYSIS OF RUBBER TESTING EQUIPMENT MARKET FOR GENERAL RUBBER GOODS, BY COUNTRY 2022 AND 2032(%)
FIGURE 18. COMPARATIVE SHARE ANALYSIS OF RUBBER TESTING EQUIPMENT MARKET FOR INDUSTRIAL RUBBER PRODUCTS, BY COUNTRY 2022 AND 2032(%)
FIGURE 19. COMPARATIVE SHARE ANALYSIS OF RUBBER TESTING EQUIPMENT MARKET FOR OTHERS, BY COUNTRY 2022 AND 2032(%)
FIGURE 20. RUBBER TESTING EQUIPMENT MARKET BY REGION, 2022 AND 2032(%)
FIGURE 21. U.S. RUBBER TESTING EQUIPMENT MARKET, 2022-2032 ($BILLION)
FIGURE 22. CANADA RUBBER TESTING EQUIPMENT MARKET, 2022-2032 ($BILLION)
FIGURE 23. MEXICO RUBBER TESTING EQUIPMENT MARKET, 2022-2032 ($BILLION)
FIGURE 24. UK RUBBER TESTING EQUIPMENT MARKET, 2022-2032 ($BILLION)
FIGURE 25. GERMANY RUBBER TESTING EQUIPMENT MARKET, 2022-2032 ($BILLION)
FIGURE 26. FRANCE RUBBER TESTING EQUIPMENT MARKET, 2022-2032 ($BILLION)
FIGURE 27. ITALY RUBBER TESTING EQUIPMENT MARKET, 2022-2032 ($BILLION)
FIGURE 28. REST OF EUROPE RUBBER TESTING EQUIPMENT MARKET, 2022-2032 ($BILLION)
FIGURE 29. CHINA RUBBER TESTING EQUIPMENT MARKET, 2022-2032 ($BILLION)
FIGURE 30. INDIA RUBBER TESTING EQUIPMENT MARKET, 2022-2032 ($BILLION)
FIGURE 31. JAPAN RUBBER TESTING EQUIPMENT MARKET, 2022-2032 ($BILLION)
FIGURE 32. SOUTH KOREA RUBBER TESTING EQUIPMENT MARKET, 2022-2032 ($BILLION)
FIGURE 33. AUSTRALIA RUBBER TESTING EQUIPMENT MARKET, 2022-2032 ($BILLION)
FIGURE 34. REST OF ASIA-PACIFIC RUBBER TESTING EQUIPMENT MARKET, 2022-2032 ($BILLION)
FIGURE 35. LATIN AMERICA RUBBER TESTING EQUIPMENT MARKET, 2022-2032 ($BILLION)
FIGURE 36. MIDDLE EAST RUBBER TESTING EQUIPMENT MARKET, 2022-2032 ($BILLION)
FIGURE 37. AFRICA RUBBER TESTING EQUIPMENT MARKET, 2022-2032 ($BILLION)
FIGURE 38. TOP WINNING STRATEGIES, BY YEAR (2020-2023)
FIGURE 39. TOP WINNING STRATEGIES, BY DEVELOPMENT (2020-2023)
FIGURE 40. TOP WINNING STRATEGIES, BY COMPANY (2020-2023)
FIGURE 41. PRODUCT MAPPING OF TOP 10 PLAYERS
FIGURE 42. COMPETITIVE DASHBOARD
FIGURE 43. COMPETITIVE HEATMAP: RUBBER TESTING EQUIPMENT MARKET
FIGURE 44. TOP PLAYER POSITIONING, 2022
FIGURE 45. TA INSTRUMENTS: NET REVENUE, 2020-2022 ($MILLION)
FIGURE 46. TA INSTRUMENTS: RESEARCH & DEVELOPMENT EXPENDITURE, 2020-2022 ($MILLION)
FIGURE 47. ILLINOIS TOOL WORKS INC.: NET REVENUE, 2019-2021 ($BILLION)
FIGURE 48. ILLINOIS TOOL WORKS INC.: REVENUE SHARE BY SEGMENT, 2021 (%)
FIGURE 49. ILLINOIS TOOL WORKS INC.: REVENUE SHARE BY REGION, 2021 (%
SELECT A FORMAT
Added to Cart
Electronic (PDF)

$5730

This license allows only one user to access the PDF.
Electronic (PDF)

$6450

This license allows 1 - 5 user to access the PDF, license is suitable for small groups of 5 users working together
Electronic (PDF)

$9600

This license allows users/teams in a same Enterprise to use this report, various departments within an enterpise can use this report
Electronic (PDF)

$3840

This license just provides quantitative data in a excel sheet
Add to Cart
Buy Now (15% Discount)

OUR CUSTOMER

SecuX Technology Inc

SIMILAR REPORTS


RELATED REPORTS

Global Reducer Elbows Market Research Report 2025

120 Pages
Type: Report
Code: QYRE-Auto-35L19946
Wed Dec 03 00:00:00 UTC 2025

Add to Cart

Global High-Pressure Breathing Air Compressor for Diving and Firefighting Applications Market Research Report 2025

120 Pages
Type: Report
Code: QYRE-Auto-2K20269
Wed Dec 03 00:00:00 UTC 2025

Add to Cart

Global Steam Trap Valve Market Research Report 2025

120 Pages
Type: Report
Code: QYRE-Auto-37H9442
Wed Dec 03 00:00:00 UTC 2025

Add to Cart

Global Consumer-grade IP Robots Market Research Report 2025

120 Pages
Type: Report
Code: QYRE-Auto-21L19992
Wed Dec 03 00:00:00 UTC 2025

Add to Cart