0
U.S. (TOLL FREE)
+1 (315) 215-3225
Automative

0
U.S. (TOLL FREE)
+1 (315) 215-3225
Crop Insurance Market by Coverage (Multi-peril Crop Insurance [MPCI] and Crop-hail Insurance) and Distribution Channel (Banks, Insurance Companies, Brokers/Agents, and Other): Global Opportunity Analysis and Industry Forecast, 2020–2027
Published Date: August 2020
|
Report Code: ALLI-Auto-3B413
Home | Market Reports | Finance| Insurance
Crop Insurance Market by Coverage Multi peril Crop Insurance MPCI and Crop hail Insurance and Distribution Channel Banks Insurance Companies Brokers Agents and Other Global Opportunity Analysis and Industry Forecast 2020 2027
BUY CHAPTERS

Crop Insurance Market by Coverage (Multi-peril Crop Insurance [MPCI] and Crop-hail Insurance) and Distribution Channel (Banks, Insurance Companies, Brokers/Agents, and Other): Global Opportunity Analysis and Industry Forecast, 2020–2027

Code: ALLI-Auto-3B413
Report
August 2020
Pages:214
Allied Market Research
Buy Now with 15% Discount
DESCRIPTION
TABLE OF CONTENT
TABLES & FIGURES

Crop Insurance Market 

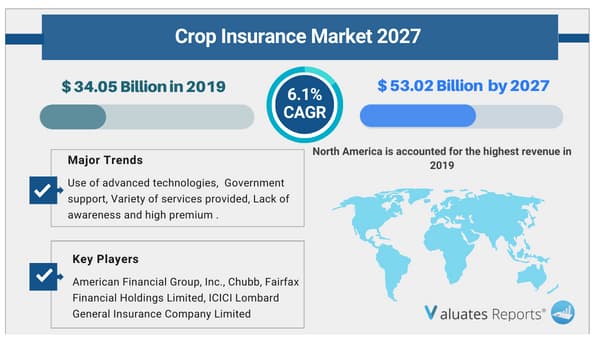
The global crop insurance market size was valued at USD 34.05 Billion in 2019, and is projected to reach USD 53.02 Billion by 2027, growing at a CAGR of 6.1% from 2020 to 2027. Key drivers of the crop insurance market include the rise in digital initiatives and technological innovations.

Crop insurance market

The favorable government support and subsidies will fuel the growth of the crop insurance market during the forecast period. The launching of several crop insurance product lines and coverage of multiple agricultural stakeholders will drive the growth of the market in the coming years.

Trends Influencing the Global Crop Insurance Market 

Use of advanced technologies

The large-scale adoption of satellites, drones, artificial intelligence, IoT, mobile applications, and web-based platforms is helping farmers to detect diseased crops, predict weather patterns, and store data related to land size, and shape for harvesting crops. Cloud integrated analytics provide real-time accurate estimates of crop distribution, yield, and actual photographic evidence. Historical data can be accessed for risk measurement and insurance calculation. Farmers are onboarded for providing climate-specific crop information so that companies can customize their insurance products for small landholders. Remote sensing capabilities provide input-based loss identification streamlining the claims payout process. Satellite imagery can exactly pinpoint the entire crop health status, productivity, and moisture levels. It narrows down field inspections by assigning detailed GPS coordinates. Moreover, companies can monitor the air temperature beforehand to predict upcoming threats and measure the validity of claims in case of any yield loss. Farmers can provide this data as evidence for compensation. The data of entire agricultural operations are integrated onto a single platform for enhanced visibility and transparency. These factors will boost the growth of the crop insurance market during the forecast period. 

Government support

Several government authorities have initiated schemes and incentives to protect farmers from fluctuations in revenue, pricing, and yields. Subsidized funding enables them to avail crop insurance products at cheaper rates. As risks related to climate change increase, there is a greater need for building a resilient financial and insurance ecosystem. Public organizations take up partial risk guarantees on behalf of small landowners. Regulatory interventions are being undertaken to improve the financial services of the agricultural industry by introducing lending quotas, interest rate caps, and dispute mechanisms for contract farming. Moreover, several organizations are collaborating for building innovative insurance products and premium subsidies. For instance, Global Index Insurance Facility and Disaster Risk Finance and Insurance program have initiated partnerships to work on several insurance projects. These factors will boost the growth of the crop insurance market during the forecast period. 

Variety of services provided

Agriculture is exposed to a range of problems like droughts, floods, weeds, plant diseases, and locust attacks. The majority of the population engaged in farming are small landowners. Their income gets reduced drastically whenever any natural calamity strikes their crops. Hence insurance providers are integrating with banking companies to launch extensive insurance products in order to strengthen the functioning of all related stakeholders. The benefits accrued are farmers get protection against climactic losses. The economic protection leads them to adopt the latest farming practices for improving yield. Cooperatives and other agricultural institutions are able to increase their lending capacity. The government expenditure on several relief initiatives is reduced to some extent. Moreover, insurance companies provide a highly effective anti-inflationary measure by securing agricultural assets in rural areas. Such factors will boost the growth of the crop insurance market in the coming years. 

Lack of awareness and high premium 

In spite of all the solutions offered by crop insurance, it suffers from certain issues. Farmers are generally not equipped with the complex terminologies and technical know-how of premium payment and claim settlement process. If they get caught up in an enormous cycle of debt and are unable to repay their agricultural loan the insurance ceases to exist as it is linked to their loan-taking capacity. Furthermore, small farmers with very little income have to pay high premiums which ultimately creates a financial burden. Fraudulent claims involving the nexus of large farmers, bank officials, and government employees ruin the novel intention behind insurance coverage. This is expected to deter the growth of the crop insurance market in the forthcoming years. 

Crop Insurance Market Share

Based on coverage, the multiple peril crop insurance segment is expected to dominate in the crop insurance market share due to the huge demand for multiple and customized crop insurance needs. 

Based on the distribution channel, the insurance companies segment is expected to witness considerable growth in the crop insurance market share.

Based on region, North America will dominate in the crop insurance market share due to rapid technological innovations, increasing awareness levels of crop insurance policies, and favorable government regulations. While Asia-Pacific will grow the fastest due to its huge population base and rising demand for food security. 

  • By Coverage

    • Multi-peril Crop Insurance (MPCI)
    • Crop-hail Insurance
  • By Distribution Channel

    • Banks
    • Insurance Companies
    • Brokers/Agents
    • Others
  • By Region

    • North America
      • U.S.
      • Canada
    • Europe
      • Spain
      • Germany
      • France
      • Italy
      • Russia
      • Netherlands
      • Rest of Europe
    • Asia-Pacific
      • China
      • India
      • Japan
      • Australia
      • South Korea
      • Rest of Asia-Pacific
    • LAMEA
      • Latin America
      • Middle East
      • Africa

Key Market Players

  • Agriculture Insurance Company of India Limited (AIC)
  • American Financial Group, Inc.
  • Chubb
  • Fairfax Financial Holdings Limited
  • ICICI Lombard General Insurance Company Limited
  • PICC
  • QBE Insurance Group Limited
  • Sompo International Holdings Ltd.
  • Tokio Marine HCC
  • Zurich

Scope of Crop Insurance Market Report

Report Metric

Details

Report Name

Crop Insurance  Market

Market size value in 2019

USD 34.05 Billion

Revenue forecast in 2027

USD 53.02 Billion

Growth Rate

CAGR of 6.1%

Base year considered

2019

Forecast Period

2020-2027

By Coverage

Multi-peril Crop Insurance [MPCI] and Crop-hail Insurance

By Distribution Channel

Banks, Insurance Companies, Brokers/Agents

Report Coverage

Revenue & volume forecast, company share, competitive landscape, growth factors, and trends

Segments Covered

By Type, Application, and Region

Geographic Regions Covered

North America, Europe, Asia Pacific, Latin America, Middle East & Africa

Frequently Asked Questions About This Report 

1. How big is the Crop Insurance Market?

Ans. The global crop insurance market size was valued at $34.05 billion in 2019, and is projected to reach $53.02 billion by 2027, growing at a CAGR of 6.1% from 2020 to 2027.

2. Who are the key players available in the Crop Insurance Industry?

Ans. The report analyses the profiles of key players operating in the market, which include Agriculture Insurance Company of India Limited (AIC), American Financial Group, Inc., Chubb, Fairfax Financial Holdings Limited

3. Does the report provides covid-19 impact analysis?

Ans. Yes, the report includes a COVID-19 impact analysis. Also, it is further extended into every individual segment of the report.

CHAPTER 1:INTRODUCTION
1.1.Report description
1.2.Key benefits for stakeholders
1.3.Key market segments
1.4.Research methodology
1.4.1.Secondary research
1.4.2.Primary research
1.4.3.Analyst tools & models
CHAPTER 2:EXECUTIVE SUMMARY
2.1.Key findings
2.1.1.Top impacting factors
2.1.2.Top investment pockets
2.2.CXO perspective
CHAPTER 3:MARKET OVERVIEW
3.1.Market definition and scope
3.2.Key Forces Shaping Crop Insurance Market
3.2.1.Low bargaining power of suppliers
3.2.2.High bargaining power of buyer
3.2.3.Moderate threat of substitutes
3.2.4.Moderate threat of new entrants
3.2.5.High competitive rivalry
3.3.Market dynamics
3.3.1.Drivers
3.3.1.1.Increased digital initiatives in crop insurance
3.3.1.2.Rise in government support in the form of subsidies
3.3.2.Restraint
3.3.2.1.Low awareness of insurance & high cost of premiums
3.3.3.Opportunities
3.3.3.1.Expansion of products and services
3.3.3.2.Untapped potential of emerging economies
3.1.COVID-19 impact analysis on crop insurance market
3.1.1.Impact on crop insurance market size
3.1.2.Change in farmers trends, preferences, and budget impact due to COVID-19
3.1.3.Framework for solving market challenges faced by crop insurance providers and policy adopters
3.1.4.Economic impact on crop insurers
3.1.5.Key player strategies to tackle negative impact in the industry
3.1.6.Opportunity analysis for crop insurance policy providers
CHAPTER 4:CROP INSURANCE MARKET, BY COVERAGE
4.1.Overview
4.2.Multiple Peril Crop Insurance (MPCI)
4.2.1.Key market trends, growth factors, and opportunities
4.2.2.Market size and forecast, by region
4.2.3.Market analysis, by country
4.3.Crop-hail Insurance
4.3.1.Key market trends, growth factors, and opportunities
4.3.2.Market size and forecast, by region
4.3.3.Market analysis by country
CHAPTER 5:CROP INSURANCE MARKET, BY DISTRIBUTION CHANNEL
5.1.Overview
5.2.Banks
5.2.1.Key market trends, growth factors and opportunities
5.2.2.Market size and forecast, by region
5.2.3.Market analysis, by country
5.3.Insurance Companies
5.3.1.Key market trends, growth factors and opportunities
5.3.2.Market size and forecast, by region
5.3.3.Market analysis, by country
5.4.Brokers/Agents
5.4.1.Key market trends, growth factors and opportunities
5.4.2.Market size and forecast, by region
5.4.3.Market analysis, by country
5.5.Others
5.5.1.Key market trends, growth factors and opportunities
5.5.2.Market size and forecast, by region
5.5.3.Market analysis, by country
CHAPTER 6:CROP INSURANCE MARKET, BY REGION
6.1.Overview
6.1.1.Market size and forecast, by region
6.2.North America
6.2.1.Key market trends, growth factors, and opportunities
6.2.2.Market size and forecast, by coverage
6.2.3.Market size and forecast, by distribution channel
6.2.4.Market analysis, by country
6.2.4.1.U.S.
6.2.4.1.1.Market size and forecast, by coverage
6.2.4.1.2.Market size and forecast, by distribution channel
6.2.4.2.Canada
6.2.4.2.1.Market size and forecast, by coverage
6.2.4.2.2.Market size and forecast, by distribution channel
6.3.Europe
6.3.1.Key market trends, growth factors and opportunities
6.3.2.Market size and forecast, by coverage
6.3.3.Market size and forecast, by distribution channel
6.3.4.Market analysis, by country
6.3.4.1.Spain
6.3.4.1.1.Market size and forecast, by coverage
6.3.4.1.2.Market size and forecast, by distribution channel
6.3.4.2.Germany
6.3.4.2.1.Market size and forecast, by coverage
6.3.4.2.2.Market size and forecast, by distribution channel
6.3.4.3.France
6.3.4.3.1.Market size and forecast, by coverage
6.3.4.3.2.Market size and forecast, by distribution channel
6.3.4.4.Italy
6.3.4.4.1.Market size and forecast, by coverage
6.3.4.4.2.Market size and forecast, by distribution channel
6.3.4.5.Russia
6.3.4.5.1.Market size and forecast, by coverage
6.3.4.5.2.Market size and forecast, by distribution channel
6.3.4.6.Netherlands
6.3.4.6.1.Market size and forecast, by coverage
6.3.4.6.2.Market size and forecast, by distribution channel
6.3.4.7.Rest of Europe
6.3.4.7.1.Market size and forecast, by coverage
6.3.4.7.2.Market size and forecast, by distribution channel
6.4.Asia-Pacific
6.4.1.Key market trends, growth factors and opportunities
6.4.2.Market size and forecast, by coverage
6.4.3.Market size and forecast, by distribution channel
6.4.4.Market analysis, by country
6.4.4.1.China
6.4.4.1.1.Market size and forecast, by coverage
6.4.4.1.2.Market size and forecast, by distribution channel
6.4.4.2.India
6.4.4.2.1.Market size and forecast, by coverage
6.4.4.2.2.Market size and forecast, by distribution channel
6.4.4.3.Japan
6.4.4.3.1.Market size and forecast, by coverage
6.4.4.3.2.Market size and forecast, by distribution channel
6.4.4.4.Australia
6.4.4.4.1.Market size and forecast, by coverage
6.4.4.4.2.Market size and forecast, by distribution channel
6.4.4.5.South Korea
6.4.4.5.1.Market size and forecast, by coverage
6.4.4.5.2.Market size and forecast, by distribution channel
6.4.4.6.Rest of Asia-Pacific
6.4.4.6.1.Market size and forecast, by coverage
6.4.4.6.2.Market size and forecast, by distribution channel
6.5.LAMEA
6.5.1.Key market trends, growth factors and opportunities
6.5.2.Market size and forecast, by coverage
6.5.3.Market size and forecast, by distribution channel
6.5.4.Market analysis, by country
6.5.4.1.Latin America
6.5.4.1.1.Market size and forecast, by coverage
6.5.4.1.2.Market size and forecast, by distribution channel
6.5.4.2.Middle East
6.5.4.2.1.Market size and forecast, by coverage
6.5.4.2.2.Market size and forecast, by distribution channel
6.5.4.3.Africa
6.5.4.3.1.Market size and forecast, by coverage
6.5.4.3.2.Market size and forecast, by distribution channel
CHAPTER 7:COMPETITIVE LANDSCAPE
7.1.Introduction
7.1.1.Market player positioning, 2019
7.1.2.Top winning strategies
CHAPTER 8:COMPANY PROFILES
8.1.Agriculture Insurance Company of India Limited (AIC)
8.1.1.Company overview
8.1.2.Key executive
8.1.3.Company snapshot
8.1.4.Product portfolio
8.1.5.Business performance
8.2.American Financial Group, Inc.
8.2.1.Company overview
8.2.2.Key executive
8.2.3.Company snapshot
8.2.4.Product portfolio
8.3.Chubb
8.3.1.Company overview
8.3.2.Key executive
8.3.3.Company snapshot
8.3.4.Operating business segments
8.3.5.Product portfolio
8.3.6.Business performance
8.4.Fairfax Financial Holdings Limited
8.4.1.Company overview
8.4.2.Key executive
8.4.3.Company snapshot
8.4.4.Operating business segments
8.4.5.Product portfolio
8.4.6.Business performance
8.4.1.Key strategic moves and developments
8.5.ICICI Lombard General Insurance Company Limited
8.5.1.Company overview
8.5.2.Key executive
8.5.3.Company snapshot
8.5.4.Product portfolio
8.5.5.Business performance
8.6.PICC
8.6.1.Company overview
8.6.2.Key executive
8.6.3.Company snapshot
8.6.4.Product portfolio
8.7.QBE Insurance Group Limited
8.7.1.Company overview
8.7.2.Key executive
8.7.3.Company snapshot
8.7.4.Product portfolio
8.7.5.Business performance
8.7.6.Key strategic moves and developments
8.8.Sompo International Holdings Ltd.
8.8.1.Company overview
8.8.2.Key executive
8.8.3.Company snapshot
8.8.4.Product portfolio
8.8.5.Business performance
8.8.1.Key strategic moves and developments
8.9.Tokio Marine HCC
8.9.1.Company overview
8.9.2.Key executive
8.9.3.Company snapshot
8.9.4.Product portfolio
8.10.Zurich
8.10.1.Company overview
8.10.2.Key executive
8.10.3.Company snapshot
8.10.4.Product portfolio
8.10.5.Business performance
            8.10.6.Key strategic moves and development
LIST OF TABLES

TABLE 01.CROP INSURANCE MARKET REVENUE, BY COVERAGE, 2019–2027 ($MILLION)
TABLE 02.CROP INSURANCE MARKET REVENUE FOR MULTIPLE PERIL CROP INSURANCE (MPCI), BY REGION, 2019–2027 ($MILLION)
TABLE 03.CROP INSURANCE MARKET REVENUE FOR CROP-HAIL INSURANCE, BY REGION, 2019–2027 ($MILLION)
TABLE 04.CROP INSURANCE MARKET REVENUE, BY DISTRIBUTION CHANNEL, 2019-2027 ($MILLION)
TABLE 05.CROP INSURANCE MARKET REVENUE FOR BANKS, BY REGION, 2019–2027 ($MILLION)
TABLE 06.CROP INSURANCE MARKET REVENUE FOR INSURANCE COMPANIES, BY REGION, 2019–2027 ($MILLION)
TABLE 07.CROP INSURANCE MARKET REVENUE FOR BROKERS/AGENTS, BY REGION, 2019–2027 ($MILLION)
TABLE 08.CROP INSURANCE MARKET REVENUE FOR OTHERS, BY REGION, 2019–2027 ($MILLION)
TABLE 09.CROP INSURANCE MARKET REVENUE, BY REGION, 2019–2027 ($MILLION)
TABLE 10.NORTH AMERICA CROP INSURANCE MARKET REVENUE, BY COVERAGE, 2019–2027 ($MILLION)
TABLE 11.NORTH AMERICA CROP INSURANCE MARKET REVENUE, BY DISTRIBUTION CHANNEL, 2019–2027 ($MILLION)
TABLE 12.NORTH AMERICA CROP INSURANCE MARKET REVENUE, BY COUNTRY, 2019–2027 ($MILLION)
TABLE 13.U.S. CROP INSURANCE MARKET REVENUE, BY COVERAGE, 2019–2027 ($MILLION)
TABLE 14.U.S. CROP INSURANCE MARKET REVENUE, BY DISTRIBUTION CHANNEL, 2019–2027 ($MILLION)
TABLE 15.CANADA CROP INSURANCE MARKET REVENUE, BY COVERAGE, 2019–2027 ($MILLION)
TABLE 16.CANADA CROP INSURANCE MARKET REVENUE, BY DISTRIBUTION CHANNEL, 2019–2027 ($MILLION)
TABLE 17.EUROPE CROP INSURANCE MARKET REVENUE, BY COVERAGE, 2019–2027 ($MILLION)
TABLE 18.EUROPE CROP INSURANCE MARKET REVENUE, BY DISTRIBUTION CHANNEL, 2019–2027 ($MILLION)
TABLE 19.EUROPE CROP INSURANCE MARKET REVENUE, BY COUNTRY, 2019–2027 ($MILLION)
TABLE 20.SPAIN CROP INSURANCE MARKET REVENUE, BY COVERAGE, 2019–2027 ($MILLION)
TABLE 21.SPAIN CROP INSURANCE MARKET REVENUE, BY DISTRIBUTION CHANNEL, 2019–2027 ($MILLION)
TABLE 22.GERMANY CROP INSURANCE MARKET REVENUE, BY COVERAGE, 2019–2027 ($MILLION)
TABLE 23.GERMANY CROP INSURANCE MARKET REVENUE, BY DISTRIBUTION CHANNEL, 2019–2027 ($MILLION)
TABLE 24.FRANCE CROP INSURANCE MARKET REVENUE, BY COVERAGE, 2019–2027 ($MILLION)
TABLE 25.FRANCE CROP INSURANCE MARKET REVENUE, BY DISTRIBUTION CHANNEL, 2019–2027 ($MILLION)
TABLE 26.ITALY CROP INSURANCE MARKET REVENUE, BY COVERAGE, 2019–2027 ($MILLION)
TABLE 27.ITALY CROP INSURANCE MARKET REVENUE, BY DISTRIBUTION CHANNEL, 2019–2027 ($MILLION)
TABLE 28.RUSSIA CROP INSURANCE MARKET REVENUE, BY COVERAGE, 2019–2027 ($MILLION)
TABLE 29.RUSSIA CROP INSURANCE MARKET REVENUE, BY DISTRIBUTION CHANNEL, 2019–2027 ($MILLION)
TABLE 30.NETHERLANDS CROP INSURANCE MARKET REVENUE, BY COVERAGE, 2019–2027 ($MILLION)
TABLE 31.NETHERLANDS CROP INSURANCE MARKET REVENUE, BY DISTRIBUTION CHANNEL, 2019–2027 ($MILLION)
TABLE 32.REST OF EUROPE CROP INSURANCE MARKET REVENUE, BY COVERAGE, 2019–2027 ($MILLION)
TABLE 33.REST OF EUROPE CROP INSURANCE MARKET REVENUE, BY DISTRIBUTION CHANNEL, 2019–2027 ($MILLION)
TABLE 34.ASIA-PACIFIC CROP INSURANCE MARKET REVENUE, BY COVERAGE, 2019–2027 ($MILLION)
TABLE 35.ASIA-PACIFIC CROP INSURANCE MARKET REVENUE, BY DISTRIBUTION CHANNEL, 2019–2027 ($MILLION)
TABLE 36.ASIA-PACIFIC CROP INSURANCE MARKET REVENUE, BY COUNTRY, 2019–2027 ($MILLION)
TABLE 37.CHINA CROP INSURANCE MARKET REVENUE, BY COVERAGE, 2019–2027 ($MILLION)
TABLE 38.CHINA CROP INSURANCE MARKET REVENUE, BY DISTRIBUTION CHANNEL, 2019–2027 ($MILLION)
TABLE 39.INDIA CROP INSURANCE MARKET REVENUE, BY COVERAGE, 2019–2027 ($MILLION)
TABLE 40.INDIA CROP INSURANCE MARKET REVENUE, BY DISTRIBUTION CHANNEL, 2019–2027 ($MILLION)
TABLE 41.JAPAN CROP INSURANCE MARKET REVENUE, BY COVERAGE, 2019–2027 ($MILLION)
TABLE 42.JAPAN CROP INSURANCE MARKET REVENUE, BY DISTRIBUTION CHANNEL, 2019–2027 ($MILLION)
TABLE 43.AUSTRALIA CROP INSURANCE MARKET REVENUE, BY COVERAGE, 2019–2027 ($MILLION)
TABLE 44.AUSTRALIA CROP INSURANCE MARKET REVENUE, BY DISTRIBUTION CHANNEL, 2019–2027 ($MILLION)
TABLE 45.SOUTH KOREA CROP INSURANCE MARKET REVENUE, BY COVERAGE, 2019–2027 ($MILLION)
TABLE 46.SOUTH KOREA CROP INSURANCE MARKET REVENUE, BY DISTRIBUTION CHANNEL, 2019–2027 ($MILLION)
TABLE 47.REST OF ASIA-PACIFIC CROP INSURANCE MARKET REVENUE, BY COVERAGE, 2019–2027 ($MILLION)
TABLE 48.REST OF ASIA-PACIFIC CROP INSURANCE MARKET REVENUE, BY DISTRIBUTION CHANNEL, 2019–2027 ($MILLION)
TABLE 49.LAMEA CROP INSURANCE MARKET REVENUE, BY COVERAGE, 2019–2027 ($MILLION)
TABLE 50.LAMEA CROP INSURANCE MARKET REVENUE, BY DISTRIBUTION CHANNEL, 2019–2027 ($MILLION)
TABLE 51.LAMEA CROP INSURANCE MARKET REVENUE, BY COUNTRY, 2019–2027 ($MILLION)
TABLE 52.LATIN AMERICA CROP INSURANCE MARKET REVENUE, BY COVERAGE, 2019–2027 ($MILLION)
TABLE 53.LATIN AMERICA CROP INSURANCE MARKET REVENUE, BY DISTRIBUTION CHANNEL, 2019–2027 ($MILLION)
TABLE 54.MIDDLE EAST CROP INSURANCE MARKET REVENUE, BY COVERAGE, 2019–2027 ($MILLION)
TABLE 55.MIDDLE EAST CROP INSURANCE MARKET REVENUE, BY DISTRIBUTION CHANNEL, 2019–2027 ($MILLION)
TABLE 56.AFRICA CROP INSURANCE MARKET REVENUE, BY COVERAGE, 2019–2027 ($MILLION)
TABLE 57.AFRICA CROP INSURANCE MARKET REVENUE, BY DISTRIBUTION CHANNEL, 2019–2027 ($MILLION)
TABLE 58.AGRICULTURE INSURANCE COMPANY OF INDIA LIMITED (AIC): KEY EXECUTIVE
TABLE 59.AGRICULTURE INSURANCE COMPANY OF INDIA LIMITED (AIC): COMPANY SNAPSHOT
TABLE 60.AGRICULTURE INSURANCE COMPANY OF INDIA LIMITED (AIC): PRODUCT PORTFOLIO
TABLE 61.AMERICAN FINANCIAL GROUP, INC.: KEY EXECUTIVE
TABLE 62.AMERICAN FINANCIAL GROUP, INC.: COMPANY SNAPSHOT
TABLE 63.AMERICAN FINANCIAL GROUP, INC.: PRODUCT PORTFOLIO
TABLE 64.CHUBB: KEY EXECUTIVE
TABLE 65.CHUBB: COMPANY SNAPSHOT
TABLE 66.CHUBB: OPERATING SEGMENTS
TABLE 67.CHUBB: PRODUCT PORTFOLIO
TABLE 68.FAIRFAX FINANCIAL HOLDINGS LIMITED: KEY EXECUTIVE
TABLE 69.FAIRFAX FINANCIAL HOLDINGS LIMITED: COMPANY SNAPSHOT
TABLE 70.FAIRFAX FINANCIAL HOLDINGS LIMITED: OPERATING SEGMENTS
TABLE 71.FAIRFAX FINANCIAL HOLDINGS LIMITED: PRODUCT PORTFOLIO
TABLE 72.ICICI LOMBARD GENERAL INSURANCE COMPANY LIMITED: KEY EXECUTIVE
TABLE 73.ICICI LOMBARD GENERAL INSURANCE COMPANY LIMITED: COMPANY SNAPSHOT
TABLE 74.ICICI LOMBARD GENERAL INSURANCE COMPANY LIMITED: PRODUCT PORTFOLIO
TABLE 75.PICC: KEY EXECUTIVE
TABLE 76.PICC: COMPANY SNAPSHOT
TABLE 77.PICC: CORPORATION: PRODUCT PORTFOLIO
TABLE 78.QBE INSURANCE GROUP LIMITED: KEY EXECUTIVE
TABLE 79.QBE INSURANCE GROUP LIMITED: COMPANY SNAPSHOT
TABLE 80.QBE INSURANCE GROUP LIMITED: PRODUCT PORTFOLIO
TABLE 81.SOMPO INTERNATIONAL HOLDINGS LTD.: KEY EXECUTIVE
TABLE 82.SOMPO INTERNATIONAL HOLDINGS LTD.: COMPANY SNAPSHOT
TABLE 83.SOMPO INTERNATIONAL HOLDINGS LTD.: PRODUCT PORTFOLIO
TABLE 84.TOKIO MARINE HCC: KEY EXECUTIVE
TABLE 85.TOKIO MARINE HCC: COMPANY SNAPSHOT
TABLE 86.TOKIO MARINE HCC: PRODUCT PORTFOLIO
TABLE 87.ZURICH: KEY EXECUTIVE
TABLE 88.ZURICH: COMPANY SNAPSHOT
TABLE 89.ZURICH: PRODUCT PORTFOLIO LIST OF FIGURES

FIGURE 01.CROP INSURANCE MARKET, 2019–2027
FIGURE 02.CROP INSURANCE MARKET, BY REGION, 2019–2027
FIGURE 03.TOP IMPACTING FACTORS
FIGURE 04.TOP INVESTMENT POCKETS
FIGURE 05.CROP INSURANCE MARKET, BY COVERAGE, 2019-2027
FIGURE 06.COMPARATIVE SHARE ANALYSIS OF CROP INSURANCE MARKET FOR MULTIPLE PERIL CROP INSURANCE (MPCI), BY COUNTRY, 2019 & 2027 (%)
FIGURE 07.COMPARATIVE SHARE ANALYSIS OF CROP INSURANCE MARKET FOR CROP-HAIL INSURANCE, BY COUNTRY, 2019 & 2027 (%)
FIGURE 08.CROP INSURANCE MARKET REVENUE, BY DISTRIBUTION CHANNEL, 2019-2027 ($MILLION)
FIGURE 09.COMPARATIVE SHARE ANALYSIS OF CROP INSURANCE MARKET FOR BANKS, BY COUNTRY, 2019 & 2027(%)
FIGURE 10.COMPARATIVE SHARE ANALYSIS OF CROP INSURANCE MARKET FOR INSURANCE COMPANIES, BY COUNTRY, 2019 & 2027(%)
FIGURE 11.COMPARATIVE SHARE ANALYSIS OF CROP INSURANCE MARKET FOR BROKERS/AGENTS, BY COUNTRY, 2019 & 2027(%)
FIGURE 12.COMPARATIVE SHARE ANALYSIS OF CROP INSURANCE MARKET FOR OTHERS, BY COUNTRY, 2019 & 2027(%)
FIGURE 13.U.S. CROP INSURANCE MARKET REVENUE, 2019-2027 ($MILLION)
FIGURE 14.CANADA CROP INSURANCE MARKET REVENUE, 2019-2027 ($MILLION)
FIGURE 15.SPAIN CROP INSURANCE MARKET REVENUE, 2019-2027 ($MILLION)
FIGURE 16.GERMANY CROP INSURANCE MARKET REVENUE, 2019-2027 ($MILLION)
FIGURE 17.FRANCE CROP INSURANCE MARKET REVENUE, 2019-2027 ($MILLION)
FIGURE 18.ITALY CROP INSURANCE MARKET REVENUE, 2019-2027 ($MILLION)
FIGURE 19.RUSSIA CROP INSURANCE MARKET REVENUE, 2019-2027 ($MILLION)
FIGURE 20.NETHERLANDS CROP INSURANCE MARKET REVENUE, 2019-2027 ($MILLION)
FIGURE 21.REST OF EUROPE CROP INSURANCE MARKET REVENUE, 2019-2027 ($MILLION)
FIGURE 22.CHINA CROP INSURANCE MARKET REVENUE, 2019-2027 ($MILLION)
FIGURE 23.INDIA CROP INSURANCE MARKET REVENUE, 2019-2027 ($MILLION)
FIGURE 24.JAPAN CROP INSURANCE MARKET REVENUE, 2019-2027 ($MILLION)
FIGURE 25.AUSTRALIA CROP INSURANCE MARKET REVENUE, 2019-2027 ($MILLION)
FIGURE 26.SOUTH KOREA CROP INSURANCE MARKET REVENUE, 2019-2027 ($MILLION)
FIGURE 27.REST OF ASIA-PACIFIC CROP INSURANCE MARKET REVENUE, 2019-2027 ($MILLION)
FIGURE 28.LATIN AMERICA CROP INSURANCE MARKET REVENUE, 2019-2027 ($MILLION)
FIGURE 29.MIDDLE EAST CROP INSURANCE MARKET REVENUE, 2019-2027 ($MILLION)
FIGURE 30.AFRICA CROP INSURANCE MARKET REVENUE, 2019-2027 ($MILLION)
FIGURE 31.MARKET PLAYER POSITIONING, 2019
FIGURE 32.TOP WINNING STRATEGIES, BY YEAR, 2018-2020
FIGURE 33.TOP WINNING STRATEGIES, BY DEVELOPMENT, 2018-2020
FIGURE 34.TOP WINNING STRATEGIES, BY COMPANY, 2018-2020
FIGURE 35.AGRICULTURE INSURANCE COMPANY OF INDIA LIMITED (AIC):NET SALES, 2017–2019 ($MILLION)
FIGURE 36.CHUBB: NET SALES, 2017–2019 ($MILLION)
FIGURE 37.CHUBB: REVENUE SHARE BY REGION (2019)
FIGURE 38.FAIRFAX FINANCIAL HOLDINGS LIMITED: NET SALES, 2017–2019 ($MILLION)
FIGURE 39.FAIRFAX FINANCIAL HOLDINGS LIMITED: REVENUE SHARE BY SEGMENT (2019)
FIGURE 40.FAIRFAX FINANCIAL HOLDINGS LIMITED: REVENUE SHARE BY REGION (2019)
FIGURE 41.ICICI LOMBARD GENERAL INSURANCE COMPANY LIMITED: NET SALES, 2017–2019 ($MILLION)
FIGURE 42.QBE INSURANCE GROUP LIMITED: NET SALES, 2017–2019 ($MILLION)
FIGURE 43.QBE INSURANCE GROUP LIMITED: REVENUE SHARE BY REGION (2019)
FIGURE 44.SOMPO INTERNATIONAL HOLDINGS LTD.: NET SALES, 2017–2019 ($MILLION)
FIGURE 45.ZURICH: NET SALES, 2017–2019 ($MILLION
SELECT A FORMAT
Added to Cart
Electronic (PDF)

$6169

This license allows only one user to access the PDF.
Electronic (PDF)

$6930

This license allows 1 - 5 user to access the PDF, license is suitable for small groups of 5 users working together
Electronic (PDF)

$9665

This license allows users/teams in a same Enterprise to use this report, various departments within an enterpise can use this report
Electronic (PDF)

$4126

This license just provides quantitative data in a excel sheet
Add to Cart
Buy Now (15% Discount)

OUR CUSTOMER

Novocure

RELATED REPORTS

Global Digital Insurance Platform Market Research Report 2024

120 Pages
Type: Report
Code: QYRE-Othe-2K427
Thu Jan 18 00:00:00 UTC 2024

Add to Cart

Marine Insurance - Global Market Insights and Sales Trends 2024

120 Pages
Type: Report
Code: QYRE-Othe-0Z452
Mon Dec 18 00:00:00 UTC 2023

Add to Cart