0
U.S. (TOLL FREE)
+1 (315) 215-3225
Automative

0
U.S. (TOLL FREE)
+1 (315) 215-3225
Anhydrous Milk Fat Market By Nature (Organic, Conventional), By Application (Dairy, Bakery, Confectionary, Others), By Distribution Channel (Online, Offline): Global Opportunity Analysis and Industry Forecast, 2021-2031
Published Date: March 2023
|
Report Code: ALLI-Auto-3C781
Home | Market Reports | Food & Drink| Food
Anhydrous Milk Fat Market By Nature Organic Conventional By Application Dairy Bakery Confectionary Others By Distribution Channel Online Offline Global Opportunity Analysis and Industry Forecast 2021 2031
BUY CHAPTERS

Anhydrous Milk Fat Market By Nature (Organic, Conventional), By Application (Dairy, Bakery, Confectionary, Others), By Distribution Channel (Online, Offline): Global Opportunity Analysis and Industry Forecast, 2021-2031

Code: ALLI-Auto-3C781
Report
March 2023
Pages:250
Allied Market Research
Buy Now with 15% Discount
DESCRIPTION
TABLE OF CONTENT
TABLES & FIGURES

Anhydrous Milk Fat Market Size

According to a new report published by , titled, “Anhydrous Milk Fat Market," The anhydrous milk fat market was valued at $3 billion in 2021, and is estimated to reach $6 billion by 2031, growing at a CAGR of 7.2% from 2022 to 2031.

Anhydrous Milk Fat Market

Anhydrous Milk Fat Market

Anhydrous milk fat is a dairy product that was first produced in India and has a high fat content. By heating butter to almost total evaporation and producing a particular flavor. It is manufactured from cow or buffalo milk. When kept at room temperature, it is stable for an extended period of time.
The anhydrous milk fat market is segmented on the basis of nature, application, distribution channel, and region. By nature, the market is bifurcated into organic and conventional. By application, the market is divided into dairy, bakery, confectionary, and others. By distribution channel, it is classified into online and offline. The offline segment is further fragmented into supermarkets/hypermarkets, specialty stores, convenience stores, and others. Region wise, the market is analyzed across North America (the U.S., Canada, and Mexico), Europe (Germany, the UK, France, Italy, Russia, Spain, Netherlands, Poland, and the rest of Europe), Asia-Pacific (China, Japan, South Korea, India, Indonesia, Thailand, Malaysia, Vietnam, and the rest of Asia-Pacific), and LAMEA (Brazil, Argentina, United Arab Emirates, Saudi Arabia, South Africa, and the rest of LAMEA).
Supply networks for anhydrous milk fat were hampered globally by the COVID-19 pandemic. Lockdowns all over the world, limitations on labor mobility, travel bans, airline suspensions, and, most importantly, a slowdown in the economy have all contributed to the pandemic's effects on society and the economy. This slowdown had a significant impact on the sustainability of supply chains for importing milk or exporting milk all over the world, which is the raw material used in many products. Owing to COVID-19, the anhydrous milk fat market has had to deal with a number of additional problems, such as safety, lack of workforce, crisis management & response, awareness, reorganizing business models, and other unforeseen consequences.
The  rise in demand for anhydrous milk has been significantly influenced by its straightforward preservation. Preservatives are used to prevent food from spoiling as a result of bacteria, molds, fungus, and yeast. Preservatives can extend the shelf life of food by keeping it fresher for extended periods of time. Preservatives for food also function to stop or postpone changes in color, flavor, or texture in addition to avoiding rancidity. Preservative use has increased in the production of several dairy and bakery products, including packaged yogurt, cakes, and chocolates. The industry is expanding as a result of how easily anhydrous milk fat may be preserved.
Anhydrous milk fat replacers are the equivalents to anhydrous milk fats. Anhydrous milk fat replacer is a crucial part of cultured milk foods, bakery-confectionery recipes, and analog cheeses. A carefully curated blend of vegetable oils and fats that are exceptionally oxidation stable makes up the entire composition of anhydrous milk fat replacer. It is very comparable to milk fat in quality and is inexpensive. Nowadays, a lot of customers look for foods and health products. Anhydrous milk fat replacer is completely free of trans-isomer fatty acids, cholesterol, and genetically modified organisms. It also helps with problems related to raw material sources' seasonal dependence.
As per capita income rises, so does purchasing power. Customers also prefer premium products such as organic anhydrous milk fat. The U.S. and Western European countries are becoming more used to consuming organic anhydrous milk fat. Supermarkets and hypermarkets in particular draw customers who are willing to spend more on high-end, branded, and organic food items owing to their extensive selection of organic dairy products. Despite their high price, consumers still choose to purchase healthy products as they are aware of their benefits. The premiumization trend and the desire for organic products should be financially advantageous for manufacturers on the global market.
The major players analyzed for the global anhydrous milk fat industry are Royal FrieslandCampina N.V., Asha Ram & Sons Pvt. Ltd, Lactalis Group, Interfood Holding BV, Vitusa Corp, Royal VIVBuisman, Polmlek Group, Gloria Argentina SA, United Global Agencies, and Eurial Ingredients & Nutrition. To raise their market share, boost profitability, and maintain market competitiveness, the major market participants in anhydrous milk fat have adopted product launches, company expansion, and merger & acquisition as their key strategies.
KEY FINDINGS OF STUDY
By nature, the conventional segment was the highest revenue contributor to the market, and is estimated to grow with a CAGR of 7.0%.
By application, the dairy segment was the highest revenue contributor to the market, in 2021, and is estimated to grow with a CAGR of 6.8%.
Depending on the distribution channel, the offline segment was the highest revenue contributor to the market in 2021, and is estimated to grow with a CAGR of 7.0%.
RegioRegion-wisea-Pacific was the highest revenue contributor and is estimated to grow with a CAGR of 6.7%.

Overview

The global anhydrous milk fat market was valued at $3 billion in 2021, and is projected to reach $6 billion by 2031, growing at a CAGR of 7.2% from 2022 to 2031.Cream or butter can be used to create anhydrous milk fat. The direct-from-cream process uses disk bowl separators to perform the following main separation operations; separating whole milk to produce 40% fat cream; concentrating this cream to approximately 75% fat; concentrating the butteroil phase after inverting its phase; and polishing the butteroil phase after adding in-line wash water and possibly neutralizing free fatty acids.
The anhydrous milk fat market is segmented on the basis of nature, application, distribution channel, and region. By nature, the market is bifurcated into organic and conventional. By application, the market is divided into dairy, bakery, confectionary, and others. By distribution channel, it is classified into online and offline. The offline segment is further fragmented into supermarkets/hypermarkets, specialty stores, convenience stores, and others. Region wise, the market is analyzed across North America (the U.S., Canada, and Mexico), Europe (Germany, the UK, France, Italy, Russia, Spain, Netherlands, Poland, and the rest of Europe), Asia-Pacific (China, Japan, South Korea, India, Indonesia, Thailand, Malaysia, Vietnam, and the rest of Asia-Pacific), and LAMEA (Brazil, Argentina, United Arab Emirates, Saudi Arabia, South Africa, and the rest of LAMEA).
The impact of the COVID-19 outbreak was moderate on the growth of the global anhydrous milk fat market. The trade restrictions and lockdown resulted in the halting of production and manufacturing units. However, the recovery of the anhydrous milk fat market is expected in near future.
The ease of preserving anhydrous milk has contributed significantly to the market's rise in demand. Preservatives are used to prevent food deterioration brought on by bacteria, molds, fungus, and yeast. By adding preservatives to keep food fresher for longer periods of time, the shelf life of food can be extended. In addition to avoiding rancidity, food preservatives also function to stop or delay changes in color, flavor, or texture. Preservatives are being used in greater quantities throughout the manufacturing process for a number of dairy and bakery items, including packaged yogurt, cakes, and chocolates. Since anhydrous milk fat can be preserved easily, the industry is expanding.
However, there is rise in demand for plant-based foods as a result of consumers' growing concern over animal welfare. Furthermore, the market for mainstream retail products is rapidly incorporating plant-based foods and beverages. In addition, as more people become lactose intolerant, the demand for dairy alternatives is growing. Owing to their role in the development of obesity and other sedentary lifestyle-related diseases, lactose-containing products are viewed as unhealthy. The rapidly expanding dairy alternatives market, which has brought new products such as non-dairy ice cream, bakeries using vegetable oil, and confectionary products, is expected to restrain the expansion of the global market.
The key players operating in the anhydrous milk fat market have adopted product launch, business expansion, and merger & acquisition as their key strategies to expand their market share, increase profitability, and remain competitive in the market. The major players operating in the global anhydrous milk fat market are Royal FrieslandCampina N.V., Asha Ram & Sons Pvt. Ltd, Lactalis Group, Interfood Holding BV, Vitusa Corp, Royal VIVBuisman, Polmlek Group, Gloria Argentina SA, United Global Agencies, and Eurial Ingredients & Nutrition.

Key Benefits For Stakeholders

●This report provides a quantitative analysis of the market segments, current trends, estimations, and dynamics of the anhydrous milk fat market analysis from 2021 to 2031 to identify the prevailing anhydrous milk fat market opportunities.
●The market research is offered along with information related to key drivers, restraints, and opportunities.
●Porter's five forces analysis highlights the potency of buyers and suppliers to enable stakeholders make profit-oriented business decisions and strengthen their supplier-buyer network.
●In-depth analysis of the anhydrous milk fat market segmentation assists to determine the prevailing market opportunities.
●Major countries in each region are mapped according to their revenue contribution to the global market.
●Market player positioning facilitates benchmarking and provides a clear understanding of the present position of the market players.
●The report includes the analysis of the regional as well as global anhydrous milk fat market trends, key players, market segments, application areas, and market growth strategies.
Key Market Segments
○ UGA Grou

Scope of Anhydrous Milk Fat Market Report

Report Metric Details
Report Name Anhydrous Milk Fat Market
Accounted market size in 2021 $ 3 in billion
Forecasted market size in 2031 $ 6 billion
CAGR 7.2%
Base Year 2021
Forecasted years 2024 - 2031
By Nature ● Organic
● Conventional
By Application ● Dairy
● Bakery
● Confectionary
● Others
By Distribution Channel ● Online
● Offline
○ Sub-type
○ Supermarkets/hypermarkets
○ Convenience stores
○ Specialty stores
○ Others
By Region
  • North America (United States, Canada)
  • Europe (Germany, France, UK, Italy, Russia) Rest of Europe
  • Nordic Countries
  • Asia-Pacific (China, Japan, South Korea)
  • Southeast Asia (India, Australia)
  • Rest of Asia
  • Latin America (Mexico, Brazil)
  • Rest of Latin America
  • Middle East & Africa (Turkey, Saudi Arabia, UAE, Rest of MEA)
Forecast units USD million in value
Report coverage Revenue and volume forecast, company share, competitive landscape, growth factors and trends

FAQ for this report

How fast is Anhydrous Milk Fat Market growing?

Ans: The Anhydrous Milk Fat Market witnessing a CAGR of 7.2% during the forecast period 2024-2031.

What is the Anhydrous Milk Fat Market size in 2031?

Ans: The Anhydrous Milk Fat Market size in 2031 will be $ 6 billion.

What are the Application segmentation covered in the Anhydrous Milk Fat Market report?

Ans: The Applications covered in the Anhydrous Milk Fat Market report are ● Dairy, ● Bakery, ● Confectionary, ● Others

CHAPTER 1: INTRODUCTION
1.1. Report description
1.2. Key market segments
1.3. Key benefits to the stakeholders
1.4. Research Methodology
1.4.1. Primary research
1.4.2. Secondary research
1.4.3. Analyst tools and models
CHAPTER 2: EXECUTIVE SUMMARY
2.1. CXO Perspective
CHAPTER 3: MARKET OVERVIEW
3.1. Market definition and scope
3.2. Key findings
3.2.1. Top impacting factors
3.2.2. Top investment pockets
3.3. Porter’s five forces analysis
3.3.1. Bargaining power of suppliers
3.3.2. Bargaining power of buyers
3.3.3. Threat of substitutes
3.3.4. Threat of new entrants
3.3.5. Intensity of rivalry
3.4. Market dynamics
3.4.1. Drivers
3.4.1.1. Easy preservation of anhydrous milk fat
3.4.1.2. Growth in expansion of the dairy industry
3.4.1.3. Rise in popularity of product foodservice and retail industries
3.4.2. Restraints
3.4.2.1. Surge in popularity of plant-based and lactose-free foods
3.4.2.2. Wide availability of substitutes
3.4.3. Opportunities
3.4.3.1. Surge in demand for organic anhydrous milk fat
3.4.3.2. Rise in number of large private label brands
3.5. COVID-19 Impact Analysis on the market
3.6. Market Share Analysis
3.7. Pricing Analysis
3.8. Value Chain Analysis
CHAPTER 4: ANHYDROUS MILK FAT MARKET, BY NATURE
4.1. Overview
4.1.1. Market size and forecast
4.2. Organic
4.2.1. Key market trends, growth factors and opportunities
4.2.2. Market size and forecast, by region
4.2.3. Market share analysis by country
4.3. Conventional
4.3.1. Key market trends, growth factors and opportunities
4.3.2. Market size and forecast, by region
4.3.3. Market share analysis by country
CHAPTER 5: ANHYDROUS MILK FAT MARKET, BY APPLICATION
5.1. Overview
5.1.1. Market size and forecast
5.2. Dairy
5.2.1. Key market trends, growth factors and opportunities
5.2.2. Market size and forecast, by region
5.2.3. Market share analysis by country
5.3. Bakery
5.3.1. Key market trends, growth factors and opportunities
5.3.2. Market size and forecast, by region
5.3.3. Market share analysis by country
5.4. Confectionary
5.4.1. Key market trends, growth factors and opportunities
5.4.2. Market size and forecast, by region
5.4.3. Market share analysis by country
5.5. Others
5.5.1. Key market trends, growth factors and opportunities
5.5.2. Market size and forecast, by region
5.5.3. Market share analysis by country
CHAPTER 6: ANHYDROUS MILK FAT MARKET, BY DISTRIBUTION CHANNEL
6.1. Overview
6.1.1. Market size and forecast
6.2. Online
6.2.1. Key market trends, growth factors and opportunities
6.2.2. Market size and forecast, by region
6.2.3. Market share analysis by country
6.3. Offline
6.3.1. Key market trends, growth factors and opportunities
6.3.2. Market size and forecast, by region
6.3.3. Market share analysis by country
6.3.4. Offline Anhydrous Milk Fat Market by Sub-type
6.3.4.1. Supermarkets/hypermarkets Market size and forecast, by region
6.3.4.2. Convenience stores Market size and forecast, by region
6.3.4.3. Specialty stores Market size and forecast, by region
6.3.4.4. Others Market size and forecast, by region
CHAPTER 7: ANHYDROUS MILK FAT MARKET, BY REGION
7.1. Overview
7.1.1. Market size and forecast By Region
7.2. North America
7.2.1. Key trends and opportunities
7.2.2. Market size and forecast, by Nature
7.2.3. Market size and forecast, by Application
7.2.4. Market size and forecast, by Distribution Channel
7.2.4.1. North America Offline Anhydrous Milk Fat Market by Sub-type
7.2.5. Market size and forecast, by country
7.2.5.1. U.S.
7.2.5.1.1. Key market trends, growth factors and opportunities
7.2.5.1.2. Market size and forecast, by Nature
7.2.5.1.3. Market size and forecast, by Application
7.2.5.1.4. Market size and forecast, by Distribution Channel
7.2.5.2. Canada
7.2.5.2.1. Key market trends, growth factors and opportunities
7.2.5.2.2. Market size and forecast, by Nature
7.2.5.2.3. Market size and forecast, by Application
7.2.5.2.4. Market size and forecast, by Distribution Channel
7.2.5.3. Mexico
7.2.5.3.1. Key market trends, growth factors and opportunities
7.2.5.3.2. Market size and forecast, by Nature
7.2.5.3.3. Market size and forecast, by Application
7.2.5.3.4. Market size and forecast, by Distribution Channel
7.3. Europe
7.3.1. Key trends and opportunities
7.3.2. Market size and forecast, by Nature
7.3.3. Market size and forecast, by Application
7.3.4. Market size and forecast, by Distribution Channel
7.3.4.1. Europe Offline Anhydrous Milk Fat Market by Sub-type
7.3.5. Market size and forecast, by country
7.3.5.1. Germany
7.3.5.1.1. Key market trends, growth factors and opportunities
7.3.5.1.2. Market size and forecast, by Nature
7.3.5.1.3. Market size and forecast, by Application
7.3.5.1.4. Market size and forecast, by Distribution Channel
7.3.5.2. Netherlands
7.3.5.2.1. Key market trends, growth factors and opportunities
7.3.5.2.2. Market size and forecast, by Nature
7.3.5.2.3. Market size and forecast, by Application
7.3.5.2.4. Market size and forecast, by Distribution Channel
7.3.5.3. UK
7.3.5.3.1. Key market trends, growth factors and opportunities
7.3.5.3.2. Market size and forecast, by Nature
7.3.5.3.3. Market size and forecast, by Application
7.3.5.3.4. Market size and forecast, by Distribution Channel
7.3.5.4. France
7.3.5.4.1. Key market trends, growth factors and opportunities
7.3.5.4.2. Market size and forecast, by Nature
7.3.5.4.3. Market size and forecast, by Application
7.3.5.4.4. Market size and forecast, by Distribution Channel
7.3.5.5. Italy
7.3.5.5.1. Key market trends, growth factors and opportunities
7.3.5.5.2. Market size and forecast, by Nature
7.3.5.5.3. Market size and forecast, by Application
7.3.5.5.4. Market size and forecast, by Distribution Channel
7.3.5.6. Spain
7.3.5.6.1. Key market trends, growth factors and opportunities
7.3.5.6.2. Market size and forecast, by Nature
7.3.5.6.3. Market size and forecast, by Application
7.3.5.6.4. Market size and forecast, by Distribution Channel
7.3.5.7. Russia
7.3.5.7.1. Key market trends, growth factors and opportunities
7.3.5.7.2. Market size and forecast, by Nature
7.3.5.7.3. Market size and forecast, by Application
7.3.5.7.4. Market size and forecast, by Distribution Channel
7.3.5.8. Poland
7.3.5.8.1. Key market trends, growth factors and opportunities
7.3.5.8.2. Market size and forecast, by Nature
7.3.5.8.3. Market size and forecast, by Application
7.3.5.8.4. Market size and forecast, by Distribution Channel
7.3.5.9. Rest of Europe
7.3.5.9.1. Key market trends, growth factors and opportunities
7.3.5.9.2. Market size and forecast, by Nature
7.3.5.9.3. Market size and forecast, by Application
7.3.5.9.4. Market size and forecast, by Distribution Channel
7.4. Asia-Pacific
7.4.1. Key trends and opportunities
7.4.2. Market size and forecast, by Nature
7.4.3. Market size and forecast, by Application
7.4.4. Market size and forecast, by Distribution Channel
7.4.4.1. Asia-Pacific Offline Anhydrous Milk Fat Market by Sub-type
7.4.5. Market size and forecast, by country
7.4.5.1. China
7.4.5.1.1. Key market trends, growth factors and opportunities
7.4.5.1.2. Market size and forecast, by Nature
7.4.5.1.3. Market size and forecast, by Application
7.4.5.1.4. Market size and forecast, by Distribution Channel
7.4.5.2. Japan
7.4.5.2.1. Key market trends, growth factors and opportunities
7.4.5.2.2. Market size and forecast, by Nature
7.4.5.2.3. Market size and forecast, by Application
7.4.5.2.4. Market size and forecast, by Distribution Channel
7.4.5.3. India
7.4.5.3.1. Key market trends, growth factors and opportunities
7.4.5.3.2. Market size and forecast, by Nature
7.4.5.3.3. Market size and forecast, by Application
7.4.5.3.4. Market size and forecast, by Distribution Channel
7.4.5.4. Indonesia
7.4.5.4.1. Key market trends, growth factors and opportunities
7.4.5.4.2. Market size and forecast, by Nature
7.4.5.4.3. Market size and forecast, by Application
7.4.5.4.4. Market size and forecast, by Distribution Channel
7.4.5.5. Thailand
7.4.5.5.1. Key market trends, growth factors and opportunities
7.4.5.5.2. Market size and forecast, by Nature
7.4.5.5.3. Market size and forecast, by Application
7.4.5.5.4. Market size and forecast, by Distribution Channel
7.4.5.6. South Korea
7.4.5.6.1. Key market trends, growth factors and opportunities
7.4.5.6.2. Market size and forecast, by Nature
7.4.5.6.3. Market size and forecast, by Application
7.4.5.6.4. Market size and forecast, by Distribution Channel
7.4.5.7. Vietnam
7.4.5.7.1. Key market trends, growth factors and opportunities
7.4.5.7.2. Market size and forecast, by Nature
7.4.5.7.3. Market size and forecast, by Application
7.4.5.7.4. Market size and forecast, by Distribution Channel
7.4.5.8. Malaysia
7.4.5.8.1. Key market trends, growth factors and opportunities
7.4.5.8.2. Market size and forecast, by Nature
7.4.5.8.3. Market size and forecast, by Application
7.4.5.8.4. Market size and forecast, by Distribution Channel
7.4.5.9. Rest of Asia-Pacific
7.4.5.9.1. Key market trends, growth factors and opportunities
7.4.5.9.2. Market size and forecast, by Nature
7.4.5.9.3. Market size and forecast, by Application
7.4.5.9.4. Market size and forecast, by Distribution Channel
7.5. LAMEA
7.5.1. Key trends and opportunities
7.5.2. Market size and forecast, by Nature
7.5.3. Market size and forecast, by Application
7.5.4. Market size and forecast, by Distribution Channel
7.5.4.1. LAMEA Offline Anhydrous Milk Fat Market by Sub-type
7.5.5. Market size and forecast, by country
7.5.5.1. Brazil
7.5.5.1.1. Key market trends, growth factors and opportunities
7.5.5.1.2. Market size and forecast, by Nature
7.5.5.1.3. Market size and forecast, by Application
7.5.5.1.4. Market size and forecast, by Distribution Channel
7.5.5.2. Argentina
7.5.5.2.1. Key market trends, growth factors and opportunities
7.5.5.2.2. Market size and forecast, by Nature
7.5.5.2.3. Market size and forecast, by Application
7.5.5.2.4. Market size and forecast, by Distribution Channel
7.5.5.3. United Arab Emirates
7.5.5.3.1. Key market trends, growth factors and opportunities
7.5.5.3.2. Market size and forecast, by Nature
7.5.5.3.3. Market size and forecast, by Application
7.5.5.3.4. Market size and forecast, by Distribution Channel
7.5.5.4. Saudi Arabia
7.5.5.4.1. Key market trends, growth factors and opportunities
7.5.5.4.2. Market size and forecast, by Nature
7.5.5.4.3. Market size and forecast, by Application
7.5.5.4.4. Market size and forecast, by Distribution Channel
7.5.5.5. South Africa
7.5.5.5.1. Key market trends, growth factors and opportunities
7.5.5.5.2. Market size and forecast, by Nature
7.5.5.5.3. Market size and forecast, by Application
7.5.5.5.4. Market size and forecast, by Distribution Channel
7.5.5.6. Rest of LAMEA
7.5.5.6.1. Key market trends, growth factors and opportunities
7.5.5.6.2. Market size and forecast, by Nature
7.5.5.6.3. Market size and forecast, by Application
7.5.5.6.4. Market size and forecast, by Distribution Channel
CHAPTER 8: COMPETITIVE LANDSCAPE
8.1. Introduction
8.2. Top winning strategies
8.3. Product Mapping of Top 10 Player
8.4. Competitive Dashboard
8.5. Competitive Heatmap
8.6. Top player positioning, 2021
CHAPTER 9: COMPANY PROFILES
9.1. Asha Ram & Sons Pvt. Ltd.
9.1.1. Company overview
9.1.2. Key Executives
9.1.3. Company snapshot
9.1.4. Operating business segments
9.1.5. Product portfolio
9.2. Lactalis Group
9.2.1. Company overview
9.2.2. Key Executives
9.2.3. Company snapshot
9.2.4. Operating business segments
9.2.5. Product portfolio
9.3. Interfood Holding BV
9.3.1. Company overview
9.3.2. Key Executives
9.3.3. Company snapshot
9.3.4. Operating business segments
9.3.5. Product portfolio
9.3.6. Business performance
9.3.7. Key strategic moves and developments
9.4. Vitusa Corp
9.4.1. Company overview
9.4.2. Key Executives
9.4.3. Company snapshot
9.4.4. Operating business segments
9.4.5. Product portfolio
9.5. Royal VIVBuisman
9.5.1. Company overview
9.5.2. Key Executives
9.5.3. Company snapshot
9.5.4. Operating business segments
9.5.5. Product portfolio
9.6. Polmlek Group
9.6.1. Company overview
9.6.2. Key Executives
9.6.3. Company snapshot
9.6.4. Operating business segments
9.6.5. Product portfolio
9.7. Gloria Argentina SA
9.7.1. Company overview
9.7.2. Key Executives
9.7.3. Company snapshot
9.7.4. Operating business segments
9.7.5. Product portfolio
9.8. UGA Group
9.8.1. Company overview
9.8.2. Key Executives
9.8.3. Company snapshot
9.8.4. Operating business segments
9.8.5. Product portfolio
9.9. Eurial Ingredients & Nutrition
9.9.1. Company overview
9.9.2. Key Executives
9.9.3. Company snapshot
9.9.4. Operating business segments
9.9.5. Product portfolio
9.10. Royal FrieslandCampina N.V.
9.10.1. Company overview
9.10.2. Key Executives
9.10.3. Company snapshot
9.10.4. Operating business segments
9.10.5. Product portfolio
9.10.6. Business performance
9.10.7. Key strategic moves and development
LIST OF TABLES
TABLE 01. GLOBAL ANHYDROUS MILK FAT MARKET, BY NATURE, 2021-2031 ($MILLION)
TABLE 02. GLOBAL ANHYDROUS MILK FAT MARKET, BY NATURE, 2021-2031 (LITRES)
TABLE 03. ANHYDROUS MILK FAT MARKET FOR ORGANIC, BY REGION, 2021-2031 ($MILLION)
TABLE 04. ANHYDROUS MILK FAT MARKET FOR ORGANIC, BY REGION, 2021-2031 (LITRES)
TABLE 05. ANHYDROUS MILK FAT MARKET FOR CONVENTIONAL, BY REGION, 2021-2031 ($MILLION)
TABLE 06. ANHYDROUS MILK FAT MARKET FOR CONVENTIONAL, BY REGION, 2021-2031 (LITRES)
TABLE 07. GLOBAL ANHYDROUS MILK FAT MARKET, BY APPLICATION, 2021-2031 ($MILLION)
TABLE 08. ANHYDROUS MILK FAT MARKET FOR DAIRY, BY REGION, 2021-2031 ($MILLION)
TABLE 09. ANHYDROUS MILK FAT MARKET FOR BAKERY, BY REGION, 2021-2031 ($MILLION)
TABLE 10. ANHYDROUS MILK FAT MARKET FOR CONFECTIONARY, BY REGION, 2021-2031 ($MILLION)
TABLE 11. ANHYDROUS MILK FAT MARKET FOR OTHERS, BY REGION, 2021-2031 ($MILLION)
TABLE 12. GLOBAL ANHYDROUS MILK FAT MARKET, BY DISTRIBUTION CHANNEL, 2021-2031 ($MILLION)
TABLE 13. ANHYDROUS MILK FAT MARKET FOR ONLINE, BY REGION, 2021-2031 ($MILLION)
TABLE 14. ANHYDROUS MILK FAT MARKET FOR OFFLINE, BY REGION, 2021-2031 ($MILLION)
TABLE 15. GLOBAL OFFLINE ANHYDROUS MILK FAT MARKET, BY SUB-TYPE, 2021-2031 ($MILLION)
TABLE 16. ANHYDROUS MILK FAT MARKET FOR SUPERMARKETS/HYPERMARKETS, BY REGION, 2021-2031 ($MILLION)
TABLE 17. ANHYDROUS MILK FAT MARKET FOR CONVENIENCE STORES, BY REGION, 2021-2031 ($MILLION)
TABLE 18. ANHYDROUS MILK FAT MARKET FOR SPECIALTY STORES, BY REGION, 2021-2031 ($MILLION)
TABLE 19. ANHYDROUS MILK FAT MARKET FOR OTHERS, BY REGION, 2021-2031 ($MILLION)
TABLE 20. ANHYDROUS MILK FAT MARKET, BY REGION, 2021-2031 ($MILLION)
TABLE 21. ANHYDROUS MILK FAT MARKET, BY REGION, 2021-2031 (LITRES)
TABLE 22. NORTH AMERICA ANHYDROUS MILK FAT MARKET, BY NATURE, 2021-2031 ($MILLION)
TABLE 23. NORTH AMERICA ANHYDROUS MILK FAT MARKET, BY NATURE, 2021-2031 (LITRES)
TABLE 24. NORTH AMERICA ANHYDROUS MILK FAT MARKET, BY APPLICATION, 2021-2031 ($MILLION)
TABLE 25. NORTH AMERICA ANHYDROUS MILK FAT MARKET, BY DISTRIBUTION CHANNEL, 2021-2031 ($MILLION)
TABLE 26. NORTH AMERICA OFFLINE ANHYDROUS MILK FAT MARKET, BY SUB-TYPE, 2021-2031 ($MILLION)
TABLE 27. NORTH AMERICA ANHYDROUS MILK FAT MARKET, BY COUNTRY, 2021-2031 ($MILLION)
TABLE 28. NORTH AMERICA ANHYDROUS MILK FAT MARKET, BY COUNTRY, 2021-2031 (LITRES)
TABLE 29. U.S. ANHYDROUS MILK FAT MARKET, BY NATURE, 2021-2031 ($MILLION)
TABLE 30. U.S. ANHYDROUS MILK FAT MARKET, BY NATURE, 2021-2031 (LITRES)
TABLE 31. U.S. ANHYDROUS MILK FAT MARKET, BY APPLICATION, 2021-2031 ($MILLION)
TABLE 32. U.S. ANHYDROUS MILK FAT MARKET, BY DISTRIBUTION CHANNEL, 2021-2031 ($MILLION)
TABLE 33. CANADA ANHYDROUS MILK FAT MARKET, BY NATURE, 2021-2031 ($MILLION)
TABLE 34. CANADA ANHYDROUS MILK FAT MARKET, BY NATURE, 2021-2031 (LITRES)
TABLE 35. CANADA ANHYDROUS MILK FAT MARKET, BY APPLICATION, 2021-2031 ($MILLION)
TABLE 36. CANADA ANHYDROUS MILK FAT MARKET, BY DISTRIBUTION CHANNEL, 2021-2031 ($MILLION)
TABLE 37. MEXICO ANHYDROUS MILK FAT MARKET, BY NATURE, 2021-2031 ($MILLION)
TABLE 38. MEXICO ANHYDROUS MILK FAT MARKET, BY NATURE, 2021-2031 (LITRES)
TABLE 39. MEXICO ANHYDROUS MILK FAT MARKET, BY APPLICATION, 2021-2031 ($MILLION)
TABLE 40. MEXICO ANHYDROUS MILK FAT MARKET, BY DISTRIBUTION CHANNEL, 2021-2031 ($MILLION)
TABLE 41. EUROPE ANHYDROUS MILK FAT MARKET, BY NATURE, 2021-2031 ($MILLION)
TABLE 42. EUROPE ANHYDROUS MILK FAT MARKET, BY NATURE, 2021-2031 (LITRES)
TABLE 43. EUROPE ANHYDROUS MILK FAT MARKET, BY APPLICATION, 2021-2031 ($MILLION)
TABLE 44. EUROPE ANHYDROUS MILK FAT MARKET, BY DISTRIBUTION CHANNEL, 2021-2031 ($MILLION)
TABLE 45. EUROPE OFFLINE ANHYDROUS MILK FAT MARKET, BY SUB-TYPE, 2021-2031 ($MILLION)
TABLE 46. EUROPE ANHYDROUS MILK FAT MARKET, BY COUNTRY, 2021-2031 ($MILLION)
TABLE 47. EUROPE ANHYDROUS MILK FAT MARKET, BY COUNTRY, 2021-2031 (LITRES)
TABLE 48. GERMANY ANHYDROUS MILK FAT MARKET, BY NATURE, 2021-2031 ($MILLION)
TABLE 49. GERMANY ANHYDROUS MILK FAT MARKET, BY NATURE, 2021-2031 (LITRES)
TABLE 50. GERMANY ANHYDROUS MILK FAT MARKET, BY APPLICATION, 2021-2031 ($MILLION)
TABLE 51. GERMANY ANHYDROUS MILK FAT MARKET, BY DISTRIBUTION CHANNEL, 2021-2031 ($MILLION)
TABLE 52. NETHERLANDS ANHYDROUS MILK FAT MARKET, BY NATURE, 2021-2031 ($MILLION)
TABLE 53. NETHERLANDS ANHYDROUS MILK FAT MARKET, BY NATURE, 2021-2031 (LITRES)
TABLE 54. NETHERLANDS ANHYDROUS MILK FAT MARKET, BY APPLICATION, 2021-2031 ($MILLION)
TABLE 55. NETHERLANDS ANHYDROUS MILK FAT MARKET, BY DISTRIBUTION CHANNEL, 2021-2031 ($MILLION)
TABLE 56. UK ANHYDROUS MILK FAT MARKET, BY NATURE, 2021-2031 ($MILLION)
TABLE 57. UK ANHYDROUS MILK FAT MARKET, BY NATURE, 2021-2031 (LITRES)
TABLE 58. UK ANHYDROUS MILK FAT MARKET, BY APPLICATION, 2021-2031 ($MILLION)
TABLE 59. UK ANHYDROUS MILK FAT MARKET, BY DISTRIBUTION CHANNEL, 2021-2031 ($MILLION)
TABLE 60. FRANCE ANHYDROUS MILK FAT MARKET, BY NATURE, 2021-2031 ($MILLION)
TABLE 61. FRANCE ANHYDROUS MILK FAT MARKET, BY NATURE, 2021-2031 (LITRES)
TABLE 62. FRANCE ANHYDROUS MILK FAT MARKET, BY APPLICATION, 2021-2031 ($MILLION)
TABLE 63. FRANCE ANHYDROUS MILK FAT MARKET, BY DISTRIBUTION CHANNEL, 2021-2031 ($MILLION)
TABLE 64. ITALY ANHYDROUS MILK FAT MARKET, BY NATURE, 2021-2031 ($MILLION)
TABLE 65. ITALY ANHYDROUS MILK FAT MARKET, BY NATURE, 2021-2031 (LITRES)
TABLE 66. ITALY ANHYDROUS MILK FAT MARKET, BY APPLICATION, 2021-2031 ($MILLION)
TABLE 67. ITALY ANHYDROUS MILK FAT MARKET, BY DISTRIBUTION CHANNEL, 2021-2031 ($MILLION)
TABLE 68. SPAIN ANHYDROUS MILK FAT MARKET, BY NATURE, 2021-2031 ($MILLION)
TABLE 69. SPAIN ANHYDROUS MILK FAT MARKET, BY NATURE, 2021-2031 (LITRES)
TABLE 70. SPAIN ANHYDROUS MILK FAT MARKET, BY APPLICATION, 2021-2031 ($MILLION)
TABLE 71. SPAIN ANHYDROUS MILK FAT MARKET, BY DISTRIBUTION CHANNEL, 2021-2031 ($MILLION)
TABLE 72. RUSSIA ANHYDROUS MILK FAT MARKET, BY NATURE, 2021-2031 ($MILLION)
TABLE 73. RUSSIA ANHYDROUS MILK FAT MARKET, BY NATURE, 2021-2031 (LITRES)
TABLE 74. RUSSIA ANHYDROUS MILK FAT MARKET, BY APPLICATION, 2021-2031 ($MILLION)
TABLE 75. RUSSIA ANHYDROUS MILK FAT MARKET, BY DISTRIBUTION CHANNEL, 2021-2031 ($MILLION)
TABLE 76. POLAND ANHYDROUS MILK FAT MARKET, BY NATURE, 2021-2031 ($MILLION)
TABLE 77. POLAND ANHYDROUS MILK FAT MARKET, BY NATURE, 2021-2031 (LITRES)
TABLE 78. POLAND ANHYDROUS MILK FAT MARKET, BY APPLICATION, 2021-2031 ($MILLION)
TABLE 79. POLAND ANHYDROUS MILK FAT MARKET, BY DISTRIBUTION CHANNEL, 2021-2031 ($MILLION)
TABLE 80. REST OF EUROPE ANHYDROUS MILK FAT MARKET, BY NATURE, 2021-2031 ($MILLION)
TABLE 81. REST OF EUROPE ANHYDROUS MILK FAT MARKET, BY NATURE, 2021-2031 (LITRES)
TABLE 82. REST OF EUROPE ANHYDROUS MILK FAT MARKET, BY APPLICATION, 2021-2031 ($MILLION)
TABLE 83. REST OF EUROPE ANHYDROUS MILK FAT MARKET, BY DISTRIBUTION CHANNEL, 2021-2031 ($MILLION)
TABLE 84. ASIA-PACIFIC ANHYDROUS MILK FAT MARKET, BY NATURE, 2021-2031 ($MILLION)
TABLE 85. ASIA-PACIFIC ANHYDROUS MILK FAT MARKET, BY NATURE, 2021-2031 (LITRES)
TABLE 86. ASIA-PACIFIC ANHYDROUS MILK FAT MARKET, BY APPLICATION, 2021-2031 ($MILLION)
TABLE 87. ASIA-PACIFIC ANHYDROUS MILK FAT MARKET, BY DISTRIBUTION CHANNEL, 2021-2031 ($MILLION)
TABLE 88. ASIA-PACIFIC OFFLINE ANHYDROUS MILK FAT MARKET, BY SUB-TYPE, 2021-2031 ($MILLION)
TABLE 89. ASIA-PACIFIC ANHYDROUS MILK FAT MARKET, BY COUNTRY, 2021-2031 ($MILLION)
TABLE 90. ASIA-PACIFIC ANHYDROUS MILK FAT MARKET, BY COUNTRY, 2021-2031 (LITRES)
TABLE 91. CHINA ANHYDROUS MILK FAT MARKET, BY NATURE, 2021-2031 ($MILLION)
TABLE 92. CHINA ANHYDROUS MILK FAT MARKET, BY NATURE, 2021-2031 (LITRES)
TABLE 93. CHINA ANHYDROUS MILK FAT MARKET, BY APPLICATION, 2021-2031 ($MILLION)
TABLE 94. CHINA ANHYDROUS MILK FAT MARKET, BY DISTRIBUTION CHANNEL, 2021-2031 ($MILLION)
TABLE 95. JAPAN ANHYDROUS MILK FAT MARKET, BY NATURE, 2021-2031 ($MILLION)
TABLE 96. JAPAN ANHYDROUS MILK FAT MARKET, BY NATURE, 2021-2031 (LITRES)
TABLE 97. JAPAN ANHYDROUS MILK FAT MARKET, BY APPLICATION, 2021-2031 ($MILLION)
TABLE 98. JAPAN ANHYDROUS MILK FAT MARKET, BY DISTRIBUTION CHANNEL, 2021-2031 ($MILLION)
TABLE 99. INDIA ANHYDROUS MILK FAT MARKET, BY NATURE, 2021-2031 ($MILLION)
TABLE 100. INDIA ANHYDROUS MILK FAT MARKET, BY NATURE, 2021-2031 (LITRES)
TABLE 101. INDIA ANHYDROUS MILK FAT MARKET, BY APPLICATION, 2021-2031 ($MILLION)
TABLE 102. INDIA ANHYDROUS MILK FAT MARKET, BY DISTRIBUTION CHANNEL, 2021-2031 ($MILLION)
TABLE 103. INDONESIA ANHYDROUS MILK FAT MARKET, BY NATURE, 2021-2031 ($MILLION)
TABLE 104. INDONESIA ANHYDROUS MILK FAT MARKET, BY NATURE, 2021-2031 (LITRES)
TABLE 105. INDONESIA ANHYDROUS MILK FAT MARKET, BY APPLICATION, 2021-2031 ($MILLION)
TABLE 106. INDONESIA ANHYDROUS MILK FAT MARKET, BY DISTRIBUTION CHANNEL, 2021-2031 ($MILLION)
TABLE 107. THAILAND ANHYDROUS MILK FAT MARKET, BY NATURE, 2021-2031 ($MILLION)
TABLE 108. THAILAND ANHYDROUS MILK FAT MARKET, BY NATURE, 2021-2031 (LITRES)
TABLE 109. THAILAND ANHYDROUS MILK FAT MARKET, BY APPLICATION, 2021-2031 ($MILLION)
TABLE 110. THAILAND ANHYDROUS MILK FAT MARKET, BY DISTRIBUTION CHANNEL, 2021-2031 ($MILLION)
TABLE 111. SOUTH KOREA ANHYDROUS MILK FAT MARKET, BY NATURE, 2021-2031 ($MILLION)
TABLE 112. SOUTH KOREA ANHYDROUS MILK FAT MARKET, BY NATURE, 2021-2031 (LITRES)
TABLE 113. SOUTH KOREA ANHYDROUS MILK FAT MARKET, BY APPLICATION, 2021-2031 ($MILLION)
TABLE 114. SOUTH KOREA ANHYDROUS MILK FAT MARKET, BY DISTRIBUTION CHANNEL, 2021-2031 ($MILLION)
TABLE 115. VIETNAM ANHYDROUS MILK FAT MARKET, BY NATURE, 2021-2031 ($MILLION)
TABLE 116. VIETNAM ANHYDROUS MILK FAT MARKET, BY NATURE, 2021-2031 (LITRES)
TABLE 117. VIETNAM ANHYDROUS MILK FAT MARKET, BY APPLICATION, 2021-2031 ($MILLION)
TABLE 118. VIETNAM ANHYDROUS MILK FAT MARKET, BY DISTRIBUTION CHANNEL, 2021-2031 ($MILLION)
TABLE 119. MALAYSIA ANHYDROUS MILK FAT MARKET, BY NATURE, 2021-2031 ($MILLION)
TABLE 120. MALAYSIA ANHYDROUS MILK FAT MARKET, BY NATURE, 2021-2031 (LITRES)
TABLE 121. MALAYSIA ANHYDROUS MILK FAT MARKET, BY APPLICATION, 2021-2031 ($MILLION)
TABLE 122. MALAYSIA ANHYDROUS MILK FAT MARKET, BY DISTRIBUTION CHANNEL, 2021-2031 ($MILLION)
TABLE 123. REST OF ASIA-PACIFIC ANHYDROUS MILK FAT MARKET, BY NATURE, 2021-2031 ($MILLION)
TABLE 124. REST OF ASIA-PACIFIC ANHYDROUS MILK FAT MARKET, BY NATURE, 2021-2031 (LITRES)
TABLE 125. REST OF ASIA-PACIFIC ANHYDROUS MILK FAT MARKET, BY APPLICATION, 2021-2031 ($MILLION)
TABLE 126. REST OF ASIA-PACIFIC ANHYDROUS MILK FAT MARKET, BY DISTRIBUTION CHANNEL, 2021-2031 ($MILLION)
TABLE 127. LAMEA ANHYDROUS MILK FAT MARKET, BY NATURE, 2021-2031 ($MILLION)
TABLE 128. LAMEA ANHYDROUS MILK FAT MARKET, BY NATURE, 2021-2031 (LITRES)
TABLE 129. LAMEA ANHYDROUS MILK FAT MARKET, BY APPLICATION, 2021-2031 ($MILLION)
TABLE 130. LAMEA ANHYDROUS MILK FAT MARKET, BY DISTRIBUTION CHANNEL, 2021-2031 ($MILLION)
TABLE 131. LAMEA OFFLINE ANHYDROUS MILK FAT MARKET, BY SUB-TYPE, 2021-2031 ($MILLION)
TABLE 132. LAMEA ANHYDROUS MILK FAT MARKET, BY COUNTRY, 2021-2031 ($MILLION)
TABLE 133. LAMEA ANHYDROUS MILK FAT MARKET, BY COUNTRY, 2021-2031 (LITRES)
TABLE 134. BRAZIL ANHYDROUS MILK FAT MARKET, BY NATURE, 2021-2031 ($MILLION)
TABLE 135. BRAZIL ANHYDROUS MILK FAT MARKET, BY NATURE, 2021-2031 (LITRES)
TABLE 136. BRAZIL ANHYDROUS MILK FAT MARKET, BY APPLICATION, 2021-2031 ($MILLION)
TABLE 137. BRAZIL ANHYDROUS MILK FAT MARKET, BY DISTRIBUTION CHANNEL, 2021-2031 ($MILLION)
TABLE 138. ARGENTINA ANHYDROUS MILK FAT MARKET, BY NATURE, 2021-2031 ($MILLION)
TABLE 139. ARGENTINA ANHYDROUS MILK FAT MARKET, BY NATURE, 2021-2031 (LITRES)
TABLE 140. ARGENTINA ANHYDROUS MILK FAT MARKET, BY APPLICATION, 2021-2031 ($MILLION)
TABLE 141. ARGENTINA ANHYDROUS MILK FAT MARKET, BY DISTRIBUTION CHANNEL, 2021-2031 ($MILLION)
TABLE 142. UNITED ARAB EMIRATES ANHYDROUS MILK FAT MARKET, BY NATURE, 2021-2031 ($MILLION)
TABLE 143. UNITED ARAB EMIRATES ANHYDROUS MILK FAT MARKET, BY NATURE, 2021-2031 (LITRES)
TABLE 144. UNITED ARAB EMIRATES ANHYDROUS MILK FAT MARKET, BY APPLICATION, 2021-2031 ($MILLION)
TABLE 145. UNITED ARAB EMIRATES ANHYDROUS MILK FAT MARKET, BY DISTRIBUTION CHANNEL, 2021-2031 ($MILLION)
TABLE 146. SAUDI ARABIA ANHYDROUS MILK FAT MARKET, BY NATURE, 2021-2031 ($MILLION)
TABLE 147. SAUDI ARABIA ANHYDROUS MILK FAT MARKET, BY NATURE, 2021-2031 (LITRES)
TABLE 148. SAUDI ARABIA ANHYDROUS MILK FAT MARKET, BY APPLICATION, 2021-2031 ($MILLION)
TABLE 149. SAUDI ARABIA ANHYDROUS MILK FAT MARKET, BY DISTRIBUTION CHANNEL, 2021-2031 ($MILLION)
TABLE 150. SOUTH AFRICA ANHYDROUS MILK FAT MARKET, BY NATURE, 2021-2031 ($MILLION)
TABLE 151. SOUTH AFRICA ANHYDROUS MILK FAT MARKET, BY NATURE, 2021-2031 (LITRES)
TABLE 152. SOUTH AFRICA ANHYDROUS MILK FAT MARKET, BY APPLICATION, 2021-2031 ($MILLION)
TABLE 153. SOUTH AFRICA ANHYDROUS MILK FAT MARKET, BY DISTRIBUTION CHANNEL, 2021-2031 ($MILLION)
TABLE 154. REST OF LAMEA ANHYDROUS MILK FAT MARKET, BY NATURE, 2021-2031 ($MILLION)
TABLE 155. REST OF LAMEA ANHYDROUS MILK FAT MARKET, BY NATURE, 2021-2031 (LITRES)
TABLE 156. REST OF LAMEA ANHYDROUS MILK FAT MARKET, BY APPLICATION, 2021-2031 ($MILLION)
TABLE 157. REST OF LAMEA ANHYDROUS MILK FAT MARKET, BY DISTRIBUTION CHANNEL, 2021-2031 ($MILLION)
TABLE 158. ASHA RAM & SONS PVT. LTD.: KEY EXECUTIVES
TABLE 159. ASHA RAM & SONS PVT. LTD.: COMPANY SNAPSHOT
TABLE 160. ASHA RAM & SONS PVT. LTD.: PRODUCT SEGMENTS
TABLE 161. ASHA RAM & SONS PVT. LTD.: PRODUCT PORTFOLIO
TABLE 162. LACTALIS GROUP: KEY EXECUTIVES
TABLE 163. LACTALIS GROUP: COMPANY SNAPSHOT
TABLE 164. LACTALIS GROUP: PRODUCT SEGMENTS
TABLE 165. LACTALIS GROUP: PRODUCT PORTFOLIO
TABLE 166. INTERFOOD HOLDING BV: KEY EXECUTIVES
TABLE 167. INTERFOOD HOLDING BV: COMPANY SNAPSHOT
TABLE 168. INTERFOOD HOLDING BV: PRODUCT SEGMENTS
TABLE 169. INTERFOOD HOLDING BV: PRODUCT PORTFOLIO
TABLE 170. INTERFOOD HOLDING BV: KEY STRATERGIES
TABLE 171. VITUSA CORP: KEY EXECUTIVES
TABLE 172. VITUSA CORP: COMPANY SNAPSHOT
TABLE 173. VITUSA CORP: PRODUCT SEGMENTS
TABLE 174. VITUSA CORP: SERVICE SEGMENTS
TABLE 175. VITUSA CORP: PRODUCT PORTFOLIO
TABLE 176. ROYAL VIVBUISMAN: KEY EXECUTIVES
TABLE 177. ROYAL VIVBUISMAN: COMPANY SNAPSHOT
TABLE 178. ROYAL VIVBUISMAN: PRODUCT SEGMENTS
TABLE 179. ROYAL VIVBUISMAN: PRODUCT PORTFOLIO
TABLE 180. POLMLEK GROUP: KEY EXECUTIVES
TABLE 181. POLMLEK GROUP: COMPANY SNAPSHOT
TABLE 182. POLMLEK GROUP: PRODUCT SEGMENTS
TABLE 183. POLMLEK GROUP: PRODUCT PORTFOLIO
TABLE 184. GLORIA ARGENTINA SA: KEY EXECUTIVES
TABLE 185. GLORIA ARGENTINA SA: COMPANY SNAPSHOT
TABLE 186. GLORIA ARGENTINA SA: PRODUCT SEGMENTS
TABLE 187. GLORIA ARGENTINA SA: PRODUCT PORTFOLIO
TABLE 188. UGA GROUP: KEY EXECUTIVES
TABLE 189. UGA GROUP: COMPANY SNAPSHOT
TABLE 190. UGA GROUP: PRODUCT SEGMENTS
TABLE 191. UGA GROUP: PRODUCT PORTFOLIO
TABLE 192. EURIAL INGREDIENTS & NUTRITION: KEY EXECUTIVES
TABLE 193. EURIAL INGREDIENTS & NUTRITION: COMPANY SNAPSHOT
TABLE 194. EURIAL INGREDIENTS & NUTRITION: PRODUCT SEGMENTS
TABLE 195. EURIAL INGREDIENTS & NUTRITION: PRODUCT PORTFOLIO
TABLE 196. ROYAL FRIESLANDCAMPINA N.V.: KEY EXECUTIVES
TABLE 197. ROYAL FRIESLANDCAMPINA N.V.: COMPANY SNAPSHOT
TABLE 198. ROYAL FRIESLANDCAMPINA N.V.: PRODUCT SEGMENTS
TABLE 199. ROYAL FRIESLANDCAMPINA N.V.: PRODUCT PORTFOLIO
TABLE 200. ROYAL FRIESLANDCAMPINA N.V.: KEY STRATERGIES LIST OF FIGURES
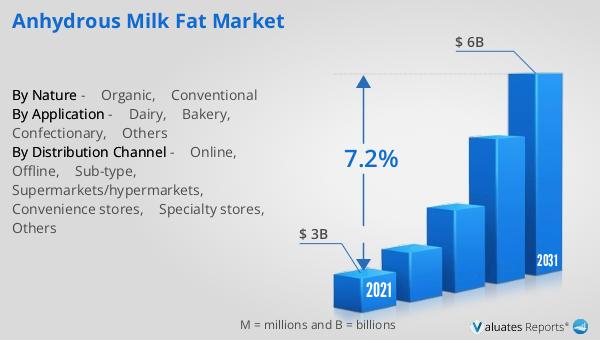
FIGURE 01. ANHYDROUS MILK FAT MARKET, 2021-2031
FIGURE 02. SEGMENTATION OF ANHYDROUS MILK FAT MARKET, 2021-2031
FIGURE 03. TOP INVESTMENT POCKETS IN ANHYDROUS MILK FAT MARKET (2022-2031)
FIGURE 04. LOW BARGAINING POWER OF SUPPLIERS
FIGURE 05. LOW BARGAINING POWER OF BUYERS
FIGURE 06. LOW THREAT OF SUBSTITUTES
FIGURE 07. LOW THREAT OF NEW ENTRANTS
FIGURE 08. LOW INTENSITY OF RIVALRY
FIGURE 09. DRIVERS, RESTRAINTS AND OPPORTUNITIES: GLOBALANHYDROUS MILK FAT MARKET
FIGURE 10. MARKET SHARE ANALYSIS: ANHYDROUS MILK FAT MARKET
FIGURE 11. PRICING ANALYSIS: ANHYDROUS MILK FAT MARKET 2021 AND 2031
FIGURE 12. VALUE CHAIN ANALYSIS: ANHYDROUS MILK FAT MARKET
FIGURE 13. ANHYDROUS MILK FAT MARKET, BY NATURE, 2021(%)
FIGURE 14. COMPARATIVE SHARE ANALYSIS OF ANHYDROUS MILK FAT MARKET FOR ORGANIC, BY COUNTRY 2021 AND 2031(%)
FIGURE 15. COMPARATIVE SHARE ANALYSIS OF ANHYDROUS MILK FAT MARKET FOR CONVENTIONAL, BY COUNTRY 2021 AND 2031(%)
FIGURE 16. ANHYDROUS MILK FAT MARKET, BY APPLICATION, 2021(%)
FIGURE 17. COMPARATIVE SHARE ANALYSIS OF ANHYDROUS MILK FAT MARKET FOR DAIRY, BY COUNTRY 2021 AND 2031(%)
FIGURE 18. COMPARATIVE SHARE ANALYSIS OF ANHYDROUS MILK FAT MARKET FOR BAKERY, BY COUNTRY 2021 AND 2031(%)
FIGURE 19. COMPARATIVE SHARE ANALYSIS OF ANHYDROUS MILK FAT MARKET FOR CONFECTIONARY, BY COUNTRY 2021 AND 2031(%)
FIGURE 20. COMPARATIVE SHARE ANALYSIS OF ANHYDROUS MILK FAT MARKET FOR OTHERS, BY COUNTRY 2021 AND 2031(%)
FIGURE 21. ANHYDROUS MILK FAT MARKET, BY DISTRIBUTION CHANNEL, 2021(%)
FIGURE 22. COMPARATIVE SHARE ANALYSIS OF ANHYDROUS MILK FAT MARKET FOR ONLINE, BY COUNTRY 2021 AND 2031(%)
FIGURE 23. COMPARATIVE SHARE ANALYSIS OF ANHYDROUS MILK FAT MARKET FOR OFFLINE, BY COUNTRY 2021 AND 2031(%)
FIGURE 24. ANHYDROUS MILK FAT MARKET BY REGION, 2021
FIGURE 25. U.S. ANHYDROUS MILK FAT MARKET, 2021-2031 ($MILLION)
FIGURE 26. CANADA ANHYDROUS MILK FAT MARKET, 2021-2031 ($MILLION)
FIGURE 27. MEXICO ANHYDROUS MILK FAT MARKET, 2021-2031 ($MILLION)
FIGURE 28. GERMANY ANHYDROUS MILK FAT MARKET, 2021-2031 ($MILLION)
FIGURE 29. NETHERLANDS ANHYDROUS MILK FAT MARKET, 2021-2031 ($MILLION)
FIGURE 30. UK ANHYDROUS MILK FAT MARKET, 2021-2031 ($MILLION)
FIGURE 31. FRANCE ANHYDROUS MILK FAT MARKET, 2021-2031 ($MILLION)
FIGURE 32. ITALY ANHYDROUS MILK FAT MARKET, 2021-2031 ($MILLION)
FIGURE 33. SPAIN ANHYDROUS MILK FAT MARKET, 2021-2031 ($MILLION)
FIGURE 34. RUSSIA ANHYDROUS MILK FAT MARKET, 2021-2031 ($MILLION)
FIGURE 35. POLAND ANHYDROUS MILK FAT MARKET, 2021-2031 ($MILLION)
FIGURE 36. REST OF EUROPE ANHYDROUS MILK FAT MARKET, 2021-2031 ($MILLION)
FIGURE 37. CHINA ANHYDROUS MILK FAT MARKET, 2021-2031 ($MILLION)
FIGURE 38. JAPAN ANHYDROUS MILK FAT MARKET, 2021-2031 ($MILLION)
FIGURE 39. INDIA ANHYDROUS MILK FAT MARKET, 2021-2031 ($MILLION)
FIGURE 40. INDONESIA ANHYDROUS MILK FAT MARKET, 2021-2031 ($MILLION)
FIGURE 41. THAILAND ANHYDROUS MILK FAT MARKET, 2021-2031 ($MILLION)
FIGURE 42. SOUTH KOREA ANHYDROUS MILK FAT MARKET, 2021-2031 ($MILLION)
FIGURE 43. VIETNAM ANHYDROUS MILK FAT MARKET, 2021-2031 ($MILLION)
FIGURE 44. MALAYSIA ANHYDROUS MILK FAT MARKET, 2021-2031 ($MILLION)
FIGURE 45. REST OF ASIA-PACIFIC ANHYDROUS MILK FAT MARKET, 2021-2031 ($MILLION)
FIGURE 46. BRAZIL ANHYDROUS MILK FAT MARKET, 2021-2031 ($MILLION)
FIGURE 47. ARGENTINA ANHYDROUS MILK FAT MARKET, 2021-2031 ($MILLION)
FIGURE 48. UNITED ARAB EMIRATES ANHYDROUS MILK FAT MARKET, 2021-2031 ($MILLION)
FIGURE 49. SAUDI ARABIA ANHYDROUS MILK FAT MARKET, 2021-2031 ($MILLION)
FIGURE 50. SOUTH AFRICA ANHYDROUS MILK FAT MARKET, 2021-2031 ($MILLION)
FIGURE 51. REST OF LAMEA ANHYDROUS MILK FAT MARKET, 2021-2031 ($MILLION)
FIGURE 52. TOP WINNING STRATEGIES, BY YEAR
FIGURE 53. TOP WINNING STRATEGIES, BY DEVELOPMENT
FIGURE 54. TOP WINNING STRATEGIES, BY COMPANY
FIGURE 55. PRODUCT MAPPING OF TOP 10 PLAYERS
FIGURE 56. COMPETITIVE DASHBOARD
FIGURE 57. COMPETITIVE HEATMAP: ANHYDROUS MILK FAT MARKET
FIGURE 58. TOP PLAYER POSITIONING, 2021
FIGURE 59. INTERFOOD HOLDING BV: NET REVENUE, 2020-2021 ($MILLION)
FIGURE 60. INTERFOOD HOLDING BV: REVENUE SHARE BY REGION, 2021 (%)
FIGURE 61. ROYAL FRIESLANDCAMPINA N.V.: NET REVENUE, 2020-2022 ($MILLION)
FIGURE 62. ROYAL FRIESLANDCAMPINA N.V.: REVENUE SHARE BY SEGMENT, 2022 (%)
FIGURE 63. ROYAL FRIESLANDCAMPINA N.V.: REVENUE SHARE BY REGION, 2022 (%
SELECT A FORMAT
Added to Cart
Electronic (PDF)

$5730

This license allows only one user to access the PDF.
Electronic (PDF)

$6450

This license allows 1 - 5 user to access the PDF, license is suitable for small groups of 5 users working together
Electronic (PDF)

$9600

This license allows users/teams in a same Enterprise to use this report, various departments within an enterpise can use this report
Electronic (PDF)

$3840

This license just provides quantitative data in a excel sheet
Add to Cart
Buy Now (15% Discount)

OUR CUSTOMER

Strategic Venue Partners

SIMILAR REPORTS


RELATED REPORTS

Global Seafood X-Ray Inspection Systems Market Research Report 2025

120 Pages
Type: Report
Code: QYRE-Auto-24V19789
Wed Dec 03 00:00:00 UTC 2025

Add to Cart

Global Bulk High Fructose Corn Syrup Market Research Report 2025

120 Pages
Type: Report
Code: QYRE-Auto-1R20137
Tue Dec 02 00:00:00 UTC 2025

Add to Cart

Global Palm Mid-Fraction Market Research Report 2025

120 Pages
Type: Report
Code: QYRE-Auto-20G18389
Thu Nov 27 00:00:00 UTC 2025

Add to Cart

Global Bread Peeling Machine Market Research Report 2025

120 Pages
Type: Report
Code: QYRE-Auto-14F20206
Tue Nov 25 00:00:00 UTC 2025

Add to Cart