28
U.S. (TOLL FREE)
+1 (315) 215-3225
Automative

28
U.S. (TOLL FREE)
+1 (315) 215-3225
Storage as a Service Market By Type (Cloud NAS, Cloud SAN, Cloud Backup, Cloud Archiving), By Enterprise Size (Large Enterprises, Small and Medium-sized Enterprises), By Application (IT and Telecom, BFSI, Retail and E-commerce, Healthcare, Government, Media and Entertainment, Others): Global Opportunity Analysis and Industry Forecast, 2023-2032
Published Date: October 2023
|
Report Code: ALLI-Auto-3E635
Home | Market Reports | Internet & Telecom| Web Services
Storage as a Service Market By Type Cloud NAS Cloud SAN Cloud Backup Cloud Archiving By Enterprise Size Large Enterprises Small and Medium sized Enterprises By Application IT and Telecom BFSI Retail and E commerce Healthcare Government Media and Entertainment Others Global Opportunity Analysis and Industry Forecast 2023 2032
BUY CHAPTERS

Storage as a Service Market By Type (Cloud NAS, Cloud SAN, Cloud Backup, Cloud Archiving), By Enterprise Size (Large Enterprises, Small and Medium-sized Enterprises), By Application (IT and Telecom, BFSI, Retail and E-commerce, Healthcare, Government, Media and Entertainment, Others): Global Opportunity Analysis and Industry Forecast, 2023-2032

Code: ALLI-Auto-3E635
Report
October 2023
Pages:251
Allied Market Research
Buy Now with 15% Discount
DESCRIPTION
TABLE OF CONTENT
TABLES & FIGURES

Storage as a Service Market Size

According to a new report published by , titled, “Storage as a Service Market," The storage as a service market was valued at $34 billion in 2022, and is estimated to reach $396.5 billion by 2032, growing at a CAGR of 28.2% from 2023 to 2032.

Storage as a Service Market

Storage as a Service Market

The Storage as a Service Market is likely to experience a significant growth rate of 28.2% from 2023-2032, owing to the rise in market demand for storage as a service in IT and Telecom sector–
Storage as a service (STaaS) is a managed service in which the provider supplies the customer with access to a data storage platform. The service can be delivered on premises from infrastructure that is dedicated to a single customer, or it can be delivered from the public cloud as a shared service that's purchased by subscription and is billed according to one or more usage metrics.
STaaS customers access individual storage services through standard system interface protocols or application program interfaces (APIs). Typical offerings include bare-metal storage capacity; raw storage volumes; network file systems; storage objects; and storage applications that support file sharing and backup lifecycle management. Moreover, STaaS was originally seen as a cost-effective way for small and mid-size businesses that lacked the technical personnel and capital budget to implement and maintain their own storage infrastructure. Hence, companies of all sizes use storage as a service.
The key drivers for storage as a market are the need to orchestrate cloud-based storage systems, the need to gather, manage and extract value from big data, the increased need for data archiving and government requirements. However, cloud data security concern, bandwidth limitations, and interoperability issues are restricting the growth of the storage as a service market. Moreover, increasing availability of digital infrastructure and the growing usage of mobile devices are anticipated to propel the growth of global storage as a service market during the forecast period. In addition, the surge in technological advancements, which in turn is expected to create numerous opportunities for the market growth in the upcoming years.  Furthermore, increasing demand of digital solution and rise in integration of industry 4.0, which creates lucrative opportunities for storage as a service during the forecast period.
The storage as a service market is segmented on the basis of type, organization size, application and region. According to the type, the market is classified into cloud NAS, cloud SAN, cloud backup and cloud archiving. Based on the organization size, the market is classified into small and medium-sized enterprises and large enterprises. On the basis of application, the market is classified into BFSI, IT and telecom, retail & e-commerce, healthcare, government, media entertainment and others. In addition, it analyzes the current market trends across different regions such as North America, Europe, Asia-Pacific, and LAMEA.
The market players operating in the global Storage as a service market. This report further outlines the current trends and key areas of investment. In addition, it includes Porter’s five forces analysis to understand the competitive scenario of the industry and role of each stakeholder. The report features the strategies adopted by key market players to maintain their foothold in the market. Furthermore, it highlights the competitive landscape of key market players to increase their market share and sustain intense competition in the industry. The key players operating in the market include IBM Corporation, Microsoft Corporation, AWS Inc., HPE, Google LLC, Dell Technologies, Rackspace Inc., AT&T, Quantum Corporation, and Cloudian, Inc For instance, in July 2023, DigiBoxx launched a new data storage solution namely, Megh3 for corporates and individuals. It provides customers with fast, simple, elastic storage solutions at their fingertips at attractive pricing, combining both simplicity and affordability, the domestic software as a service (SaaS) based digital storage platform. In addition, in September 2023, Amazon Web Services launched seven new cloud storage offerings and features to improve AI and ML workloads, data protection and resiliency, and new support for NetApp, Cloudfare and Oracle storage products. Such instances are further expected to provide lucrative opportunities for the global market.
Key Market Insights
By type, the cloud backup segment was the highest revenue contributor to the market in 2022, and is estimated to reach $123487.61 million by 2032, with a CAGR of 25.0%. However, the cloud archiving segment is expected to be the fastest-growing segment during the forecast period.
By Enterprise Size, the Large Enterprises segment was the highest revenue contributor to the market in 2022, and is estimated to reach $242030.7 million by 2032, with a CAGR of 26.9%. However, the small and medium-sized enterprises segment is estimated to be the fastest-growing segment with a CAGR of 30.7% during the forecast period.
By application, the IT and telecom sector was the highest revenue contributor to the market in 2022, and is estimated to reach $84980.64 million by 2032, with a CAGR of 16.4%. However, the healthcare sector is estimated to be the fastest-growing segment during the forecast period.
Region-wise, North America was the highest revenue contributor, accounting for $12631.85 million in 2022 and is estimated to reach $116659.63 million by 2032, with a CAGR of 25.2%.

Overview

Storage as a service (STaaS) is a managed service in which the provider supplies the customer with access to a data storage platform. The service can be delivered on premises from infrastructure that is dedicated to a single customer, or it can be delivered from the public cloud as a shared service that's purchased by subscription and is billed according to one or more usage metrics.
STaaS customers access individual storage services through standard system interface protocols or application program interfaces (APIs). Typical offerings include bare-metal storage capacity; raw storage volumes; network file systems; storage objects; and storage applications that support file sharing and backup lifecycle management. Moreover, STaaS was originally seen as a cost-effective way for small and mid-size businesses that lacked the technical personnel and capital budget to implement and maintain their own storage infrastructure. Hence, companies of all sizes use storage as a service.
The key drivers for storage as a market are the need to orchestrate cloud-based storage systems, the need to gather, manage and extract value from big data, the increased need for data archiving and government requirements. However, cloud data security concern, bandwidth limitations, and interoperability issues are restricting the growth of the storage as a service market. Moreover, increasing availability of digital infrastructure and the growing usage of mobile devices are anticipated to propel the growth of global storage as a service market during the forecast period. In addition, the surge in technological advancements, which in turn is expected to create numerous opportunities for the market growth in the upcoming years. Furthermore, increasing demand of digital solution and rise in integration of industry 4.0, which creates lucrative opportunities for storage as a service during the forecast period.
The storage as a service market is segmented on the basis of type, organization size, application and region. According to the type, the market is classified into cloud NAS, cloud SAN, cloud backup and cloud archiving. Based on the organization size, the market is classified into small and medium-sized enterprises and large enterprises. On the basis of application, the market is classified into BFSI, IT and telecom, retail & e-commerce, healthcare, government, media entertainment and others. In addition, it analyzes the current market trends across different regions such as North America, Europe, Asia-Pacific, and LAMEA.
The market players operating in the storage as a service market are IBM Corporation, Microsoft Corporation, AWS Inc., HPE, Google LLC, Dell Technologies, Rackspace Inc., AT&T, Quantum Corporation, and Cloudian, Inc.  These major players have adopted various key development strategies such as business expansion, new product launches, and partnerships, which help to drive the growth of the storage as a service market globally.

Key Benefits for Stakeholders  

●The study provides an in-depth analysis of the global storage as a service market forecast along with the current & future trends to explain the imminent investment pockets.
●Information about key drivers, restraints, & opportunities and their impact analysis on global storage as a service market trends is provided in the report.
●Porter’s five forces analysis illustrates the potency of the buyers and suppliers operating in the industry.
●The quantitative analysis of the market from 2022 to 2032 is provided to determine the market potential.

Additional benefits you will get with this purchase are:

● Quarterly Update and* (only available with a corporate license, on listed price)
● 5 additional Company Profile of client Choice pre- or Post-purchase, as a free update.
● Free Upcoming Version on the Purchase of Five and Enterprise User License.
● 16 analyst hours of support* (post-purchase, if you find additional data requirements upon review of the report, you may receive support amounting to 16 analyst hours to solve questions, and post-sale queries)
● 15% Free Customization* (in case the scope or segment of the report does not match your requirements, 15% is equivalent to 3 working days of free work, applicable once)
● Free data Pack on the Five and Enterprise User License. (Excel version of the report)
● Free Updated report if the report is 6-12 months old or older.
● 24-hour priority response*
● Free Industry updates and white papers.
Possible Customization with this report (with additional cost and timeline, please talk to the sales executive to know more)
● Investment Opportunities
● Technology Trend Analysis
● Regulatory Guidelines
● Strategic Recommedations
● SWOT Analysis
Key Market Segments
○ Rackspace Techonolog

Scope of Storage as a Service Market Report

Report Metric Details
Report Name Storage as a Service Market
Accounted market size in 2022 $ 34 in billion
Forecasted market size in 2032 $ 396.5 billion
CAGR 28.2%
Base Year 2022
Forecasted years 2024 - 2032
By Type ● Cloud NAS
● Cloud SAN
● Cloud Backup
● Cloud Archiving
By Enterprise Size ● Large Enterprises
● Small and Medium-sized Enterprises
By Application ● IT and Telecom
● BFSI
● Retail and E-commerce
● Healthcare
● Government
● Media and Entertainment
● Others
By Region
  • North America (United States, Canada)
  • Europe (Germany, France, UK, Italy, Russia) Rest of Europe
  • Nordic Countries
  • Asia-Pacific (China, Japan, South Korea)
  • Southeast Asia (India, Australia)
  • Rest of Asia
  • Latin America (Mexico, Brazil)
  • Rest of Latin America
  • Middle East & Africa (Turkey, Saudi Arabia, UAE, Rest of MEA)
Forecast units USD million in value
Report coverage Revenue and volume forecast, company share, competitive landscape, growth factors and trends

FAQ for this report

How fast is Storage as a Service Market growing?

Ans: The Storage as a Service Market witnessing a CAGR of 28.2% during the forecast period 2024-2032.

What is the Storage as a Service Market size in 2032?

Ans: The Storage as a Service Market size in 2032 will be $ 396.5 billion.

What are the Application segmentation covered in the Storage as a Service Market report?

Ans: The Applications covered in the Storage as a Service Market report are ● IT and Telecom, ● BFSI, ● Retail and E-commerce, ● Healthcare, ● Government, ● Media and Entertainment, ● Others

What are the Type segmentation covered in the Storage as a Service Market report?

Ans: The Types covered in the Storage as a Service Market report are ● Cloud NAS, ● Cloud SAN, ● Cloud Backup, ● Cloud Archiving

CHAPTER 1: INTRODUCTION
1.1. Report description
1.2. Key market segments
1.3. Key benefits to the stakeholders
1.4. Research methodology
1.4.1. Primary research
1.4.2. Secondary research
1.4.3. Analyst tools and models
CHAPTER 2: EXECUTIVE SUMMARY
2.1. CXO Perspective
CHAPTER 3: MARKET OVERVIEW
3.1. Market definition and scope
3.2. Key findings
3.2.1. Top impacting factors
3.2.2. Top investment pockets
3.3. Porter’s five forces analysis
3.3.1. Moderate bargaining power of suppliers
3.3.2. Low-to-high threat of new entrants
3.3.3. Moderate-to-high threat of substitutes
3.3.4. High intensity of rivalry
3.3.5. Moderate bargaining power of buyers
3.4. Market dynamics
3.4.1. Drivers
3.4.1.1. Surge in demand for flexible and dependable STaaS
3.4.1.2. Increase in volume of data
3.4.2. Restraints
3.4.2.1. Data privacy and security concerns
3.4.3. Opportunities
3.4.3.1. Rise in adoption of cloud-based services
3.5. Regulatory Guidelines
CHAPTER 4: STORAGE AS A SERVICE MARKET, BY TYPE
4.1. Overview
4.1.1. Market size and forecast
4.2. Cloud NAS
4.2.1. Key market trends, growth factors and opportunities
4.2.2. Market size and forecast, by region
4.2.3. Market share analysis by country
4.3. Cloud SAN
4.3.1. Key market trends, growth factors and opportunities
4.3.2. Market size and forecast, by region
4.3.3. Market share analysis by country
4.4. Cloud Backup
4.4.1. Key market trends, growth factors and opportunities
4.4.2. Market size and forecast, by region
4.4.3. Market share analysis by country
4.5. Cloud Archiving
4.5.1. Key market trends, growth factors and opportunities
4.5.2. Market size and forecast, by region
4.5.3. Market share analysis by country
CHAPTER 5: STORAGE AS A SERVICE MARKET, BY ENTERPRISE SIZE
5.1. Overview
5.1.1. Market size and forecast
5.2. Large Enterprises
5.2.1. Key market trends, growth factors and opportunities
5.2.2. Market size and forecast, by region
5.2.3. Market share analysis by country
5.3. Small and Medium-sized Enterprises
5.3.1. Key market trends, growth factors and opportunities
5.3.2. Market size and forecast, by region
5.3.3. Market share analysis by country
CHAPTER 6: STORAGE AS A SERVICE MARKET, BY APPLICATION
6.1. Overview
6.1.1. Market size and forecast
6.2. IT and Telecom
6.2.1. Key market trends, growth factors and opportunities
6.2.2. Market size and forecast, by region
6.2.3. Market share analysis by country
6.3. BFSI
6.3.1. Key market trends, growth factors and opportunities
6.3.2. Market size and forecast, by region
6.3.3. Market share analysis by country
6.4. Retail and E-commerce
6.4.1. Key market trends, growth factors and opportunities
6.4.2. Market size and forecast, by region
6.4.3. Market share analysis by country
6.5. Healthcare
6.5.1. Key market trends, growth factors and opportunities
6.5.2. Market size and forecast, by region
6.5.3. Market share analysis by country
6.6. Government
6.6.1. Key market trends, growth factors and opportunities
6.6.2. Market size and forecast, by region
6.6.3. Market share analysis by country
6.7. Media and Entertainment
6.7.1. Key market trends, growth factors and opportunities
6.7.2. Market size and forecast, by region
6.7.3. Market share analysis by country
6.8. Others
6.8.1. Key market trends, growth factors and opportunities
6.8.2. Market size and forecast, by region
6.8.3. Market share analysis by country
CHAPTER 7: STORAGE AS A SERVICE MARKET, BY REGION
7.1. Overview
7.1.1. Market size and forecast By Region
7.2. North America
7.2.1. Key market trends, growth factors and opportunities
7.2.2. Market size and forecast, by Type
7.2.3. Market size and forecast, by Enterprise Size
7.2.4. Market size and forecast, by Application
7.2.5. Market size and forecast, by country
7.2.5.1. U.S.
7.2.5.1.1. Market size and forecast, by Type
7.2.5.1.2. Market size and forecast, by Enterprise Size
7.2.5.1.3. Market size and forecast, by Application
7.2.5.2. Canada
7.2.5.2.1. Market size and forecast, by Type
7.2.5.2.2. Market size and forecast, by Enterprise Size
7.2.5.2.3. Market size and forecast, by Application
7.3. Europe
7.3.1. Key market trends, growth factors and opportunities
7.3.2. Market size and forecast, by Type
7.3.3. Market size and forecast, by Enterprise Size
7.3.4. Market size and forecast, by Application
7.3.5. Market size and forecast, by country
7.3.5.1. UK
7.3.5.1.1. Market size and forecast, by Type
7.3.5.1.2. Market size and forecast, by Enterprise Size
7.3.5.1.3. Market size and forecast, by Application
7.3.5.2. Germany
7.3.5.2.1. Market size and forecast, by Type
7.3.5.2.2. Market size and forecast, by Enterprise Size
7.3.5.2.3. Market size and forecast, by Application
7.3.5.3. France
7.3.5.3.1. Market size and forecast, by Type
7.3.5.3.2. Market size and forecast, by Enterprise Size
7.3.5.3.3. Market size and forecast, by Application
7.3.5.4. Italy
7.3.5.4.1. Market size and forecast, by Type
7.3.5.4.2. Market size and forecast, by Enterprise Size
7.3.5.4.3. Market size and forecast, by Application
7.3.5.5. Spain
7.3.5.5.1. Market size and forecast, by Type
7.3.5.5.2. Market size and forecast, by Enterprise Size
7.3.5.5.3. Market size and forecast, by Application
7.3.5.6. Rest of Europe
7.3.5.6.1. Market size and forecast, by Type
7.3.5.6.2. Market size and forecast, by Enterprise Size
7.3.5.6.3. Market size and forecast, by Application
7.4. Asia-Pacific
7.4.1. Key market trends, growth factors and opportunities
7.4.2. Market size and forecast, by Type
7.4.3. Market size and forecast, by Enterprise Size
7.4.4. Market size and forecast, by Application
7.4.5. Market size and forecast, by country
7.4.5.1. China
7.4.5.1.1. Market size and forecast, by Type
7.4.5.1.2. Market size and forecast, by Enterprise Size
7.4.5.1.3. Market size and forecast, by Application
7.4.5.2. Japan
7.4.5.2.1. Market size and forecast, by Type
7.4.5.2.2. Market size and forecast, by Enterprise Size
7.4.5.2.3. Market size and forecast, by Application
7.4.5.3. India
7.4.5.3.1. Market size and forecast, by Type
7.4.5.3.2. Market size and forecast, by Enterprise Size
7.4.5.3.3. Market size and forecast, by Application
7.4.5.4. Australia
7.4.5.4.1. Market size and forecast, by Type
7.4.5.4.2. Market size and forecast, by Enterprise Size
7.4.5.4.3. Market size and forecast, by Application
7.4.5.5. South Korea
7.4.5.5.1. Market size and forecast, by Type
7.4.5.5.2. Market size and forecast, by Enterprise Size
7.4.5.5.3. Market size and forecast, by Application
7.4.5.6. Rest of Asia-Pacific
7.4.5.6.1. Market size and forecast, by Type
7.4.5.6.2. Market size and forecast, by Enterprise Size
7.4.5.6.3. Market size and forecast, by Application
7.5. LAMEA
7.5.1. Key market trends, growth factors and opportunities
7.5.2. Market size and forecast, by Type
7.5.3. Market size and forecast, by Enterprise Size
7.5.4. Market size and forecast, by Application
7.5.5. Market size and forecast, by country
7.5.5.1. Latin America
7.5.5.1.1. Market size and forecast, by Type
7.5.5.1.2. Market size and forecast, by Enterprise Size
7.5.5.1.3. Market size and forecast, by Application
7.5.5.2. Middle East
7.5.5.2.1. Market size and forecast, by Type
7.5.5.2.2. Market size and forecast, by Enterprise Size
7.5.5.2.3. Market size and forecast, by Application
7.5.5.3. Africa
7.5.5.3.1. Market size and forecast, by Type
7.5.5.3.2. Market size and forecast, by Enterprise Size
7.5.5.3.3. Market size and forecast, by Application
CHAPTER 8: COMPETITIVE LANDSCAPE
8.1. Introduction
8.2. Top winning strategies
8.3. Product mapping of top 10 player
8.4. Competitive dashboard
8.5. Competitive heatmap
8.6. Top player positioning, 2022
CHAPTER 9: COMPANY PROFILES
9.1. IBM Corporation
9.1.1. Company overview
9.1.2. Key executives
9.1.3. Company snapshot
9.1.4. Operating business segments
9.1.5. Product portfolio
9.1.6. Business performance
9.1.7. Key strategic moves and developments
9.2. Microsoft Corporation
9.2.1. Company overview
9.2.2. Key executives
9.2.3. Company snapshot
9.2.4. Operating business segments
9.2.5. Product portfolio
9.2.6. Business performance
9.2.7. Key strategic moves and developments
9.3. Amazon Web Services, Inc.
9.3.1. Company overview
9.3.2. Key executives
9.3.3. Company snapshot
9.3.4. Operating business segments
9.3.5. Product portfolio
9.3.6. Business performance
9.3.7. Key strategic moves and developments
9.4. Dell Technologies
9.4.1. Company overview
9.4.2. Key executives
9.4.3. Company snapshot
9.4.4. Operating business segments
9.4.5. Product portfolio
9.4.6. Business performance
9.4.7. Key strategic moves and developments
9.5. Rackspace Techonology
9.5.1. Company overview
9.5.2. Key executives
9.5.3. Company snapshot
9.5.4. Operating business segments
9.5.5. Product portfolio
9.5.6. Business performance
9.5.7. Key strategic moves and developments
9.6. AT&T
9.6.1. Company overview
9.6.2. Key executives
9.6.3. Company snapshot
9.6.4. Operating business segments
9.6.5. Product portfolio
9.6.6. Business performance
9.7. Quantum Corporation
9.7.1. Company overview
9.7.2. Key executives
9.7.3. Company snapshot
9.7.4. Operating business segments
9.7.5. Product portfolio
9.7.6. Business performance
9.7.7. Key strategic moves and developments
9.8. Cloudian, Inc.
9.8.1. Company overview
9.8.2. Key executives
9.8.3. Company snapshot
9.8.4. Operating business segments
9.8.5. Product portfolio
9.8.6. Key strategic moves and developments
9.9. Hewlett Packard Enterprise Development LP
9.9.1. Company overview
9.9.2. Key executives
9.9.3. Company snapshot
9.9.4. Operating business segments
9.9.5. Product portfolio
9.9.6. Business performance
9.9.7. Key strategic moves and developments
9.10. Google LLC (Alphabet Inc.)
9.10.1. Company overview
9.10.2. Key executives
9.10.3. Company snapshot
9.10.4. Operating business segments
9.10.5. Product portfolio
9.10.6. Business performance
9.10.7. Key strategic moves and development
LIST OF TABLES
TABLE 01. GLOBAL STORAGE AS A SERVICE MARKET, BY TYPE, 2022-2032 ($MILLION)
TABLE 02. STORAGE AS A SERVICE MARKET FOR CLOUD NAS, BY REGION, 2022-2032 ($MILLION)
TABLE 03. STORAGE AS A SERVICE MARKET FOR CLOUD SAN, BY REGION, 2022-2032 ($MILLION)
TABLE 04. STORAGE AS A SERVICE MARKET FOR CLOUD BACKUP, BY REGION, 2022-2032 ($MILLION)
TABLE 05. STORAGE AS A SERVICE MARKET FOR CLOUD ARCHIVING, BY REGION, 2022-2032 ($MILLION)
TABLE 06. GLOBAL STORAGE AS A SERVICE MARKET, BY ENTERPRISE SIZE, 2022-2032 ($MILLION)
TABLE 07. STORAGE AS A SERVICE MARKET FOR LARGE ENTERPRISES, BY REGION, 2022-2032 ($MILLION)
TABLE 08. STORAGE AS A SERVICE MARKET FOR SMALL AND MEDIUM-SIZED ENTERPRISES, BY REGION, 2022-2032 ($MILLION)
TABLE 09. GLOBAL STORAGE AS A SERVICE MARKET, BY APPLICATION, 2022-2032 ($MILLION)
TABLE 10. STORAGE AS A SERVICE MARKET FOR IT AND TELECOM, BY REGION, 2022-2032 ($MILLION)
TABLE 11. STORAGE AS A SERVICE MARKET FOR BFSI, BY REGION, 2022-2032 ($MILLION)
TABLE 12. STORAGE AS A SERVICE MARKET FOR RETAIL AND E-COMMERCE, BY REGION, 2022-2032 ($MILLION)
TABLE 13. STORAGE AS A SERVICE MARKET FOR HEALTHCARE, BY REGION, 2022-2032 ($MILLION)
TABLE 14. STORAGE AS A SERVICE MARKET FOR GOVERNMENT, BY REGION, 2022-2032 ($MILLION)
TABLE 15. STORAGE AS A SERVICE MARKET FOR MEDIA AND ENTERTAINMENT, BY REGION, 2022-2032 ($MILLION)
TABLE 16. STORAGE AS A SERVICE MARKET FOR OTHERS, BY REGION, 2022-2032 ($MILLION)
TABLE 17. STORAGE AS A SERVICE MARKET, BY REGION, 2022-2032 ($MILLION)
TABLE 18. NORTH AMERICA STORAGE AS A SERVICE MARKET, BY TYPE, 2022-2032 ($MILLION)
TABLE 19. NORTH AMERICA STORAGE AS A SERVICE MARKET, BY ENTERPRISE SIZE, 2022-2032 ($MILLION)
TABLE 20. NORTH AMERICA STORAGE AS A SERVICE MARKET, BY APPLICATION, 2022-2032 ($MILLION)
TABLE 21. NORTH AMERICA STORAGE AS A SERVICE MARKET, BY COUNTRY, 2022-2032 ($MILLION)
TABLE 22. U.S. STORAGE AS A SERVICE MARKET, BY TYPE, 2022-2032 ($MILLION)
TABLE 23. U.S. STORAGE AS A SERVICE MARKET, BY ENTERPRISE SIZE, 2022-2032 ($MILLION)
TABLE 24. U.S. STORAGE AS A SERVICE MARKET, BY APPLICATION, 2022-2032 ($MILLION)
TABLE 25. CANADA STORAGE AS A SERVICE MARKET, BY TYPE, 2022-2032 ($MILLION)
TABLE 26. CANADA STORAGE AS A SERVICE MARKET, BY ENTERPRISE SIZE, 2022-2032 ($MILLION)
TABLE 27. CANADA STORAGE AS A SERVICE MARKET, BY APPLICATION, 2022-2032 ($MILLION)
TABLE 28. EUROPE STORAGE AS A SERVICE MARKET, BY TYPE, 2022-2032 ($MILLION)
TABLE 29. EUROPE STORAGE AS A SERVICE MARKET, BY ENTERPRISE SIZE, 2022-2032 ($MILLION)
TABLE 30. EUROPE STORAGE AS A SERVICE MARKET, BY APPLICATION, 2022-2032 ($MILLION)
TABLE 31. EUROPE STORAGE AS A SERVICE MARKET, BY COUNTRY, 2022-2032 ($MILLION)
TABLE 32. UK STORAGE AS A SERVICE MARKET, BY TYPE, 2022-2032 ($MILLION)
TABLE 33. UK STORAGE AS A SERVICE MARKET, BY ENTERPRISE SIZE, 2022-2032 ($MILLION)
TABLE 34. UK STORAGE AS A SERVICE MARKET, BY APPLICATION, 2022-2032 ($MILLION)
TABLE 35. GERMANY STORAGE AS A SERVICE MARKET, BY TYPE, 2022-2032 ($MILLION)
TABLE 36. GERMANY STORAGE AS A SERVICE MARKET, BY ENTERPRISE SIZE, 2022-2032 ($MILLION)
TABLE 37. GERMANY STORAGE AS A SERVICE MARKET, BY APPLICATION, 2022-2032 ($MILLION)
TABLE 38. FRANCE STORAGE AS A SERVICE MARKET, BY TYPE, 2022-2032 ($MILLION)
TABLE 39. FRANCE STORAGE AS A SERVICE MARKET, BY ENTERPRISE SIZE, 2022-2032 ($MILLION)
TABLE 40. FRANCE STORAGE AS A SERVICE MARKET, BY APPLICATION, 2022-2032 ($MILLION)
TABLE 41. ITALY STORAGE AS A SERVICE MARKET, BY TYPE, 2022-2032 ($MILLION)
TABLE 42. ITALY STORAGE AS A SERVICE MARKET, BY ENTERPRISE SIZE, 2022-2032 ($MILLION)
TABLE 43. ITALY STORAGE AS A SERVICE MARKET, BY APPLICATION, 2022-2032 ($MILLION)
TABLE 44. SPAIN STORAGE AS A SERVICE MARKET, BY TYPE, 2022-2032 ($MILLION)
TABLE 45. SPAIN STORAGE AS A SERVICE MARKET, BY ENTERPRISE SIZE, 2022-2032 ($MILLION)
TABLE 46. SPAIN STORAGE AS A SERVICE MARKET, BY APPLICATION, 2022-2032 ($MILLION)
TABLE 47. REST OF EUROPE STORAGE AS A SERVICE MARKET, BY TYPE, 2022-2032 ($MILLION)
TABLE 48. REST OF EUROPE STORAGE AS A SERVICE MARKET, BY ENTERPRISE SIZE, 2022-2032 ($MILLION)
TABLE 49. REST OF EUROPE STORAGE AS A SERVICE MARKET, BY APPLICATION, 2022-2032 ($MILLION)
TABLE 50. ASIA-PACIFIC STORAGE AS A SERVICE MARKET, BY TYPE, 2022-2032 ($MILLION)
TABLE 51. ASIA-PACIFIC STORAGE AS A SERVICE MARKET, BY ENTERPRISE SIZE, 2022-2032 ($MILLION)
TABLE 52. ASIA-PACIFIC STORAGE AS A SERVICE MARKET, BY APPLICATION, 2022-2032 ($MILLION)
TABLE 53. ASIA-PACIFIC STORAGE AS A SERVICE MARKET, BY COUNTRY, 2022-2032 ($MILLION)
TABLE 54. CHINA STORAGE AS A SERVICE MARKET, BY TYPE, 2022-2032 ($MILLION)
TABLE 55. CHINA STORAGE AS A SERVICE MARKET, BY ENTERPRISE SIZE, 2022-2032 ($MILLION)
TABLE 56. CHINA STORAGE AS A SERVICE MARKET, BY APPLICATION, 2022-2032 ($MILLION)
TABLE 57. JAPAN STORAGE AS A SERVICE MARKET, BY TYPE, 2022-2032 ($MILLION)
TABLE 58. JAPAN STORAGE AS A SERVICE MARKET, BY ENTERPRISE SIZE, 2022-2032 ($MILLION)
TABLE 59. JAPAN STORAGE AS A SERVICE MARKET, BY APPLICATION, 2022-2032 ($MILLION)
TABLE 60. INDIA STORAGE AS A SERVICE MARKET, BY TYPE, 2022-2032 ($MILLION)
TABLE 61. INDIA STORAGE AS A SERVICE MARKET, BY ENTERPRISE SIZE, 2022-2032 ($MILLION)
TABLE 62. INDIA STORAGE AS A SERVICE MARKET, BY APPLICATION, 2022-2032 ($MILLION)
TABLE 63. AUSTRALIA STORAGE AS A SERVICE MARKET, BY TYPE, 2022-2032 ($MILLION)
TABLE 64. AUSTRALIA STORAGE AS A SERVICE MARKET, BY ENTERPRISE SIZE, 2022-2032 ($MILLION)
TABLE 65. AUSTRALIA STORAGE AS A SERVICE MARKET, BY APPLICATION, 2022-2032 ($MILLION)
TABLE 66. SOUTH KOREA STORAGE AS A SERVICE MARKET, BY TYPE, 2022-2032 ($MILLION)
TABLE 67. SOUTH KOREA STORAGE AS A SERVICE MARKET, BY ENTERPRISE SIZE, 2022-2032 ($MILLION)
TABLE 68. SOUTH KOREA STORAGE AS A SERVICE MARKET, BY APPLICATION, 2022-2032 ($MILLION)
TABLE 69. REST OF ASIA-PACIFIC STORAGE AS A SERVICE MARKET, BY TYPE, 2022-2032 ($MILLION)
TABLE 70. REST OF ASIA-PACIFIC STORAGE AS A SERVICE MARKET, BY ENTERPRISE SIZE, 2022-2032 ($MILLION)
TABLE 71. REST OF ASIA-PACIFIC STORAGE AS A SERVICE MARKET, BY APPLICATION, 2022-2032 ($MILLION)
TABLE 72. LAMEA STORAGE AS A SERVICE MARKET, BY TYPE, 2022-2032 ($MILLION)
TABLE 73. LAMEA STORAGE AS A SERVICE MARKET, BY ENTERPRISE SIZE, 2022-2032 ($MILLION)
TABLE 74. LAMEA STORAGE AS A SERVICE MARKET, BY APPLICATION, 2022-2032 ($MILLION)
TABLE 75. LAMEA STORAGE AS A SERVICE MARKET, BY COUNTRY, 2022-2032 ($MILLION)
TABLE 76. LATIN AMERICA STORAGE AS A SERVICE MARKET, BY TYPE, 2022-2032 ($MILLION)
TABLE 77. LATIN AMERICA STORAGE AS A SERVICE MARKET, BY ENTERPRISE SIZE, 2022-2032 ($MILLION)
TABLE 78. LATIN AMERICA STORAGE AS A SERVICE MARKET, BY APPLICATION, 2022-2032 ($MILLION)
TABLE 79. MIDDLE EAST STORAGE AS A SERVICE MARKET, BY TYPE, 2022-2032 ($MILLION)
TABLE 80. MIDDLE EAST STORAGE AS A SERVICE MARKET, BY ENTERPRISE SIZE, 2022-2032 ($MILLION)
TABLE 81. MIDDLE EAST STORAGE AS A SERVICE MARKET, BY APPLICATION, 2022-2032 ($MILLION)
TABLE 82. AFRICA STORAGE AS A SERVICE MARKET, BY TYPE, 2022-2032 ($MILLION)
TABLE 83. AFRICA STORAGE AS A SERVICE MARKET, BY ENTERPRISE SIZE, 2022-2032 ($MILLION)
TABLE 84. AFRICA STORAGE AS A SERVICE MARKET, BY APPLICATION, 2022-2032 ($MILLION)
TABLE 85. IBM CORPORATION: KEY EXECUTIVES
TABLE 86. IBM CORPORATION: COMPANY SNAPSHOT
TABLE 87. IBM CORPORATION: SERVICE SEGMENTS
TABLE 88. IBM CORPORATION: PRODUCT PORTFOLIO
TABLE 89. IBM CORPORATION: KEY STRATERGIES
TABLE 90. MICROSOFT CORPORATION: KEY EXECUTIVES
TABLE 91. MICROSOFT CORPORATION: COMPANY SNAPSHOT
TABLE 92. MICROSOFT CORPORATION: SERVICE SEGMENTS
TABLE 93. MICROSOFT CORPORATION: PRODUCT PORTFOLIO
TABLE 94. MICROSOFT CORPORATION: KEY STRATERGIES
TABLE 95. AMAZON WEB SERVICES, INC.: KEY EXECUTIVES
TABLE 96. AMAZON WEB SERVICES, INC.: COMPANY SNAPSHOT
TABLE 97. AMAZON WEB SERVICES, INC.: SERVICE SEGMENTS
TABLE 98. AMAZON WEB SERVICES, INC.: PRODUCT PORTFOLIO
TABLE 99. AMAZON WEB SERVICES, INC.: KEY STRATERGIES
TABLE 100. DELL TECHNOLOGIES: KEY EXECUTIVES
TABLE 101. DELL TECHNOLOGIES: COMPANY SNAPSHOT
TABLE 102. DELL TECHNOLOGIES: SERVICE SEGMENTS
TABLE 103. DELL TECHNOLOGIES: PRODUCT PORTFOLIO
TABLE 104. DELL TECHNOLOGIES: KEY STRATERGIES
TABLE 105. RACKSPACE TECHONOLOGY: KEY EXECUTIVES
TABLE 106. RACKSPACE TECHONOLOGY: COMPANY SNAPSHOT
TABLE 107. RACKSPACE TECHONOLOGY: SERVICE SEGMENTS
TABLE 108. RACKSPACE TECHONOLOGY: PRODUCT PORTFOLIO
TABLE 109. RACKSPACE TECHONOLOGY: KEY STRATERGIES
TABLE 110. AT&T: KEY EXECUTIVES
TABLE 111. AT&T: COMPANY SNAPSHOT
TABLE 112. AT&T: PRODUCT SEGMENTS
TABLE 113. AT&T: PRODUCT PORTFOLIO
TABLE 114. QUANTUM CORPORATION: KEY EXECUTIVES
TABLE 115. QUANTUM CORPORATION: COMPANY SNAPSHOT
TABLE 116. QUANTUM CORPORATION: SERVICE SEGMENTS
TABLE 117. QUANTUM CORPORATION: PRODUCT PORTFOLIO
TABLE 118. QUANTUM CORPORATION: KEY STRATERGIES
TABLE 119. CLOUDIAN, INC.: KEY EXECUTIVES
TABLE 120. CLOUDIAN, INC.: COMPANY SNAPSHOT
TABLE 121. CLOUDIAN, INC.: SERVICE SEGMENTS
TABLE 122. CLOUDIAN, INC.: PRODUCT PORTFOLIO
TABLE 123. CLOUDIAN, INC.: KEY STRATERGIES
TABLE 124. HEWLETT PACKARD ENTERPRISE DEVELOPMENT LP: KEY EXECUTIVES
TABLE 125. HEWLETT PACKARD ENTERPRISE DEVELOPMENT LP: COMPANY SNAPSHOT
TABLE 126. HEWLETT PACKARD ENTERPRISE DEVELOPMENT LP: SERVICE SEGMENTS
TABLE 127. HEWLETT PACKARD ENTERPRISE DEVELOPMENT LP: PRODUCT PORTFOLIO
TABLE 128. HEWLETT PACKARD ENTERPRISE DEVELOPMENT LP: KEY STRATERGIES
TABLE 129. GOOGLE LLC (ALPHABET INC.): KEY EXECUTIVES
TABLE 130. GOOGLE LLC (ALPHABET INC.): COMPANY SNAPSHOT
TABLE 131. GOOGLE LLC (ALPHABET INC.): SERVICE SEGMENTS
TABLE 132. GOOGLE LLC (ALPHABET INC.): PRODUCT PORTFOLIO
TABLE 133. GOOGLE LLC (ALPHABET INC.): KEY STRATERGIES LIST OF FIGURES
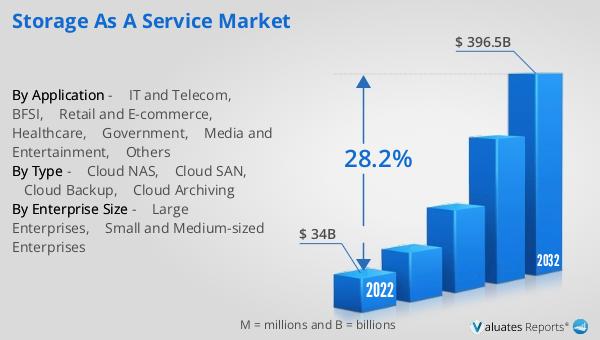
FIGURE 01. STORAGE AS A SERVICE MARKET, 2022-2032
FIGURE 02. SEGMENTATION OF STORAGE AS A SERVICE MARKET,2022-2032
FIGURE 03. TOP IMPACTING FACTORS IN STORAGE AS A SERVICE MARKET (2022 TO 2032)
FIGURE 04. TOP INVESTMENT POCKETS IN STORAGE AS A SERVICE MARKET (2023-2032)
FIGURE 05. MODERATE BARGAINING POWER OF SUPPLIERS
FIGURE 06. LOW-TO-HIGH THREAT OF NEW ENTRANTS
FIGURE 07. MODERATE-TO-HIGH THREAT OF SUBSTITUTES
FIGURE 08. HIGH INTENSITY OF RIVALRY
FIGURE 09. MODERATE BARGAINING POWER OF BUYERS
FIGURE 10. GLOBAL STORAGE AS A SERVICE MARKET:DRIVERS, RESTRAINTS AND OPPORTUNITIES
FIGURE 11. REGULATORY GUIDELINES: STORAGE AS A SERVICE MARKET
FIGURE 12. STORAGE AS A SERVICE MARKET, BY TYPE, 2022 AND 2032(%)
FIGURE 13. COMPARATIVE SHARE ANALYSIS OF STORAGE AS A SERVICE MARKET FOR CLOUD NAS, BY COUNTRY 2022 AND 2032(%)
FIGURE 14. COMPARATIVE SHARE ANALYSIS OF STORAGE AS A SERVICE MARKET FOR CLOUD SAN, BY COUNTRY 2022 AND 2032(%)
FIGURE 15. COMPARATIVE SHARE ANALYSIS OF STORAGE AS A SERVICE MARKET FOR CLOUD BACKUP, BY COUNTRY 2022 AND 2032(%)
FIGURE 16. COMPARATIVE SHARE ANALYSIS OF STORAGE AS A SERVICE MARKET FOR CLOUD ARCHIVING, BY COUNTRY 2022 AND 2032(%)
FIGURE 17. STORAGE AS A SERVICE MARKET, BY ENTERPRISE SIZE, 2022 AND 2032(%)
FIGURE 18. COMPARATIVE SHARE ANALYSIS OF STORAGE AS A SERVICE MARKET FOR LARGE ENTERPRISES, BY COUNTRY 2022 AND 2032(%)
FIGURE 19. COMPARATIVE SHARE ANALYSIS OF STORAGE AS A SERVICE MARKET FOR SMALL AND MEDIUM-SIZED ENTERPRISES, BY COUNTRY 2022 AND 2032(%)
FIGURE 20. STORAGE AS A SERVICE MARKET, BY APPLICATION, 2022 AND 2032(%)
FIGURE 21. COMPARATIVE SHARE ANALYSIS OF STORAGE AS A SERVICE MARKET FOR IT AND TELECOM, BY COUNTRY 2022 AND 2032(%)
FIGURE 22. COMPARATIVE SHARE ANALYSIS OF STORAGE AS A SERVICE MARKET FOR BFSI, BY COUNTRY 2022 AND 2032(%)
FIGURE 23. COMPARATIVE SHARE ANALYSIS OF STORAGE AS A SERVICE MARKET FOR RETAIL AND E-COMMERCE, BY COUNTRY 2022 AND 2032(%)
FIGURE 24. COMPARATIVE SHARE ANALYSIS OF STORAGE AS A SERVICE MARKET FOR HEALTHCARE, BY COUNTRY 2022 AND 2032(%)
FIGURE 25. COMPARATIVE SHARE ANALYSIS OF STORAGE AS A SERVICE MARKET FOR GOVERNMENT, BY COUNTRY 2022 AND 2032(%)
FIGURE 26. COMPARATIVE SHARE ANALYSIS OF STORAGE AS A SERVICE MARKET FOR MEDIA AND ENTERTAINMENT, BY COUNTRY 2022 AND 2032(%)
FIGURE 27. COMPARATIVE SHARE ANALYSIS OF STORAGE AS A SERVICE MARKET FOR OTHERS, BY COUNTRY 2022 AND 2032(%)
FIGURE 28. STORAGE AS A SERVICE MARKET BY REGION, 2022 AND 2032(%)
FIGURE 29. U.S. STORAGE AS A SERVICE MARKET, 2022-2032 ($MILLION)
FIGURE 30. CANADA STORAGE AS A SERVICE MARKET, 2022-2032 ($MILLION)
FIGURE 31. UK STORAGE AS A SERVICE MARKET, 2022-2032 ($MILLION)
FIGURE 32. GERMANY STORAGE AS A SERVICE MARKET, 2022-2032 ($MILLION)
FIGURE 33. FRANCE STORAGE AS A SERVICE MARKET, 2022-2032 ($MILLION)
FIGURE 34. ITALY STORAGE AS A SERVICE MARKET, 2022-2032 ($MILLION)
FIGURE 35. SPAIN STORAGE AS A SERVICE MARKET, 2022-2032 ($MILLION)
FIGURE 36. REST OF EUROPE STORAGE AS A SERVICE MARKET, 2022-2032 ($MILLION)
FIGURE 37. CHINA STORAGE AS A SERVICE MARKET, 2022-2032 ($MILLION)
FIGURE 38. JAPAN STORAGE AS A SERVICE MARKET, 2022-2032 ($MILLION)
FIGURE 39. INDIA STORAGE AS A SERVICE MARKET, 2022-2032 ($MILLION)
FIGURE 40. AUSTRALIA STORAGE AS A SERVICE MARKET, 2022-2032 ($MILLION)
FIGURE 41. SOUTH KOREA STORAGE AS A SERVICE MARKET, 2022-2032 ($MILLION)
FIGURE 42. REST OF ASIA-PACIFIC STORAGE AS A SERVICE MARKET, 2022-2032 ($MILLION)
FIGURE 43. LATIN AMERICA STORAGE AS A SERVICE MARKET, 2022-2032 ($MILLION)
FIGURE 44. MIDDLE EAST STORAGE AS A SERVICE MARKET, 2022-2032 ($MILLION)
FIGURE 45. AFRICA STORAGE AS A SERVICE MARKET, 2022-2032 ($MILLION)
FIGURE 46. TOP WINNING STRATEGIES, BY YEAR (2021-2023)
FIGURE 47. TOP WINNING STRATEGIES, BY DEVELOPMENT (2021-2023)
FIGURE 48. TOP WINNING STRATEGIES, BY COMPANY (2021-2023)
FIGURE 49. PRODUCT MAPPING OF TOP 10 PLAYERS
FIGURE 50. COMPETITIVE DASHBOARD
FIGURE 51. COMPETITIVE HEATMAP: STORAGE AS A SERVICE MARKET
FIGURE 52. TOP PLAYER POSITIONING, 2022
FIGURE 53. IBM CORPORATION: NET REVENUE, 2020-2022 ($MILLION)
FIGURE 54. IBM CORPORATION: RESEARCH & DEVELOPMENT EXPENDITURE, 2020-2022 ($MILLION)
FIGURE 55. IBM CORPORATION: REVENUE SHARE BY SEGMENT, 2022 (%)
FIGURE 56. IBM CORPORATION: REVENUE SHARE BY REGION, 2021 (%)
FIGURE 57. MICROSOFT CORPORATION: NET REVENUE, 2020-2022 ($MILLION)
FIGURE 58. MICROSOFT CORPORATION: RESEARCH & DEVELOPMENT EXPENDITURE, 2020-2022 ($MILLION)
FIGURE 59. MICROSOFT CORPORATION: REVENUE SHARE BY SEGMENT, 2022 (%)
FIGURE 60. MICROSOFT CORPORATION: REVENUE SHARE BY REGION, 2022 (%)
FIGURE 61. AMAZON WEB SERVICES, INC.: NET REVENUE, 2020-2022 ($MILLION)
FIGURE 62. AMAZON WEB SERVICES, INC.: REVENUE SHARE BY SEGMENT, 2022 (%)
FIGURE 63. AMAZON WEB SERVICES, INC.: REVENUE SHARE BY SEGMENT, 2022 (%)
FIGURE 64. DELL TECHNOLOGIES: RESEARCH & DEVELOPMENT EXPENDITURE, 2020-2022 ($MILLION)
FIGURE 65. DELL TECHNOLOGIES: NET REVENUE, 2020-2022 ($MILLION)
FIGURE 66. DELL TECHNOLOGIES: REVENUE SHARE BY SEGMENT, 2022 (%)
FIGURE 67. DELL TECHNOLOGIES: REVENUE SHARE BY REGION, 2022 (%)
FIGURE 68. RACKSPACE TECHONOLOGY: NET REVENUE, 2020-2022 ($MILLION)
FIGURE 69. AT&T: NET REVENUE, 2020-2022 ($MILLION)
FIGURE 70. AT&T: REVENUE SHARE BY REGION, 2022 (%)
FIGURE 71. AT&T: REVENUE SHARE BY SEGMENT, 2022 (%)
FIGURE 72. QUANTUM CORPORATION: RESEARCH & DEVELOPMENT EXPENDITURE, 2020-2022 ($MILLION)
FIGURE 73. QUANTUM CORPORATION: NET REVENUE, 2020-2022 ($MILLION)
FIGURE 74. HEWLETT PACKARD ENTERPRISE DEVELOPMENT LP: NET REVENUE, 2020-2022 ($MILLION)
FIGURE 75. HEWLETT PACKARD ENTERPRISE DEVELOPMENT LP: RESEARCH & DEVELOPMENT EXPENDITURE, 2020-2022 ($MILLION)
FIGURE 76. HEWLETT PACKARD ENTERPRISE DEVELOPMENT LP: REVENUE SHARE BY SEGMENT, 2022 (%)
FIGURE 77. HEWLETT PACKARD ENTERPRISE DEVELOPMENT LP: REVENUE SHARE BY REGION, 2022 (%)
FIGURE 78. GOOGLE LLC (ALPHABET INC.): RESEARCH & DEVELOPMENT EXPENDITURE, 2020-2022 ($MILLION)
FIGURE 79. GOOGLE LLC (ALPHABET INC.): NET REVENUE, 2020-2022 ($MILLION)
FIGURE 80. GOOGLE LLC (ALPHABET INC.): REVENUE SHARE BY SEGMENT, 2022 (%)
FIGURE 81. GOOGLE LLC (ALPHABET INC.): REVENUE SHARE BY REGION, 2022 (%
SELECT A FORMAT
Added to Cart
Electronic (PDF)

$5730

This license allows only one user to access the PDF.
Electronic (PDF)

$6450

This license allows 1 - 5 user to access the PDF, license is suitable for small groups of 5 users working together
Electronic (PDF)

$9600

This license allows users/teams in a same Enterprise to use this report, various departments within an enterpise can use this report
Electronic (PDF)

$3840

This license just provides quantitative data in a excel sheet
Add to Cart
Buy Now (15% Discount)

OUR CUSTOMER

Nano String

SIMILAR REPORTS


RELATED REPORTS

Global Cloud Sustainability Market Research Report 2025

120 Pages
Type: Report
Code: QYRE-Auto-23Z17891
Tue Dec 02 00:00:00 UTC 2025

Add to Cart

Global Domain Controller SerDes Chip Market Research Report 2025

120 Pages
Type: Report
Code: QYRE-Auto-33M20000
Tue Dec 02 00:00:00 UTC 2025

Add to Cart

Global Website Migration Market Research Report 2025

120 Pages
Type: Report
Code: QYRE-Auto-15Q20205
Fri Nov 28 00:00:00 UTC 2025

Add to Cart

Global Header Builder Market Research Report 2025

120 Pages
Type: Report
Code: QYRE-Auto-0V20506
Fri Nov 28 00:00:00 UTC 2025

Add to Cart