0
U.S. (TOLL FREE)
+1 (315) 215-3225
Automative

0
U.S. (TOLL FREE)
+1 (315) 215-3225
Vehicle Scanner Market By Scanner Type (Portable, Fixed), By Structure Type (Drive-Through, UVSS), By Application (Government, Private), By Component (Camera, Lighting Unit, Barrier, Software, Others): Global Opportunity Analysis and Industry Forecast, 2021-2031
Published Date: February 2023
|
Report Code: ALLI-Auto-3E796
Home | Market Reports | Business & Industrial| Automotive Industry
Vehicle Scanner Market By Scanner Type Portable Fixed By Structure Type Drive Through UVSS By Application Government Private By Component Camera Lighting Unit Barrier Software Others Global Opportunity Analysis and Industry Forecast 2021 2031
BUY CHAPTERS

Vehicle Scanner Market By Scanner Type (Portable, Fixed), By Structure Type (Drive-Through, UVSS), By Application (Government, Private), By Component (Camera, Lighting Unit, Barrier, Software, Others): Global Opportunity Analysis and Industry Forecast, 2021-2031

Code: ALLI-Auto-3E796
Report
February 2023
Pages:280
Allied Market Research
Buy Now with 15% Discount
DESCRIPTION
TABLE OF CONTENT
TABLES & FIGURES

Vehicle Scanner Market Size

According to a new report published by , titled, “Vehicle Scanner Market," The vehicle scanner market was valued at $3.3 billion in 2021, and is estimated to reach $5.8 billion by 2031, growing at a CAGR of 6% from 2022 to 2031.

Vehicle Scanner Market

Vehicle Scanner Market

A vehicle scanner is an electronic device that is used to connect with, examine, and occasionally reinvent vehicle control systems. A variety of scanners, including fixed and compact models, are useful for finding, illuminating, inspecting, imaging, and prepping the vehicle. For locally accessible car diagnostics, vehicle scanners are useful. There are several types of vehicle scanners available, owing to the availability of various vehicle scanner manufacturers. These scanners aid in the identification of potential risks, unfamiliar goods, loot, and other stuff.
The vehicle scanner sector is growing in popularity around the world because it is a simple-to-use handling instrument that can be transferred from one location to another to diagnose broken machinery in automotive vehicles. A vehicle scanner also incorporates diagnostics software, as well as a technical information database and a workshop management module. The automatic detection of damaged parts and error codes is responsible for the huge increase in car scanner market share. Adaptation, actuation, and calibration of automobile components are also important car scanning features. These factors are anticipated to boost the vehicle scanner market size during the forecast period.
A vehicle scanner is an electronic instrument for detecting and reprogramming vehicle control systems. Fixed and portable scanners help in the illumination, sensing, imaging, scanning, and processing of the vehicle. These scanners are important for vehicle onboard diagnostics. Vehicles with greater safety features and user-friendly functionality are in high demand among consumers. Vehicle manufacturers are working on creating user-friendly systems with superior technological features. Furthermore, increased emphasis on safety and security rules by organized governments of various countries, as well as infrastructure development, are driving factors in the vehicle scanner system market.
Government and commercial organizations’ growing concerns about security and safety are driving industry expansion. The market value is being supported by the quick infrastructural expansion, especially in emerging economies. The increasing threat to security presented by terrorist attacks such as bombings and mass shootings is also fostering industry expansion. The industry is also being supported by the rising number of vehicles scanning systems being installed to stop illegal operations including border breaching, human trafficking, and smuggling. Additionally, the market for vehicle scanners is expected to benefit from increased demand for full vehicle body scanning and encouragement from government institutions.
The vehicle scanner market is segmented on the basis of scanner type, structure type, application, component and region. On the basis of scanner type, it is classified into portable, and fixed. By structure type, the market is classified into drive-through, and UVSS. By application, the market is classified into government, and private. By component, the market is classified into camera, lighting unit, barrier, software, and others. On the basis of region, it is analyzed across North America (the U.S., Canada, and Mexico), Europe (the UK, Germany, France, Italy, Spain, and rest of Europe), Asia-Pacific (China, India, Japan, Australia, and rest of Asia-Pacific), and LAMEA (Brazil, South Africa, Saudi Arabia, UAE and rest of LAMEA).
The key players profiled in the study Gatekeeper Security, SecuScan , UVIScan , Leidos , IRD , SCANLAB GmbH, Omnitec Group, Leidos, Advanced Detection Technology LLC, Rapiscan Systems The players in the market are actively engaged in the adoption of various strategies such as acquisitions, product launches, and expansion to remain competitive and gain advantage over competitors in the market. Fo instance, in December 2022, Vehant Technologies, a pioneer in AI/ML-based physical security surveillance solutions, introduced DepScan UVSS, a security tool that scans the underside of cars using stereoscopic vision technology. DepScan uses unique stereoscopic vision technology to do depth-based comparisons with several cameras placed side by side to gather multiple views of the underbelly of any vehicle from various angles. The technology provides a point cloud-based 3D representation, which aids in determining relative depth.The DepScan UVSS from Vehant is the next-generation game changer in under-vehicle scanning. It is state-of-the-art equipment that improves reliability and automates the process of checking for the existence of any explosives or illegal devices affixed to the underside of a vehicle. The stereo vision camera systems are calibrated to take images in real-time and use colour depth mapping to improve undercarriage visibility.
Key Market Insights
Based on scanner type, the fixed sub-segment emerged as the global leader in 2021 and portable sub-segment is anticipated to be the fastest growing sub-segment during the forecast period.
Based on structure type, the UVSS sub-segment emerged as the global leader in 2021.
Based on application, the government sub-segment emerged as the global leader in 2021.
Based on component, the camera sub-segment emerged as the global leader in 2021.
Based on region, the North America market registered the highest market share in 2021

Overview

The global vehicle scanner market is envisioned to garner $5.8 billion by 2031, growing from $3.3 billion in 2021 at a CAGR of 6% from 2022 to 2031.
Rising security and safety concerns, as well as infrastructure development, are driving factors in the vehicle scanner industry. Increased vehicle scanner system installation to prevent border trespassing, smuggling, and human trafficking, as well as increased availability of advanced security solutions, are among the primary reasons driving the vehicle scanner market. As a result, growing demand for full-body vehicle scanners from military and government facilities these factors are drive to market growth.
The high cost of vehicle scanners is a factor that may restrict demand for vehicle scanners and restrain global market demand during the forecast period. Additionally, the increased acceptance and installation of vehicle scanning systems on government premises might offer a significant income potential for companies in the target market.
These scanners are utilized at oil refineries, ports, toll booths, and border crossings. One of the main factors driving the expansion of tollways is the market for vehicle scanners. The market is similarly driven by increased auto production, rising electric vehicle sales, technological developments in the automotive industry, increasing government support, and initiatives to create intelligent transportation networks. Additionally, the market for vehicle scanner is expected to increase significantly due to the increasing popularity of electric vehicles in developing countries and growing security concerns globally.
The COVID-19 pandemic brought several uncertainties leading to severe economic losses as various businesses across the world were on a standstill. There were import-export restrictions laid down on major vehicle scanner producing countries such as the U.S. and China, which imposed significant challenges on the market. In October 2021, for instance, electronic road pricing is being implemented, according to recent announcements from the Jakarta government. These activities should improve the connectivity between these scanners and IoT. Similar other initiatives are projected to relieve the market of the difficulties faced during the pandemic.
The key players profiled in this report include Gatekeeper Security, SecuScan , UVIScan , Leidos , IRD , SCANLAB GmbH, Omnitec Group, Leidos, Advanced Detection Technology LLC, Rapiscan Systems

Key Benefits For Stakeholders

●This report provides a quantitative analysis of the market segments, current trends, estimations, and dynamics of the vehicle scanner market analysis from 2021 to 2031 to identify the prevailing vehicle scanner market opportunities.
●The market research is offered along with information related to key drivers, restraints, and opportunities.
●Porter's five forces analysis highlights the potency of buyers and suppliers to enable stakeholders make profit-oriented business decisions and strengthen their supplier-buyer network.
●In-depth analysis of the vehicle scanner market segmentation assists to determine the prevailing market opportunities.
●Major countries in each region are mapped according to their revenue contribution to the global market.
●Market player positioning facilitates benchmarking and provides a clear understanding of the present position of the market players.
●The report includes the analysis of the regional as well as global vehicle scanner market trends, key players, market segments, application areas, and market growth strategies.
Key Market Segments
○ scanlab gmb

Scope of Vehicle Scanner Market Report

Report Metric Details
Report Name Vehicle Scanner Market
Accounted market size in 2021 $ 3.3 billion
Forecasted market size in 2031 $ 5.8 billion
CAGR 6%
Base Year 2021
Forecasted years 2024 - 2031
By Scanner Type ● Portable
● Fixed
By Structure Type ● Drive-Through
● UVSS
By Application ● Government
● Private
By Component ● Camera
● Lighting Unit
● Barrier
● Software
● Others
By Region
  • North America (United States, Canada)
  • Europe (Germany, France, UK, Italy, Russia) Rest of Europe
  • Nordic Countries
  • Asia-Pacific (China, Japan, South Korea)
  • Southeast Asia (India, Australia)
  • Rest of Asia
  • Latin America (Mexico, Brazil)
  • Rest of Latin America
  • Middle East & Africa (Turkey, Saudi Arabia, UAE, Rest of MEA)
Forecast units USD million in value
Report coverage Revenue and volume forecast, company share, competitive landscape, growth factors and trends

FAQ for this report

How fast is Vehicle Scanner Market growing?

Ans: The Vehicle Scanner Market witnessing a CAGR of 6% during the forecast period 2024-2031.

What is the Vehicle Scanner Market size in 2031?

Ans: The Vehicle Scanner Market size in 2031 will be $ 5.8 billion.

What are the Application segmentation covered in the Vehicle Scanner Market report?

Ans: The Applications covered in the Vehicle Scanner Market report are ● Government, ● Private

What are the Type segmentation covered in the Vehicle Scanner Market report?

Ans: The Types covered in the Vehicle Scanner Market report are ● Drive-Through, ● UVSS

CHAPTER 1: INTRODUCTION
1.1. Report description
1.2. Key market segments
1.3. Key benefits to the stakeholders
1.4. Research Methodology
1.4.1. Primary research
1.4.2. Secondary research
1.4.3. Analyst tools and models
CHAPTER 2: EXECUTIVE SUMMARY
2.1. CXO Perspective
CHAPTER 3: MARKET OVERVIEW
3.1. Market definition and scope
3.2. Key findings
3.2.1. Top impacting factors
3.2.2. Top investment pockets
3.3. Porter’s five forces analysis
3.4. Market dynamics
3.4.1. Drivers
3.4.2. Restraints
3.4.3. Opportunities
3.5. COVID-19 Impact Analysis on the market
3.6. Key Regulation Analysis
3.7. Market Share Analysis
3.8. Patent Landscape
3.9. Regulatory Guidelines
3.10. Value Chain Analysis
CHAPTER 4: VEHICLE SCANNER MARKET, BY SCANNER TYPE
4.1. Overview
4.1.1. Market size and forecast
4.2. Portable
4.2.1. Key market trends, growth factors and opportunities
4.2.2. Market size and forecast, by region
4.2.3. Market share analysis by country
4.3. Fixed
4.3.1. Key market trends, growth factors and opportunities
4.3.2. Market size and forecast, by region
4.3.3. Market share analysis by country
CHAPTER 5: VEHICLE SCANNER MARKET, BY STRUCTURE TYPE
5.1. Overview
5.1.1. Market size and forecast
5.2. Drive-Through
5.2.1. Key market trends, growth factors and opportunities
5.2.2. Market size and forecast, by region
5.2.3. Market share analysis by country
5.3. UVSS
5.3.1. Key market trends, growth factors and opportunities
5.3.2. Market size and forecast, by region
5.3.3. Market share analysis by country
CHAPTER 6: VEHICLE SCANNER MARKET, BY APPLICATION
6.1. Overview
6.1.1. Market size and forecast
6.2. Government
6.2.1. Key market trends, growth factors and opportunities
6.2.2. Market size and forecast, by region
6.2.3. Market share analysis by country
6.3. Private
6.3.1. Key market trends, growth factors and opportunities
6.3.2. Market size and forecast, by region
6.3.3. Market share analysis by country
CHAPTER 7: VEHICLE SCANNER MARKET, BY COMPONENT
7.1. Overview
7.1.1. Market size and forecast
7.2. Camera
7.2.1. Key market trends, growth factors and opportunities
7.2.2. Market size and forecast, by region
7.2.3. Market share analysis by country
7.3. Lighting Unit
7.3.1. Key market trends, growth factors and opportunities
7.3.2. Market size and forecast, by region
7.3.3. Market share analysis by country
7.4. Barrier
7.4.1. Key market trends, growth factors and opportunities
7.4.2. Market size and forecast, by region
7.4.3. Market share analysis by country
7.5. Software
7.5.1. Key market trends, growth factors and opportunities
7.5.2. Market size and forecast, by region
7.5.3. Market share analysis by country
7.6. Others
7.6.1. Key market trends, growth factors and opportunities
7.6.2. Market size and forecast, by region
7.6.3. Market share analysis by country
CHAPTER 8: VEHICLE SCANNER MARKET, BY REGION
8.1. Overview
8.1.1. Market size and forecast By Region
8.2. North America
8.2.1. Key trends and opportunities
8.2.2. Market size and forecast, by Scanner Type
8.2.3. Market size and forecast, by Structure Type
8.2.4. Market size and forecast, by Application
8.2.5. Market size and forecast, by Component
8.2.6. Market size and forecast, by country
8.2.6.1. U.S.
8.2.6.1.1. Key market trends, growth factors and opportunities
8.2.6.1.2. Market size and forecast, by Scanner Type
8.2.6.1.3. Market size and forecast, by Structure Type
8.2.6.1.4. Market size and forecast, by Application
8.2.6.1.5. Market size and forecast, by Component
8.2.6.2. Canada
8.2.6.2.1. Key market trends, growth factors and opportunities
8.2.6.2.2. Market size and forecast, by Scanner Type
8.2.6.2.3. Market size and forecast, by Structure Type
8.2.6.2.4. Market size and forecast, by Application
8.2.6.2.5. Market size and forecast, by Component
8.2.6.3. Mexico
8.2.6.3.1. Key market trends, growth factors and opportunities
8.2.6.3.2. Market size and forecast, by Scanner Type
8.2.6.3.3. Market size and forecast, by Structure Type
8.2.6.3.4. Market size and forecast, by Application
8.2.6.3.5. Market size and forecast, by Component
8.3. Europe
8.3.1. Key trends and opportunities
8.3.2. Market size and forecast, by Scanner Type
8.3.3. Market size and forecast, by Structure Type
8.3.4. Market size and forecast, by Application
8.3.5. Market size and forecast, by Component
8.3.6. Market size and forecast, by country
8.3.6.1. UK
8.3.6.1.1. Key market trends, growth factors and opportunities
8.3.6.1.2. Market size and forecast, by Scanner Type
8.3.6.1.3. Market size and forecast, by Structure Type
8.3.6.1.4. Market size and forecast, by Application
8.3.6.1.5. Market size and forecast, by Component
8.3.6.2. Germany
8.3.6.2.1. Key market trends, growth factors and opportunities
8.3.6.2.2. Market size and forecast, by Scanner Type
8.3.6.2.3. Market size and forecast, by Structure Type
8.3.6.2.4. Market size and forecast, by Application
8.3.6.2.5. Market size and forecast, by Component
8.3.6.3. France
8.3.6.3.1. Key market trends, growth factors and opportunities
8.3.6.3.2. Market size and forecast, by Scanner Type
8.3.6.3.3. Market size and forecast, by Structure Type
8.3.6.3.4. Market size and forecast, by Application
8.3.6.3.5. Market size and forecast, by Component
8.3.6.4. Spain
8.3.6.4.1. Key market trends, growth factors and opportunities
8.3.6.4.2. Market size and forecast, by Scanner Type
8.3.6.4.3. Market size and forecast, by Structure Type
8.3.6.4.4. Market size and forecast, by Application
8.3.6.4.5. Market size and forecast, by Component
8.3.6.5. Italy
8.3.6.5.1. Key market trends, growth factors and opportunities
8.3.6.5.2. Market size and forecast, by Scanner Type
8.3.6.5.3. Market size and forecast, by Structure Type
8.3.6.5.4. Market size and forecast, by Application
8.3.6.5.5. Market size and forecast, by Component
8.3.6.6. Rest of Europe
8.3.6.6.1. Key market trends, growth factors and opportunities
8.3.6.6.2. Market size and forecast, by Scanner Type
8.3.6.6.3. Market size and forecast, by Structure Type
8.3.6.6.4. Market size and forecast, by Application
8.3.6.6.5. Market size and forecast, by Component
8.4. Asia-Pacific
8.4.1. Key trends and opportunities
8.4.2. Market size and forecast, by Scanner Type
8.4.3. Market size and forecast, by Structure Type
8.4.4. Market size and forecast, by Application
8.4.5. Market size and forecast, by Component
8.4.6. Market size and forecast, by country
8.4.6.1. China
8.4.6.1.1. Key market trends, growth factors and opportunities
8.4.6.1.2. Market size and forecast, by Scanner Type
8.4.6.1.3. Market size and forecast, by Structure Type
8.4.6.1.4. Market size and forecast, by Application
8.4.6.1.5. Market size and forecast, by Component
8.4.6.2. India
8.4.6.2.1. Key market trends, growth factors and opportunities
8.4.6.2.2. Market size and forecast, by Scanner Type
8.4.6.2.3. Market size and forecast, by Structure Type
8.4.6.2.4. Market size and forecast, by Application
8.4.6.2.5. Market size and forecast, by Component
8.4.6.3. Japan
8.4.6.3.1. Key market trends, growth factors and opportunities
8.4.6.3.2. Market size and forecast, by Scanner Type
8.4.6.3.3. Market size and forecast, by Structure Type
8.4.6.3.4. Market size and forecast, by Application
8.4.6.3.5. Market size and forecast, by Component
8.4.6.4. South Korea
8.4.6.4.1. Key market trends, growth factors and opportunities
8.4.6.4.2. Market size and forecast, by Scanner Type
8.4.6.4.3. Market size and forecast, by Structure Type
8.4.6.4.4. Market size and forecast, by Application
8.4.6.4.5. Market size and forecast, by Component
8.4.6.5. Australia
8.4.6.5.1. Key market trends, growth factors and opportunities
8.4.6.5.2. Market size and forecast, by Scanner Type
8.4.6.5.3. Market size and forecast, by Structure Type
8.4.6.5.4. Market size and forecast, by Application
8.4.6.5.5. Market size and forecast, by Component
8.4.6.6. Rest of Asia-Pacific
8.4.6.6.1. Key market trends, growth factors and opportunities
8.4.6.6.2. Market size and forecast, by Scanner Type
8.4.6.6.3. Market size and forecast, by Structure Type
8.4.6.6.4. Market size and forecast, by Application
8.4.6.6.5. Market size and forecast, by Component
8.5. LAMEA
8.5.1. Key trends and opportunities
8.5.2. Market size and forecast, by Scanner Type
8.5.3. Market size and forecast, by Structure Type
8.5.4. Market size and forecast, by Application
8.5.5. Market size and forecast, by Component
8.5.6. Market size and forecast, by country
8.5.6.1. Brazil
8.5.6.1.1. Key market trends, growth factors and opportunities
8.5.6.1.2. Market size and forecast, by Scanner Type
8.5.6.1.3. Market size and forecast, by Structure Type
8.5.6.1.4. Market size and forecast, by Application
8.5.6.1.5. Market size and forecast, by Component
8.5.6.2. UAE
8.5.6.2.1. Key market trends, growth factors and opportunities
8.5.6.2.2. Market size and forecast, by Scanner Type
8.5.6.2.3. Market size and forecast, by Structure Type
8.5.6.2.4. Market size and forecast, by Application
8.5.6.2.5. Market size and forecast, by Component
8.5.6.3. Saudi Arabia
8.5.6.3.1. Key market trends, growth factors and opportunities
8.5.6.3.2. Market size and forecast, by Scanner Type
8.5.6.3.3. Market size and forecast, by Structure Type
8.5.6.3.4. Market size and forecast, by Application
8.5.6.3.5. Market size and forecast, by Component
8.5.6.4. South Africa
8.5.6.4.1. Key market trends, growth factors and opportunities
8.5.6.4.2. Market size and forecast, by Scanner Type
8.5.6.4.3. Market size and forecast, by Structure Type
8.5.6.4.4. Market size and forecast, by Application
8.5.6.4.5. Market size and forecast, by Component
8.5.6.5. Rest of LAMEA
8.5.6.5.1. Key market trends, growth factors and opportunities
8.5.6.5.2. Market size and forecast, by Scanner Type
8.5.6.5.3. Market size and forecast, by Structure Type
8.5.6.5.4. Market size and forecast, by Application
8.5.6.5.5. Market size and forecast, by Component
CHAPTER 9: COMPETITIVE LANDSCAPE
9.1. Introduction
9.2. Top winning strategies
9.3. Product Mapping of Top 10 Player
9.4. Competitive Dashboard
9.5. Competitive Heatmap
9.6. Top player positioning, 2021
CHAPTER 10: COMPANY PROFILES
10.1. Gatekeeper Security Inc.
10.1.1. Company overview
10.1.2. Key Executives
10.1.3. Company snapshot
10.2. Omnitec Group
10.2.1. Company overview
10.2.2. Key Executives
10.2.3. Company snapshot
10.3. godrej & boyce mfg. co. ltd.
10.3.1. Company overview
10.3.2. Key Executives
10.3.3. Company snapshot
10.4. Tescon AG
10.4.1. Company overview
10.4.2. Key Executives
10.4.3. Company snapshot
10.5. uveye
10.5.1. Company overview
10.5.2. Key Executives
10.5.3. Company snapshot
10.6. international road dynamics southa asia pvt. ltd.
10.6.1. Company overview
10.6.2. Key Executives
10.6.3. Company snapshot
10.7. Secuscan
10.7.1. Company overview
10.7.2. Key Executives
10.7.3. Company snapshot
10.8. VMI Security System
10.8.1. Company overview
10.8.2. Key Executives
10.8.3. Company snapshot
10.9. intelliscan
10.9.1. Company overview
10.9.2. Key Executives
10.9.3. Company snapshot
10.10. scanlab gmbh
10.10.1. Company overview
10.10.2. Key Executives
10.10.3. Company snapsho
LIST OF TABLES
TABLE 01. GLOBAL VEHICLE SCANNER MARKET, BY SCANNER TYPE, 2021-2031 (REVENUE, $MILLION)
TABLE 02. VEHICLE SCANNER MARKET FOR PORTABLE, BY REGION, 2021-2031 (REVENUE, $MILLION)
TABLE 03. VEHICLE SCANNER MARKET FOR FIXED, BY REGION, 2021-2031 (REVENUE, $MILLION)
TABLE 04. GLOBAL VEHICLE SCANNER MARKET, BY STRUCTURE TYPE, 2021-2031 (REVENUE, $MILLION)
TABLE 05. VEHICLE SCANNER MARKET FOR DRIVE-THROUGH, BY REGION, 2021-2031 (REVENUE, $MILLION)
TABLE 06. VEHICLE SCANNER MARKET FOR UVSS, BY REGION, 2021-2031 (REVENUE, $MILLION)
TABLE 07. GLOBAL VEHICLE SCANNER MARKET, BY APPLICATION, 2021-2031 (REVENUE, $MILLION)
TABLE 08. VEHICLE SCANNER MARKET FOR GOVERNMENT, BY REGION, 2021-2031 (REVENUE, $MILLION)
TABLE 09. VEHICLE SCANNER MARKET FOR PRIVATE, BY REGION, 2021-2031 (REVENUE, $MILLION)
TABLE 10. GLOBAL VEHICLE SCANNER MARKET, BY COMPONENT, 2021-2031 (REVENUE, $MILLION)
TABLE 11. VEHICLE SCANNER MARKET FOR CAMERA, BY REGION, 2021-2031 (REVENUE, $MILLION)
TABLE 12. VEHICLE SCANNER MARKET FOR LIGHTING UNIT, BY REGION, 2021-2031 (REVENUE, $MILLION)
TABLE 13. VEHICLE SCANNER MARKET FOR BARRIER, BY REGION, 2021-2031 (REVENUE, $MILLION)
TABLE 14. VEHICLE SCANNER MARKET FOR SOFTWARE, BY REGION, 2021-2031 (REVENUE, $MILLION)
TABLE 15. VEHICLE SCANNER MARKET FOR OTHERS, BY REGION, 2021-2031 (REVENUE, $MILLION)
TABLE 16. VEHICLE SCANNER MARKET, BY REGION, 2021-2031 (REVENUE, $MILLION)
TABLE 17. NORTH AMERICA VEHICLE SCANNER MARKET, BY SCANNER TYPE, 2021-2031 (REVENUE, $MILLION)
TABLE 18. NORTH AMERICA VEHICLE SCANNER MARKET, BY STRUCTURE TYPE, 2021-2031 (REVENUE, $MILLION)
TABLE 19. NORTH AMERICA VEHICLE SCANNER MARKET, BY APPLICATION, 2021-2031 (REVENUE, $MILLION)
TABLE 20. NORTH AMERICA VEHICLE SCANNER MARKET, BY COMPONENT, 2021-2031 (REVENUE, $MILLION)
TABLE 21. NORTH AMERICA VEHICLE SCANNER MARKET, BY COUNTRY, 2021-2031 (REVENUE, $MILLION)
TABLE 22. U.S. VEHICLE SCANNER MARKET, BY SCANNER TYPE, 2021-2031 (REVENUE, $MILLION)
TABLE 23. U.S. VEHICLE SCANNER MARKET, BY STRUCTURE TYPE, 2021-2031 (REVENUE, $MILLION)
TABLE 24. U.S. VEHICLE SCANNER MARKET, BY APPLICATION, 2021-2031 (REVENUE, $MILLION)
TABLE 25. U.S. VEHICLE SCANNER MARKET, BY COMPONENT, 2021-2031 (REVENUE, $MILLION)
TABLE 26. CANADA VEHICLE SCANNER MARKET, BY SCANNER TYPE, 2021-2031 (REVENUE, $MILLION)
TABLE 27. CANADA VEHICLE SCANNER MARKET, BY STRUCTURE TYPE, 2021-2031 (REVENUE, $MILLION)
TABLE 28. CANADA VEHICLE SCANNER MARKET, BY APPLICATION, 2021-2031 (REVENUE, $MILLION)
TABLE 29. CANADA VEHICLE SCANNER MARKET, BY COMPONENT, 2021-2031 (REVENUE, $MILLION)
TABLE 30. MEXICO VEHICLE SCANNER MARKET, BY SCANNER TYPE, 2021-2031 (REVENUE, $MILLION)
TABLE 31. MEXICO VEHICLE SCANNER MARKET, BY STRUCTURE TYPE, 2021-2031 (REVENUE, $MILLION)
TABLE 32. MEXICO VEHICLE SCANNER MARKET, BY APPLICATION, 2021-2031 (REVENUE, $MILLION)
TABLE 33. MEXICO VEHICLE SCANNER MARKET, BY COMPONENT, 2021-2031 (REVENUE, $MILLION)
TABLE 34. EUROPE VEHICLE SCANNER MARKET, BY SCANNER TYPE, 2021-2031 (REVENUE, $MILLION)
TABLE 35. EUROPE VEHICLE SCANNER MARKET, BY STRUCTURE TYPE, 2021-2031 (REVENUE, $MILLION)
TABLE 36. EUROPE VEHICLE SCANNER MARKET, BY APPLICATION, 2021-2031 (REVENUE, $MILLION)
TABLE 37. EUROPE VEHICLE SCANNER MARKET, BY COMPONENT, 2021-2031 (REVENUE, $MILLION)
TABLE 38. EUROPE VEHICLE SCANNER MARKET, BY COUNTRY, 2021-2031 (REVENUE, $MILLION)
TABLE 39. UK VEHICLE SCANNER MARKET, BY SCANNER TYPE, 2021-2031 (REVENUE, $MILLION)
TABLE 40. UK VEHICLE SCANNER MARKET, BY STRUCTURE TYPE, 2021-2031 (REVENUE, $MILLION)
TABLE 41. UK VEHICLE SCANNER MARKET, BY APPLICATION, 2021-2031 (REVENUE, $MILLION)
TABLE 42. UK VEHICLE SCANNER MARKET, BY COMPONENT, 2021-2031 (REVENUE, $MILLION)
TABLE 43. GERMANY VEHICLE SCANNER MARKET, BY SCANNER TYPE, 2021-2031 (REVENUE, $MILLION)
TABLE 44. GERMANY VEHICLE SCANNER MARKET, BY STRUCTURE TYPE, 2021-2031 (REVENUE, $MILLION)
TABLE 45. GERMANY VEHICLE SCANNER MARKET, BY APPLICATION, 2021-2031 (REVENUE, $MILLION)
TABLE 46. GERMANY VEHICLE SCANNER MARKET, BY COMPONENT, 2021-2031 (REVENUE, $MILLION)
TABLE 47. FRANCE VEHICLE SCANNER MARKET, BY SCANNER TYPE, 2021-2031 (REVENUE, $MILLION)
TABLE 48. FRANCE VEHICLE SCANNER MARKET, BY STRUCTURE TYPE, 2021-2031 (REVENUE, $MILLION)
TABLE 49. FRANCE VEHICLE SCANNER MARKET, BY APPLICATION, 2021-2031 (REVENUE, $MILLION)
TABLE 50. FRANCE VEHICLE SCANNER MARKET, BY COMPONENT, 2021-2031 (REVENUE, $MILLION)
TABLE 51. SPAIN VEHICLE SCANNER MARKET, BY SCANNER TYPE, 2021-2031 (REVENUE, $MILLION)
TABLE 52. SPAIN VEHICLE SCANNER MARKET, BY STRUCTURE TYPE, 2021-2031 (REVENUE, $MILLION)
TABLE 53. SPAIN VEHICLE SCANNER MARKET, BY APPLICATION, 2021-2031 (REVENUE, $MILLION)
TABLE 54. SPAIN VEHICLE SCANNER MARKET, BY COMPONENT, 2021-2031 (REVENUE, $MILLION)
TABLE 55. ITALY VEHICLE SCANNER MARKET, BY SCANNER TYPE, 2021-2031 (REVENUE, $MILLION)
TABLE 56. ITALY VEHICLE SCANNER MARKET, BY STRUCTURE TYPE, 2021-2031 (REVENUE, $MILLION)
TABLE 57. ITALY VEHICLE SCANNER MARKET, BY APPLICATION, 2021-2031 (REVENUE, $MILLION)
TABLE 58. ITALY VEHICLE SCANNER MARKET, BY COMPONENT, 2021-2031 (REVENUE, $MILLION)
TABLE 59. REST OF EUROPE VEHICLE SCANNER MARKET, BY SCANNER TYPE, 2021-2031 (REVENUE, $MILLION)
TABLE 60. REST OF EUROPE VEHICLE SCANNER MARKET, BY STRUCTURE TYPE, 2021-2031 (REVENUE, $MILLION)
TABLE 61. REST OF EUROPE VEHICLE SCANNER MARKET, BY APPLICATION, 2021-2031 (REVENUE, $MILLION)
TABLE 62. REST OF EUROPE VEHICLE SCANNER MARKET, BY COMPONENT, 2021-2031 (REVENUE, $MILLION)
TABLE 63. ASIA-PACIFIC VEHICLE SCANNER MARKET, BY SCANNER TYPE, 2021-2031 (REVENUE, $MILLION)
TABLE 64. ASIA-PACIFIC VEHICLE SCANNER MARKET, BY STRUCTURE TYPE, 2021-2031 (REVENUE, $MILLION)
TABLE 65. ASIA-PACIFIC VEHICLE SCANNER MARKET, BY APPLICATION, 2021-2031 (REVENUE, $MILLION)
TABLE 66. ASIA-PACIFIC VEHICLE SCANNER MARKET, BY COMPONENT, 2021-2031 (REVENUE, $MILLION)
TABLE 67. ASIA-PACIFIC VEHICLE SCANNER MARKET, BY COUNTRY, 2021-2031 (REVENUE, $MILLION)
TABLE 68. CHINA VEHICLE SCANNER MARKET, BY SCANNER TYPE, 2021-2031 (REVENUE, $MILLION)
TABLE 69. CHINA VEHICLE SCANNER MARKET, BY STRUCTURE TYPE, 2021-2031 (REVENUE, $MILLION)
TABLE 70. CHINA VEHICLE SCANNER MARKET, BY APPLICATION, 2021-2031 (REVENUE, $MILLION)
TABLE 71. CHINA VEHICLE SCANNER MARKET, BY COMPONENT, 2021-2031 (REVENUE, $MILLION)
TABLE 72. INDIA VEHICLE SCANNER MARKET, BY SCANNER TYPE, 2021-2031 (REVENUE, $MILLION)
TABLE 73. INDIA VEHICLE SCANNER MARKET, BY STRUCTURE TYPE, 2021-2031 (REVENUE, $MILLION)
TABLE 74. INDIA VEHICLE SCANNER MARKET, BY APPLICATION, 2021-2031 (REVENUE, $MILLION)
TABLE 75. INDIA VEHICLE SCANNER MARKET, BY COMPONENT, 2021-2031 (REVENUE, $MILLION)
TABLE 76. JAPAN VEHICLE SCANNER MARKET, BY SCANNER TYPE, 2021-2031 (REVENUE, $MILLION)
TABLE 77. JAPAN VEHICLE SCANNER MARKET, BY STRUCTURE TYPE, 2021-2031 (REVENUE, $MILLION)
TABLE 78. JAPAN VEHICLE SCANNER MARKET, BY APPLICATION, 2021-2031 (REVENUE, $MILLION)
TABLE 79. JAPAN VEHICLE SCANNER MARKET, BY COMPONENT, 2021-2031 (REVENUE, $MILLION)
TABLE 80. SOUTH KOREA VEHICLE SCANNER MARKET, BY SCANNER TYPE, 2021-2031 (REVENUE, $MILLION)
TABLE 81. SOUTH KOREA VEHICLE SCANNER MARKET, BY STRUCTURE TYPE, 2021-2031 (REVENUE, $MILLION)
TABLE 82. SOUTH KOREA VEHICLE SCANNER MARKET, BY APPLICATION, 2021-2031 (REVENUE, $MILLION)
TABLE 83. SOUTH KOREA VEHICLE SCANNER MARKET, BY COMPONENT, 2021-2031 (REVENUE, $MILLION)
TABLE 84. AUSTRALIA VEHICLE SCANNER MARKET, BY SCANNER TYPE, 2021-2031 (REVENUE, $MILLION)
TABLE 85. AUSTRALIA VEHICLE SCANNER MARKET, BY STRUCTURE TYPE, 2021-2031 (REVENUE, $MILLION)
TABLE 86. AUSTRALIA VEHICLE SCANNER MARKET, BY APPLICATION, 2021-2031 (REVENUE, $MILLION)
TABLE 87. AUSTRALIA VEHICLE SCANNER MARKET, BY COMPONENT, 2021-2031 (REVENUE, $MILLION)
TABLE 88. REST OF ASIA-PACIFIC VEHICLE SCANNER MARKET, BY SCANNER TYPE, 2021-2031 (REVENUE, $MILLION)
TABLE 89. REST OF ASIA-PACIFIC VEHICLE SCANNER MARKET, BY STRUCTURE TYPE, 2021-2031 (REVENUE, $MILLION)
TABLE 90. REST OF ASIA-PACIFIC VEHICLE SCANNER MARKET, BY APPLICATION, 2021-2031 (REVENUE, $MILLION)
TABLE 91. REST OF ASIA-PACIFIC VEHICLE SCANNER MARKET, BY COMPONENT, 2021-2031 (REVENUE, $MILLION)
TABLE 92. LAMEA VEHICLE SCANNER MARKET, BY SCANNER TYPE, 2021-2031 (REVENUE, $MILLION)
TABLE 93. LAMEA VEHICLE SCANNER MARKET, BY STRUCTURE TYPE, 2021-2031 (REVENUE, $MILLION)
TABLE 94. LAMEA VEHICLE SCANNER MARKET, BY APPLICATION, 2021-2031 (REVENUE, $MILLION)
TABLE 95. LAMEA VEHICLE SCANNER MARKET, BY COMPONENT, 2021-2031 (REVENUE, $MILLION)
TABLE 96. LAMEA VEHICLE SCANNER MARKET, BY COUNTRY, 2021-2031 (REVENUE, $MILLION)
TABLE 97. BRAZIL VEHICLE SCANNER MARKET, BY SCANNER TYPE, 2021-2031 (REVENUE, $MILLION)
TABLE 98. BRAZIL VEHICLE SCANNER MARKET, BY STRUCTURE TYPE, 2021-2031 (REVENUE, $MILLION)
TABLE 99. BRAZIL VEHICLE SCANNER MARKET, BY APPLICATION, 2021-2031 (REVENUE, $MILLION)
TABLE 100. BRAZIL VEHICLE SCANNER MARKET, BY COMPONENT, 2021-2031 (REVENUE, $MILLION)
TABLE 101. UAE VEHICLE SCANNER MARKET, BY SCANNER TYPE, 2021-2031 (REVENUE, $MILLION)
TABLE 102. UAE VEHICLE SCANNER MARKET, BY STRUCTURE TYPE, 2021-2031 (REVENUE, $MILLION)
TABLE 103. UAE VEHICLE SCANNER MARKET, BY APPLICATION, 2021-2031 (REVENUE, $MILLION)
TABLE 104. UAE VEHICLE SCANNER MARKET, BY COMPONENT, 2021-2031 (REVENUE, $MILLION)
TABLE 105. SAUDI ARABIA VEHICLE SCANNER MARKET, BY SCANNER TYPE, 2021-2031 (REVENUE, $MILLION)
TABLE 106. SAUDI ARABIA VEHICLE SCANNER MARKET, BY STRUCTURE TYPE, 2021-2031 (REVENUE, $MILLION)
TABLE 107. SAUDI ARABIA VEHICLE SCANNER MARKET, BY APPLICATION, 2021-2031 (REVENUE, $MILLION)
TABLE 108. SAUDI ARABIA VEHICLE SCANNER MARKET, BY COMPONENT, 2021-2031 (REVENUE, $MILLION)
TABLE 109. SOUTH AFRICA VEHICLE SCANNER MARKET, BY SCANNER TYPE, 2021-2031 (REVENUE, $MILLION)
TABLE 110. SOUTH AFRICA VEHICLE SCANNER MARKET, BY STRUCTURE TYPE, 2021-2031 (REVENUE, $MILLION)
TABLE 111. SOUTH AFRICA VEHICLE SCANNER MARKET, BY APPLICATION, 2021-2031 (REVENUE, $MILLION)
TABLE 112. SOUTH AFRICA VEHICLE SCANNER MARKET, BY COMPONENT, 2021-2031 (REVENUE, $MILLION)
TABLE 113. REST OF LAMEA VEHICLE SCANNER MARKET, BY SCANNER TYPE, 2021-2031 (REVENUE, $MILLION)
TABLE 114. REST OF LAMEA VEHICLE SCANNER MARKET, BY STRUCTURE TYPE, 2021-2031 (REVENUE, $MILLION)
TABLE 115. REST OF LAMEA VEHICLE SCANNER MARKET, BY APPLICATION, 2021-2031 (REVENUE, $MILLION)
TABLE 116. REST OF LAMEA VEHICLE SCANNER MARKET, BY COMPONENT, 2021-2031 (REVENUE, $MILLION)
TABLE 117. GATEKEEPER SECURITY INC.: KEY EXECUTIVES
TABLE 118. GATEKEEPER SECURITY INC.: COMPANY SNAPSHOT
TABLE 119. OMNITEC GROUP: KEY EXECUTIVES
TABLE 120. OMNITEC GROUP: COMPANY SNAPSHOT
TABLE 121. GODREJ & BOYCE MFG. CO. LTD.: KEY EXECUTIVES
TABLE 122. GODREJ & BOYCE MFG. CO. LTD.: COMPANY SNAPSHOT
TABLE 123. TESCON AG: KEY EXECUTIVES
TABLE 124. TESCON AG: COMPANY SNAPSHOT
TABLE 125. UVEYE: KEY EXECUTIVES
TABLE 126. UVEYE: COMPANY SNAPSHOT
TABLE 127. INTERNATIONAL ROAD DYNAMICS SOUTHA ASIA PVT. LTD.: KEY EXECUTIVES
TABLE 128. INTERNATIONAL ROAD DYNAMICS SOUTHA ASIA PVT. LTD.: COMPANY SNAPSHOT
TABLE 129. SECUSCAN: KEY EXECUTIVES
TABLE 130. SECUSCAN: COMPANY SNAPSHOT
TABLE 131. VMI SECURITY SYSTEM: KEY EXECUTIVES
TABLE 132. VMI SECURITY SYSTEM: COMPANY SNAPSHOT
TABLE 133. INTELLISCAN: KEY EXECUTIVES
TABLE 134. INTELLISCAN: COMPANY SNAPSHOT
TABLE 135. SCANLAB GMBH: KEY EXECUTIVES
TABLE 136. SCANLAB GMBH: COMPANY SNAPSHOT LIST OF FIGURES
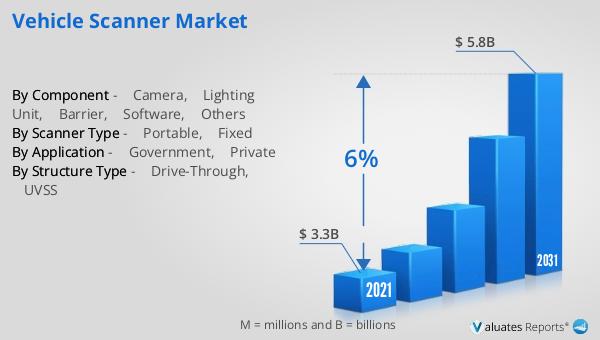
FIGURE 01. VEHICLE SCANNER MARKET, 2021-2031
FIGURE 02. SEGMENTATION OF VEHICLE SCANNER MARKET, 2021-2031
FIGURE 03. TOP INVESTMENT POCKETS IN VEHICLE SCANNER MARKET (2022-2031)
FIGURE 04. PORTER FIVE-1
FIGURE 05. PORTER FIVE-2
FIGURE 06. PORTER FIVE-3
FIGURE 07. PORTER FIVE-4
FIGURE 08. PORTER FIVE-5
FIGURE 09. DRIVERS, RESTRAINTS AND OPPORTUNITIES: GLOBALVEHICLE SCANNER MARKET
FIGURE 10. IMPACT OF KEY REGULATION: VEHICLE SCANNER MARKET
FIGURE 11. MARKET SHARE ANALYSIS: VEHICLE SCANNER MARKET
FIGURE 12. PATENT ANALYSIS BY COMPANY
FIGURE 13. PATENT ANALYSIS BY COUNTRY
FIGURE 14. REGULATORY GUIDELINES: VEHICLE SCANNER MARKET
FIGURE 15. VALUE CHAIN ANALYSIS: VEHICLE SCANNER MARKET
FIGURE 16. VEHICLE SCANNER MARKET, BY SCANNER TYPE, 2021(%)
FIGURE 17. COMPARATIVE SHARE ANALYSIS OF VEHICLE SCANNER MARKET FOR PORTABLE, BY COUNTRY 2021-2031(%)
FIGURE 18. COMPARATIVE SHARE ANALYSIS OF VEHICLE SCANNER MARKET FOR FIXED, BY COUNTRY 2021-2031(%)
FIGURE 19. VEHICLE SCANNER MARKET, BY STRUCTURE TYPE, 2021(%)
FIGURE 20. COMPARATIVE SHARE ANALYSIS OF VEHICLE SCANNER MARKET FOR DRIVE-THROUGH, BY COUNTRY 2021-2031(%)
FIGURE 21. COMPARATIVE SHARE ANALYSIS OF VEHICLE SCANNER MARKET FOR UVSS, BY COUNTRY 2021-2031(%)
FIGURE 22. VEHICLE SCANNER MARKET, BY APPLICATION, 2021(%)
FIGURE 23. COMPARATIVE SHARE ANALYSIS OF VEHICLE SCANNER MARKET FOR GOVERNMENT, BY COUNTRY 2021-2031(%)
FIGURE 24. COMPARATIVE SHARE ANALYSIS OF VEHICLE SCANNER MARKET FOR PRIVATE, BY COUNTRY 2021-2031(%)
FIGURE 25. VEHICLE SCANNER MARKET, BY COMPONENT, 2021(%)
FIGURE 26. COMPARATIVE SHARE ANALYSIS OF VEHICLE SCANNER MARKET FOR CAMERA, BY COUNTRY 2021-2031(%)
FIGURE 27. COMPARATIVE SHARE ANALYSIS OF VEHICLE SCANNER MARKET FOR LIGHTING UNIT, BY COUNTRY 2021-2031(%)
FIGURE 28. COMPARATIVE SHARE ANALYSIS OF VEHICLE SCANNER MARKET FOR BARRIER, BY COUNTRY 2021-2031(%)
FIGURE 29. COMPARATIVE SHARE ANALYSIS OF VEHICLE SCANNER MARKET FOR SOFTWARE, BY COUNTRY 2021-2031(%)
FIGURE 30. COMPARATIVE SHARE ANALYSIS OF VEHICLE SCANNER MARKET FOR OTHERS, BY COUNTRY 2021-2031(%)
FIGURE 31. VEHICLE SCANNER MARKET BY REGION, 2021
FIGURE 32. U.S. VEHICLE SCANNER MARKET, 2021-2031 ($MILLION)
FIGURE 33. CANADA VEHICLE SCANNER MARKET, 2021-2031 ($MILLION)
FIGURE 34. MEXICO VEHICLE SCANNER MARKET, 2021-2031 ($MILLION)
FIGURE 35. UK VEHICLE SCANNER MARKET, 2021-2031 ($MILLION)
FIGURE 36. GERMANY VEHICLE SCANNER MARKET, 2021-2031 ($MILLION)
FIGURE 37. FRANCE VEHICLE SCANNER MARKET, 2021-2031 ($MILLION)
FIGURE 38. SPAIN VEHICLE SCANNER MARKET, 2021-2031 ($MILLION)
FIGURE 39. ITALY VEHICLE SCANNER MARKET, 2021-2031 ($MILLION)
FIGURE 40. REST OF EUROPE VEHICLE SCANNER MARKET, 2021-2031 ($MILLION)
FIGURE 41. CHINA VEHICLE SCANNER MARKET, 2021-2031 ($MILLION)
FIGURE 42. INDIA VEHICLE SCANNER MARKET, 2021-2031 ($MILLION)
FIGURE 43. JAPAN VEHICLE SCANNER MARKET, 2021-2031 ($MILLION)
FIGURE 44. SOUTH KOREA VEHICLE SCANNER MARKET, 2021-2031 ($MILLION)
FIGURE 45. AUSTRALIA VEHICLE SCANNER MARKET, 2021-2031 ($MILLION)
FIGURE 46. REST OF ASIA-PACIFIC VEHICLE SCANNER MARKET, 2021-2031 ($MILLION)
FIGURE 47. BRAZIL VEHICLE SCANNER MARKET, 2021-2031 ($MILLION)
FIGURE 48. UAE VEHICLE SCANNER MARKET, 2021-2031 ($MILLION)
FIGURE 49. SAUDI ARABIA VEHICLE SCANNER MARKET, 2021-2031 ($MILLION)
FIGURE 50. SOUTH AFRICA VEHICLE SCANNER MARKET, 2021-2031 ($MILLION)
FIGURE 51. REST OF LAMEA VEHICLE SCANNER MARKET, 2021-2031 ($MILLION)
FIGURE 52. TOP WINNING STRATEGIES, BY YEAR
FIGURE 53. TOP WINNING STRATEGIES, BY DEVELOPMENT
FIGURE 54. TOP WINNING STRATEGIES, BY COMPANY
FIGURE 55. PRODUCT MAPPING OF TOP 10 PLAYERS
FIGURE 56. COMPETITIVE DASHBOARD
FIGURE 57. COMPETITIVE HEATMAP: VEHICLE SCANNER MARKET
FIGURE 58. TOP PLAYER POSITIONING, 202
SELECT A FORMAT
Added to Cart
Electronic (PDF)

$5730

This license allows only one user to access the PDF.
Electronic (PDF)

$6450

This license allows 1 - 5 user to access the PDF, license is suitable for small groups of 5 users working together
Electronic (PDF)

$9600

This license allows users/teams in a same Enterprise to use this report, various departments within an enterpise can use this report
Electronic (PDF)

$3840

This license just provides quantitative data in a excel sheet
Add to Cart
Buy Now (15% Discount)

OUR CUSTOMER

Nano String

SIMILAR REPORTS