0
U.S. (TOLL FREE)
+1 (315) 215-3225
Automative

0
U.S. (TOLL FREE)
+1 (315) 215-3225
Global Ultracapacitors Market By Type (Double Layered Capacitors, Pseudocapacitors, Hybrid Capacitors), By Application (Automotive, Consumer Electronics, Energy, Industrial, Others): Global Opportunity Analysis and Industry Forecast, 2021-2031
Published Date: March 2023
|
Report Code: ALLI-Auto-3F765
Home | Market Reports | Computers & Electronics| Electronics & Electrical| Electronic Components
Global Ultracapacitors Market By Type Double Layered Capacitors Pseudocapacitors Hybrid Capacitors By Application Automotive Consumer Electronics Energy Industrial Others Global Opportunity Analysis and Industry Forecast 2021 2031
BUY CHAPTERS

Global Ultracapacitors Market By Type (Double Layered Capacitors, Pseudocapacitors, Hybrid Capacitors), By Application (Automotive, Consumer Electronics, Energy, Industrial, Others): Global Opportunity Analysis and Industry Forecast, 2021-2031

Code: ALLI-Auto-3F765
Report
March 2023
Pages:297
Allied Market Research
Buy Now with 15% Discount
DESCRIPTION
TABLE OF CONTENT
TABLES & FIGURES

Ultracapacitors Market Size

According to a new report published by , titled, “Global Ultracapacitors Market," The global ultracapacitors market was valued at $1.7 billion in 2021, and is estimated to reach $6.6 billion by 2031, growing at a CAGR of 15.3% from 2022 to 2031.

Ultracapacitors Market

Ultracapacitors Market

Ultracapacitor charging and discharging also contributes to the maintenance of peak loads and backup power, which is important for continuous operation. Battery-powered industrial uses include smart meters, smoke alarms, video doorbells, and medical devices. Various suppliers are introducing new items to assist this. Texas Instruments (TI), for example, recently launched a new bidirectional buck/boost converter with a quiescent current (IQ) of 60 nA. Furthermore, as compared to commonly used hybrid-layer capacitors, the TPS61094 buck/boost converter contains a buck mode for supercapacitor charging while giving ultra-low IQ, allowing developers to extend battery life by up to 20%.
Further research is underway to develop affordable and innovative solutions based on existing supercapacitor technology. This highlights the need to provide a more affordable and environmentally friendly alternative to current models and reduce the manufacturing costs and reliance on critical components of carbon-based electrodes. For example, researchers at Imperial College London and University College London (UCL) recently developed more sustainable and energy-dense electrode materials for supercapacitors, paving the way for further market development of high-power, fast-charging EV technology.The increasing global demand for Electric Vehicles (EVs) is a chief driver for the growth of the supercapacitors market. Supercapacitors are utilized in electric vehicles for start-stop purposes and also aid in energy storage in conjunction with battery packs. In recent years, electric vehicles have been gaining traction in the automotive industry owing to its use of non-renewable energy and environmental sustainability.
The ultracapacitor market is segmented based on type, application, and region. By type, the market is bifurcated into double layered capacitors, pseudocapacitors, and hybrid capacitors. By application, the market is categorized into industrial, automotive, consumer electronics, energy, and others. In terms of region, the market is analyzed across North America (U.S., Canada, and Mexico), Europe (UK, Germany, France, and rest of Europe), Asia-Pacific (China, Japan, India, South Korea, and rest of Asia-Pacific) and LAMEA (Latin America, the Middle East, and Africa).Electric double-layer capacitors (EDLCs), sometimes known as supercapacitors or ultracapacitors, are energy storage technology with a quick and efficient energy storage and release mechanism. They look like ordinary capacitors, but their capacitance is much larger, allowing them to store significantly more energy per unit of space. Supercapacitors store energy by electrostatic interactions rather than chemical reactions, allowing them to charge and discharge far faster than batteries. This qualifies them for applications such as as electric cars, renewable energy systems, and consumer electronics, which require high power and fast discharge times.
One of the key factors supporting this trend is the increased usage of renewable energy sources and electric vehicles (EVs). Ultracapacitors are ideally suited for both applications due to their ability to store and release energy fast, which is critical for meeting the high power requirements of EVs and avoiding fluctuations in renewable energy supply. Furthermore, the growing need for portable and consumer devices is driving the supercapacitor industry. Supercapacitors may power small gadgets such as smartwatches and headphones, and they can also be used in conjunction with batteries to give quicker charging and a longer lifespan. However, the expensive cost of it, as well as the temperature limitations associated with supercapacitors/ultracapacitors, might impede industry expansion. Overall, the supercapacitor industry is expected to continue to grow. 
The key players profiled in the ultracapacitor market include NEC Corporation, LS MTRON LTD, Maxwell Technologies, Ness Capacitor Co., Ltd., Panasonic Corporation, KEMET Corporation (YAGEO Group), Nippon Chemi-Con Corporation, Eaton, and Skeleton Technologies. The players in the market have been actively engaged in the adoption of various strategies such as product launch, collaboration, innovation, acquisition, and others to remain competitive and gain an advantage over the competitors in the market. For example, in December 2022, EATON offered high-performance energy storage devices with particularly high capacity for reliable use in emergency power supply, pulse power and hybrid energy systems with the HS / HSL hybrid supercapacitors.  They can be used as a stand-alone energy storage device or in combination with batteries to optimize costs, service life and operating time.
Key Market Insights
By type, the pseudocapacitors segment dominated the ultracapacitors market, in terms of revenue in 2021, and is expected to follow the same trend during the forecast period.
By application, the automotive segment was the highest revenue contributor to the market, with $758.4 million in 2021, and is estimated to reach $3,185.4 million by 2031, with a CAGR of 16.01%.
Based on region, Asia-Pacific was the highest revenue contributor, accounting for $776.3 million in 2021, and is estimated to reach $3,315.0 million by 2031, with a CAGR of 16.21%.
By Country, China was the highest revenue contributor in 2021, and is estimated to reach significant CAGR during the forecast period.

Overview

Ultracapacitors are the ideal electrochemical energy storage devices that help bridge the gap between conventional capacitors and batteries. They use high surface area electrode materials and thin electrolytic dielectrics to achieve high capacitance.
Presently, there is an increase in demand for ultracapacitors in trains and aircraft is anticipated to drive the industry’s growth. The industry is also expected to grow due to the surge in demand for renewable energy sources and favorable government regulations. An increase in gasoline demand for fuel-efficient modes of transportation is anticipated to drive market growth in the future.
Factors such as surge in demand for long battery lifetime and effective wear & tear properties due to chemical reactions are driving the market demand. However, the high cost of ultracapacitors is expected to hinder market growth.
Moreover, technological advancements in the consumer electronics industry and growth in the automotive sector are expected to offer lucrative opportunities for the market globally. EThe ultracapacitor market is segmented based on type, vertical, and region. By type, it is categorized into double layered capacitors, pseudocapacitors, and hybrid capacitors. By vertical, it is divided into industrial, automotive, consumer electronics, energy, and others.
By region, the ultracapacitor market is analyzed across North America (the U.S., Canada, and Mexico), Europe (the UK, Germany, Italy, France, and rest of Europe), Asia-Pacific (China, India, Japan, South Korea, and rest of Asia-Pacific), and LAMEA (Latin America, the Middle East, and Africa).
The key players operating in the ultracapacitor market include   NEC Corporation, LS MTRON LTD, Maxwell Technologies, Ness Capacitor Co., Ltd., Panasonic Corporation, KEMET Corporation (YAGEO Group), Nippon Chemi-Con Corporation, Eaton, and Skeleton Technologies.

Key Benefits For Stakeholders

●This report provides a quantitative analysis of the market segments, current trends, estimations, and dynamics of the global ultracapacitors market analysis from 2021 to 2031 to identify the prevailing global ultracapacitors market opportunities.
●The market research is offered along with information related to key drivers, restraints, and opportunities.
●Porter's five forces analysis highlights the potency of buyers and suppliers to enable stakeholders make profit-oriented business decisions and strengthen their supplier-buyer network.
●In-depth analysis of the global ultracapacitors market segmentation assists to determine the prevailing market opportunities.
●Major countries in each region are mapped according to their revenue contribution to the global market.
●Market player positioning facilitates benchmarking and provides a clear understanding of the present position of the market players.
●The report includes the analysis of the regional as well as global global ultracapacitors market trends, key players, market segments, application areas, and market growth strategies.
Key Market Segments
○ Skeleton Technologie

Scope of Ultracapacitors Market Report

Report Metric Details
Report Name Ultracapacitors Market
Accounted market size in 2021 $ 1.7 billion
Forecasted market size in 2031 $ 6.6 billion
CAGR 15.3%
Base Year 2021
Forecasted years 2024 - 2031
By Type ● Double Layered Capacitors
● Pseudocapacitors
● Hybrid Capacitors
By Application ● Automotive
● Consumer Electronics
● Energy
● Industrial
● Others
By Region
  • North America (United States, Canada)
  • Europe (Germany, France, UK, Italy, Russia) Rest of Europe
  • Nordic Countries
  • Asia-Pacific (China, Japan, South Korea)
  • Southeast Asia (India, Australia)
  • Rest of Asia
  • Latin America (Mexico, Brazil)
  • Rest of Latin America
  • Middle East & Africa (Turkey, Saudi Arabia, UAE, Rest of MEA)
Forecast units USD million in value
Report coverage Revenue and volume forecast, company share, competitive landscape, growth factors and trends

FAQ for this report

How fast is Ultracapacitors Market growing?

Ans: The Ultracapacitors Market witnessing a CAGR of 15.3% during the forecast period 2024-2031.

What is the Ultracapacitors Market size in 2031?

Ans: The Ultracapacitors Market size in 2031 will be $ 6.6 billion.

What are the Application segmentation covered in the Ultracapacitors Market report?

Ans: The Applications covered in the Ultracapacitors Market report are ● Automotive, ● Consumer Electronics, ● Energy, ● Industrial, ● Others

What are the Type segmentation covered in the Ultracapacitors Market report?

Ans: The Types covered in the Ultracapacitors Market report are ● Double Layered Capacitors, ● Pseudocapacitors, ● Hybrid Capacitors

CHAPTER 1: INTRODUCTION
1.1. Report description
1.2. Key market segments
1.3. Key benefits to the stakeholders
1.4. Research Methodology
1.4.1. Primary research
1.4.2. Secondary research
1.4.3. Analyst tools and models
CHAPTER 2: EXECUTIVE SUMMARY
2.1. CXO Perspective
CHAPTER 3: MARKET OVERVIEW
3.1. Market definition and scope
3.2. Key findings
3.2.1. Top impacting factors
3.2.2. Top investment pockets
3.3. Porter’s five forces analysis
3.3.1. Bargaining power of suppliers
3.3.2. Bargaining power of buyers
3.3.3. Threat of substitutes
3.3.4. Threat of new entrants
3.3.5. Intensity of rivalry
3.4. Market dynamics
3.4.1. Drivers
3.4.1.1. Increased demand to boost grid infrastructure for increasing electricity accessibility
3.4.1.2. Propelling demand for ultracapacitors
3.4.2. Restraints
3.4.2.1. High cost associated with ultracapacitors
3.4.3. Opportunities
3.4.3.1. Increase in need for renewable energy industry
3.5. COVID-19 Impact Analysis on the market
CHAPTER 4: GLOBAL ULTRACAPACITORS MARKET, BY TYPE
4.1. Overview
4.1.1. Market size and forecast
4.2. Double Layered Capacitors
4.2.1. Key market trends, growth factors and opportunities
4.2.2. Market size and forecast, by region
4.2.3. Market share analysis by country
4.3. Pseudocapacitors
4.3.1. Key market trends, growth factors and opportunities
4.3.2. Market size and forecast, by region
4.3.3. Market share analysis by country
4.4. Hybrid Capacitors
4.4.1. Key market trends, growth factors and opportunities
4.4.2. Market size and forecast, by region
4.4.3. Market share analysis by country
CHAPTER 5: GLOBAL ULTRACAPACITORS MARKET, BY APPLICATION
5.1. Overview
5.1.1. Market size and forecast
5.2. Automotive
5.2.1. Key market trends, growth factors and opportunities
5.2.2. Market size and forecast, by region
5.2.3. Market share analysis by country
5.3. Consumer Electronics
5.3.1. Key market trends, growth factors and opportunities
5.3.2. Market size and forecast, by region
5.3.3. Market share analysis by country
5.4. Energy
5.4.1. Key market trends, growth factors and opportunities
5.4.2. Market size and forecast, by region
5.4.3. Market share analysis by country
5.5. Industrial
5.5.1. Key market trends, growth factors and opportunities
5.5.2. Market size and forecast, by region
5.5.3. Market share analysis by country
5.6. Others
5.6.1. Key market trends, growth factors and opportunities
5.6.2. Market size and forecast, by region
5.6.3. Market share analysis by country
CHAPTER 6: GLOBAL ULTRACAPACITORS MARKET, BY REGION
6.1. Overview
6.1.1. Market size and forecast By Region
6.2. North America
6.2.1. Key trends and opportunities
6.2.2. Market size and forecast, by Type
6.2.3. Market size and forecast, by Application
6.2.4. Market size and forecast, by country
6.2.4.1. U.S.
6.2.4.1.1. Key market trends, growth factors and opportunities
6.2.4.1.2. Market size and forecast, by Type
6.2.4.1.3. Market size and forecast, by Application
6.2.4.2. Canada
6.2.4.2.1. Key market trends, growth factors and opportunities
6.2.4.2.2. Market size and forecast, by Type
6.2.4.2.3. Market size and forecast, by Application
6.2.4.3. Mexico
6.2.4.3.1. Key market trends, growth factors and opportunities
6.2.4.3.2. Market size and forecast, by Type
6.2.4.3.3. Market size and forecast, by Application
6.3. Europe
6.3.1. Key trends and opportunities
6.3.2. Market size and forecast, by Type
6.3.3. Market size and forecast, by Application
6.3.4. Market size and forecast, by country
6.3.4.1. UK
6.3.4.1.1. Key market trends, growth factors and opportunities
6.3.4.1.2. Market size and forecast, by Type
6.3.4.1.3. Market size and forecast, by Application
6.3.4.2. Germany
6.3.4.2.1. Key market trends, growth factors and opportunities
6.3.4.2.2. Market size and forecast, by Type
6.3.4.2.3. Market size and forecast, by Application
6.3.4.3. France
6.3.4.3.1. Key market trends, growth factors and opportunities
6.3.4.3.2. Market size and forecast, by Type
6.3.4.3.3. Market size and forecast, by Application
6.3.4.4. Rest of Europe
6.3.4.4.1. Key market trends, growth factors and opportunities
6.3.4.4.2. Market size and forecast, by Type
6.3.4.4.3. Market size and forecast, by Application
6.4. Asia-Pacific
6.4.1. Key trends and opportunities
6.4.2. Market size and forecast, by Type
6.4.3. Market size and forecast, by Application
6.4.4. Market size and forecast, by country
6.4.4.1. China
6.4.4.1.1. Key market trends, growth factors and opportunities
6.4.4.1.2. Market size and forecast, by Type
6.4.4.1.3. Market size and forecast, by Application
6.4.4.2. Japan
6.4.4.2.1. Key market trends, growth factors and opportunities
6.4.4.2.2. Market size and forecast, by Type
6.4.4.2.3. Market size and forecast, by Application
6.4.4.3. India
6.4.4.3.1. Key market trends, growth factors and opportunities
6.4.4.3.2. Market size and forecast, by Type
6.4.4.3.3. Market size and forecast, by Application
6.4.4.4. South Korea
6.4.4.4.1. Key market trends, growth factors and opportunities
6.4.4.4.2. Market size and forecast, by Type
6.4.4.4.3. Market size and forecast, by Application
6.4.4.5. Rest of Asia-Pacific
6.4.4.5.1. Key market trends, growth factors and opportunities
6.4.4.5.2. Market size and forecast, by Type
6.4.4.5.3. Market size and forecast, by Application
6.5. LAMEA
6.5.1. Key trends and opportunities
6.5.2. Market size and forecast, by Type
6.5.3. Market size and forecast, by Application
6.5.4. Market size and forecast, by country
6.5.4.1. Latin America
6.5.4.1.1. Key market trends, growth factors and opportunities
6.5.4.1.2. Market size and forecast, by Type
6.5.4.1.3. Market size and forecast, by Application
6.5.4.2. Middle East
6.5.4.2.1. Key market trends, growth factors and opportunities
6.5.4.2.2. Market size and forecast, by Type
6.5.4.2.3. Market size and forecast, by Application
6.5.4.3. Africa
6.5.4.3.1. Key market trends, growth factors and opportunities
6.5.4.3.2. Market size and forecast, by Type
6.5.4.3.3. Market size and forecast, by Application
CHAPTER 7: COMPETITIVE LANDSCAPE
7.1. Introduction
7.2. Top winning strategies
7.3. Product Mapping of Top 10 Player
7.4. Competitive Dashboard
7.5. Competitive Heatmap
7.6. Top player positioning, 2021
CHAPTER 8: COMPANY PROFILES
8.1. Maxwell Technologies
8.1.1. Company overview
8.1.2. Key Executives
8.1.3. Company snapshot
8.1.4. Operating business segments
8.1.5. Product portfolio
8.2. NEC Corporation
8.2.1. Company overview
8.2.2. Key Executives
8.2.3. Company snapshot
8.2.4. Operating business segments
8.2.5. Product portfolio
8.2.6. Business performance
8.3. Ness Capacitor Co., Ltd.
8.3.1. Company overview
8.3.2. Key Executives
8.3.3. Company snapshot
8.3.4. Operating business segments
8.3.5. Product portfolio
8.4. LS MTRON LTD
8.4.1. Company overview
8.4.2. Key Executives
8.4.3. Company snapshot
8.4.4. Operating business segments
8.4.5. Product portfolio
8.4.6. Key strategic moves and developments
8.5. Panasonic Corporation
8.5.1. Company overview
8.5.2. Key Executives
8.5.3. Company snapshot
8.5.4. Operating business segments
8.5.5. Product portfolio
8.5.6. Business performance
8.5.7. Key strategic moves and developments
8.6. KEMET Corporation (YAGEO Group)
8.6.1. Company overview
8.6.2. Key Executives
8.6.3. Company snapshot
8.6.4. Operating business segments
8.6.5. Product portfolio
8.6.6. Business performance
8.6.7. Key strategic moves and developments
8.7. Eaton
8.7.1. Company overview
8.7.2. Key Executives
8.7.3. Company snapshot
8.7.4. Operating business segments
8.7.5. Product portfolio
8.7.6. Business performance
8.7.7. Key strategic moves and developments
8.8. Nippon Chemi-Con Corporation
8.8.1. Company overview
8.8.2. Key Executives
8.8.3. Company snapshot
8.8.4. Operating business segments
8.8.5. Product portfolio
8.8.6. Business performance
8.8.7. Key strategic moves and developments
8.9. Skeleton Technologies
8.9.1. Company overview
8.9.2. Key Executives
8.9.3. Company snapshot
8.9.4. Operating business segments
8.9.5. Product portfolio
8.9.6. Key strategic moves and development
LIST OF TABLES
TABLE 01. GLOBAL GLOBAL ULTRACAPACITORS MARKET, BY TYPE, 2021-2031 ($MILLION)
TABLE 02. GLOBAL ULTRACAPACITORS MARKET FOR DOUBLE LAYERED CAPACITORS, BY REGION, 2021-2031 ($MILLION)
TABLE 03. GLOBAL ULTRACAPACITORS MARKET FOR PSEUDOCAPACITORS, BY REGION, 2021-2031 ($MILLION)
TABLE 04. GLOBAL ULTRACAPACITORS MARKET FOR HYBRID CAPACITORS, BY REGION, 2021-2031 ($MILLION)
TABLE 05. GLOBAL GLOBAL ULTRACAPACITORS MARKET, BY APPLICATION, 2021-2031 ($MILLION)
TABLE 06. GLOBAL ULTRACAPACITORS MARKET FOR AUTOMOTIVE, BY REGION, 2021-2031 ($MILLION)
TABLE 07. GLOBAL ULTRACAPACITORS MARKET FOR CONSUMER ELECTRONICS, BY REGION, 2021-2031 ($MILLION)
TABLE 08. GLOBAL ULTRACAPACITORS MARKET FOR ENERGY, BY REGION, 2021-2031 ($MILLION)
TABLE 09. GLOBAL ULTRACAPACITORS MARKET FOR INDUSTRIAL, BY REGION, 2021-2031 ($MILLION)
TABLE 10. GLOBAL ULTRACAPACITORS MARKET FOR OTHERS, BY REGION, 2021-2031 ($MILLION)
TABLE 11. GLOBAL ULTRACAPACITORS MARKET, BY REGION, 2021-2031 ($MILLION)
TABLE 12. NORTH AMERICA GLOBAL ULTRACAPACITORS MARKET, BY TYPE, 2021-2031 ($MILLION)
TABLE 13. NORTH AMERICA GLOBAL ULTRACAPACITORS MARKET, BY APPLICATION, 2021-2031 ($MILLION)
TABLE 14. NORTH AMERICA GLOBAL ULTRACAPACITORS MARKET, BY COUNTRY, 2021-2031 ($MILLION)
TABLE 15. U.S. GLOBAL ULTRACAPACITORS MARKET, BY TYPE, 2021-2031 ($MILLION)
TABLE 16. U.S. GLOBAL ULTRACAPACITORS MARKET, BY APPLICATION, 2021-2031 ($MILLION)
TABLE 17. CANADA GLOBAL ULTRACAPACITORS MARKET, BY TYPE, 2021-2031 ($MILLION)
TABLE 18. CANADA GLOBAL ULTRACAPACITORS MARKET, BY APPLICATION, 2021-2031 ($MILLION)
TABLE 19. MEXICO GLOBAL ULTRACAPACITORS MARKET, BY TYPE, 2021-2031 ($MILLION)
TABLE 20. MEXICO GLOBAL ULTRACAPACITORS MARKET, BY APPLICATION, 2021-2031 ($MILLION)
TABLE 21. EUROPE GLOBAL ULTRACAPACITORS MARKET, BY TYPE, 2021-2031 ($MILLION)
TABLE 22. EUROPE GLOBAL ULTRACAPACITORS MARKET, BY APPLICATION, 2021-2031 ($MILLION)
TABLE 23. EUROPE GLOBAL ULTRACAPACITORS MARKET, BY COUNTRY, 2021-2031 ($MILLION)
TABLE 24. UK GLOBAL ULTRACAPACITORS MARKET, BY TYPE, 2021-2031 ($MILLION)
TABLE 25. UK GLOBAL ULTRACAPACITORS MARKET, BY APPLICATION, 2021-2031 ($MILLION)
TABLE 26. GERMANY GLOBAL ULTRACAPACITORS MARKET, BY TYPE, 2021-2031 ($MILLION)
TABLE 27. GERMANY GLOBAL ULTRACAPACITORS MARKET, BY APPLICATION, 2021-2031 ($MILLION)
TABLE 28. FRANCE GLOBAL ULTRACAPACITORS MARKET, BY TYPE, 2021-2031 ($MILLION)
TABLE 29. FRANCE GLOBAL ULTRACAPACITORS MARKET, BY APPLICATION, 2021-2031 ($MILLION)
TABLE 30. REST OF EUROPE GLOBAL ULTRACAPACITORS MARKET, BY TYPE, 2021-2031 ($MILLION)
TABLE 31. REST OF EUROPE GLOBAL ULTRACAPACITORS MARKET, BY APPLICATION, 2021-2031 ($MILLION)
TABLE 32. ASIA-PACIFIC GLOBAL ULTRACAPACITORS MARKET, BY TYPE, 2021-2031 ($MILLION)
TABLE 33. ASIA-PACIFIC GLOBAL ULTRACAPACITORS MARKET, BY APPLICATION, 2021-2031 ($MILLION)
TABLE 34. ASIA-PACIFIC GLOBAL ULTRACAPACITORS MARKET, BY COUNTRY, 2021-2031 ($MILLION)
TABLE 35. CHINA GLOBAL ULTRACAPACITORS MARKET, BY TYPE, 2021-2031 ($MILLION)
TABLE 36. CHINA GLOBAL ULTRACAPACITORS MARKET, BY APPLICATION, 2021-2031 ($MILLION)
TABLE 37. JAPAN GLOBAL ULTRACAPACITORS MARKET, BY TYPE, 2021-2031 ($MILLION)
TABLE 38. JAPAN GLOBAL ULTRACAPACITORS MARKET, BY APPLICATION, 2021-2031 ($MILLION)
TABLE 39. INDIA GLOBAL ULTRACAPACITORS MARKET, BY TYPE, 2021-2031 ($MILLION)
TABLE 40. INDIA GLOBAL ULTRACAPACITORS MARKET, BY APPLICATION, 2021-2031 ($MILLION)
TABLE 41. SOUTH KOREA GLOBAL ULTRACAPACITORS MARKET, BY TYPE, 2021-2031 ($MILLION)
TABLE 42. SOUTH KOREA GLOBAL ULTRACAPACITORS MARKET, BY APPLICATION, 2021-2031 ($MILLION)
TABLE 43. REST OF ASIA-PACIFIC GLOBAL ULTRACAPACITORS MARKET, BY TYPE, 2021-2031 ($MILLION)
TABLE 44. REST OF ASIA-PACIFIC GLOBAL ULTRACAPACITORS MARKET, BY APPLICATION, 2021-2031 ($MILLION)
TABLE 45. LAMEA GLOBAL ULTRACAPACITORS MARKET, BY TYPE, 2021-2031 ($MILLION)
TABLE 46. LAMEA GLOBAL ULTRACAPACITORS MARKET, BY APPLICATION, 2021-2031 ($MILLION)
TABLE 47. LAMEA GLOBAL ULTRACAPACITORS MARKET, BY COUNTRY, 2021-2031 ($MILLION)
TABLE 48. LATIN AMERICA GLOBAL ULTRACAPACITORS MARKET, BY TYPE, 2021-2031 ($MILLION)
TABLE 49. LATIN AMERICA GLOBAL ULTRACAPACITORS MARKET, BY APPLICATION, 2021-2031 ($MILLION)
TABLE 50. MIDDLE EAST GLOBAL ULTRACAPACITORS MARKET, BY TYPE, 2021-2031 ($MILLION)
TABLE 51. MIDDLE EAST GLOBAL ULTRACAPACITORS MARKET, BY APPLICATION, 2021-2031 ($MILLION)
TABLE 52. AFRICA GLOBAL ULTRACAPACITORS MARKET, BY TYPE, 2021-2031 ($MILLION)
TABLE 53. AFRICA GLOBAL ULTRACAPACITORS MARKET, BY APPLICATION, 2021-2031 ($MILLION)
TABLE 54. MAXWELL TECHNOLOGIES: KEY EXECUTIVES
TABLE 55. MAXWELL TECHNOLOGIES: COMPANY SNAPSHOT
TABLE 56. MAXWELL TECHNOLOGIES: PRODUCT SEGMENTS
TABLE 57. MAXWELL TECHNOLOGIES: PRODUCT PORTFOLIO
TABLE 58. NEC CORPORATION: KEY EXECUTIVES
TABLE 59. NEC CORPORATION: COMPANY SNAPSHOT
TABLE 60. NEC CORPORATION: SERVICE SEGMENTS
TABLE 61. NEC CORPORATION: PRODUCT PORTFOLIO
TABLE 62. NESS CAPACITOR CO., LTD.: KEY EXECUTIVES
TABLE 63. NESS CAPACITOR CO., LTD.: COMPANY SNAPSHOT
TABLE 64. NESS CAPACITOR CO., LTD.: PRODUCT SEGMENTS
TABLE 65. NESS CAPACITOR CO., LTD.: PRODUCT PORTFOLIO
TABLE 66. LS MTRON LTD: KEY EXECUTIVES
TABLE 67. LS MTRON LTD: COMPANY SNAPSHOT
TABLE 68. LS MTRON LTD: PRODUCT SEGMENTS
TABLE 69. LS MTRON LTD: PRODUCT PORTFOLIO
TABLE 70. LS MTRON LTD: KEY STRATERGIES
TABLE 71. PANASONIC CORPORATION: KEY EXECUTIVES
TABLE 72. PANASONIC CORPORATION: COMPANY SNAPSHOT
TABLE 73. PANASONIC CORPORATION: SERVICE SEGMENTS
TABLE 74. PANASONIC CORPORATION: PRODUCT PORTFOLIO
TABLE 75. PANASONIC CORPORATION: KEY STRATERGIES
TABLE 76. KEMET CORPORATION (YAGEO GROUP): KEY EXECUTIVES
TABLE 77. KEMET CORPORATION (YAGEO GROUP): COMPANY SNAPSHOT
TABLE 78. KEMET CORPORATION (YAGEO GROUP): PRODUCT SEGMENTS
TABLE 79. KEMET CORPORATION (YAGEO GROUP): PRODUCT PORTFOLIO
TABLE 80. KEMET CORPORATION (YAGEO GROUP): KEY STRATERGIES
TABLE 81. EATON: KEY EXECUTIVES
TABLE 82. EATON: COMPANY SNAPSHOT
TABLE 83. EATON: SERVICE SEGMENTS
TABLE 84. EATON: PRODUCT PORTFOLIO
TABLE 85. EATON: KEY STRATERGIES
TABLE 86. NIPPON CHEMI-CON CORPORATION: KEY EXECUTIVES
TABLE 87. NIPPON CHEMI-CON CORPORATION: COMPANY SNAPSHOT
TABLE 88. NIPPON CHEMI-CON CORPORATION: SERVICE SEGMENTS
TABLE 89. NIPPON CHEMI-CON CORPORATION: PRODUCT PORTFOLIO
TABLE 90. NIPPON CHEMI-CON CORPORATION: KEY STRATERGIES
TABLE 91. SKELETON TECHNOLOGIES: KEY EXECUTIVES
TABLE 92. SKELETON TECHNOLOGIES: COMPANY SNAPSHOT
TABLE 93. SKELETON TECHNOLOGIES: PRODUCT SEGMENTS
TABLE 94. SKELETON TECHNOLOGIES: PRODUCT PORTFOLIO
TABLE 95. SKELETON TECHNOLOGIES: KEY STRATERGIES LIST OF FIGURES
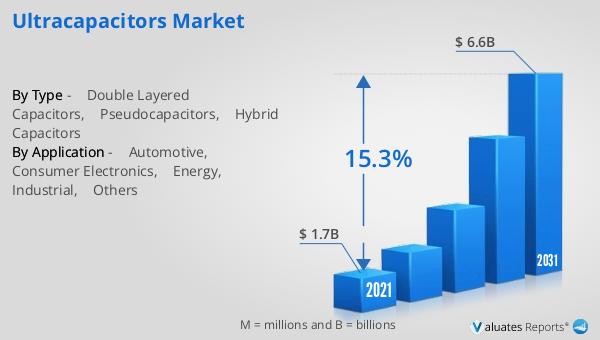
FIGURE 01. GLOBAL ULTRACAPACITORS MARKET, 2021-2031
FIGURE 02. SEGMENTATION OF GLOBAL ULTRACAPACITORS MARKET, 2021-2031
FIGURE 03. TOP INVESTMENT POCKETS IN GLOBAL ULTRACAPACITORS MARKET (2022-2031)
FIGURE 04. LOW BARGAINING POWER OF SUPPLIERS
FIGURE 05. MODERATE TO HIGH BARGAINING POWER OF BUYERS
FIGURE 06. LOW TO MODERATE THREAT OF SUBSTITUTES
FIGURE 07. MODERATE THREAT OF NEW ENTRANTS
FIGURE 08. HIGH INTENSITY OF RIVALRY
FIGURE 09. DRIVERS, RESTRAINTS AND OPPORTUNITIES: GLOBALGLOBAL ULTRACAPACITORS MARKET
FIGURE 10. GLOBAL ULTRACAPACITORS MARKET, BY TYPE, 2021(%)
FIGURE 11. COMPARATIVE SHARE ANALYSIS OF GLOBAL ULTRACAPACITORS MARKET FOR DOUBLE LAYERED CAPACITORS, BY COUNTRY 2021 AND 2031(%)
FIGURE 12. COMPARATIVE SHARE ANALYSIS OF GLOBAL ULTRACAPACITORS MARKET FOR PSEUDOCAPACITORS, BY COUNTRY 2021 AND 2031(%)
FIGURE 13. COMPARATIVE SHARE ANALYSIS OF GLOBAL ULTRACAPACITORS MARKET FOR HYBRID CAPACITORS, BY COUNTRY 2021 AND 2031(%)
FIGURE 14. GLOBAL ULTRACAPACITORS MARKET, BY APPLICATION, 2021(%)
FIGURE 15. COMPARATIVE SHARE ANALYSIS OF GLOBAL ULTRACAPACITORS MARKET FOR AUTOMOTIVE, BY COUNTRY 2021 AND 2031(%)
FIGURE 16. COMPARATIVE SHARE ANALYSIS OF GLOBAL ULTRACAPACITORS MARKET FOR CONSUMER ELECTRONICS, BY COUNTRY 2021 AND 2031(%)
FIGURE 17. COMPARATIVE SHARE ANALYSIS OF GLOBAL ULTRACAPACITORS MARKET FOR ENERGY, BY COUNTRY 2021 AND 2031(%)
FIGURE 18. COMPARATIVE SHARE ANALYSIS OF GLOBAL ULTRACAPACITORS MARKET FOR INDUSTRIAL, BY COUNTRY 2021 AND 2031(%)
FIGURE 19. COMPARATIVE SHARE ANALYSIS OF GLOBAL ULTRACAPACITORS MARKET FOR OTHERS, BY COUNTRY 2021 AND 2031(%)
FIGURE 20. GLOBAL ULTRACAPACITORS MARKET BY REGION, 2021
FIGURE 21. U.S. GLOBAL ULTRACAPACITORS MARKET, 2021-2031 ($MILLION)
FIGURE 22. CANADA GLOBAL ULTRACAPACITORS MARKET, 2021-2031 ($MILLION)
FIGURE 23. MEXICO GLOBAL ULTRACAPACITORS MARKET, 2021-2031 ($MILLION)
FIGURE 24. UK GLOBAL ULTRACAPACITORS MARKET, 2021-2031 ($MILLION)
FIGURE 25. GERMANY GLOBAL ULTRACAPACITORS MARKET, 2021-2031 ($MILLION)
FIGURE 26. FRANCE GLOBAL ULTRACAPACITORS MARKET, 2021-2031 ($MILLION)
FIGURE 27. REST OF EUROPE GLOBAL ULTRACAPACITORS MARKET, 2021-2031 ($MILLION)
FIGURE 28. CHINA GLOBAL ULTRACAPACITORS MARKET, 2021-2031 ($MILLION)
FIGURE 29. JAPAN GLOBAL ULTRACAPACITORS MARKET, 2021-2031 ($MILLION)
FIGURE 30. INDIA GLOBAL ULTRACAPACITORS MARKET, 2021-2031 ($MILLION)
FIGURE 31. SOUTH KOREA GLOBAL ULTRACAPACITORS MARKET, 2021-2031 ($MILLION)
FIGURE 32. REST OF ASIA-PACIFIC GLOBAL ULTRACAPACITORS MARKET, 2021-2031 ($MILLION)
FIGURE 33. LATIN AMERICA GLOBAL ULTRACAPACITORS MARKET, 2021-2031 ($MILLION)
FIGURE 34. MIDDLE EAST GLOBAL ULTRACAPACITORS MARKET, 2021-2031 ($MILLION)
FIGURE 35. AFRICA GLOBAL ULTRACAPACITORS MARKET, 2021-2031 ($MILLION)
FIGURE 36. TOP WINNING STRATEGIES, BY YEAR
FIGURE 37. TOP WINNING STRATEGIES, BY DEVELOPMENT
FIGURE 38. TOP WINNING STRATEGIES, BY COMPANY
FIGURE 39. PRODUCT MAPPING OF TOP 10 PLAYERS
FIGURE 40. COMPETITIVE DASHBOARD
FIGURE 41. COMPETITIVE HEATMAP: GLOBAL ULTRACAPACITORS MARKET
FIGURE 42. TOP PLAYER POSITIONING, 2021
FIGURE 43. NEC CORPORATION: NET REVENUE, 2020-2022 ($MILLION)
FIGURE 44. NEC CORPORATION: REVENUE SHARE BY SEGMENT, 2022 (%)
FIGURE 45. NEC CORPORATION: REVENUE SHARE BY REGION, 2022 (%)
FIGURE 46. PANASONIC CORPORATION: NET REVENUE, 2019-2021 ($MILLION)
FIGURE 47. PANASONIC CORPORATION: REVENUE SHARE BY REGION, 2021 (%)
FIGURE 48. PANASONIC CORPORATION: REVENUE SHARE BY REGION, 2021 (%)
FIGURE 49. KEMET CORPORATION (YAGEO GROUP): NET REVENUE, 2019-2021 ($MILLION)
FIGURE 50. KEMET CORPORATION (YAGEO GROUP): RESEARCH & DEVELOPMENT EXPENDITURE, 2019-2021 ($MILLION)
FIGURE 51. EATON: NET REVENUE, 2019-2021 ($MILLION)
FIGURE 52. EATON: RESEARCH & DEVELOPMENT EXPENDITURE, 2019-2021 ($MILLION)
FIGURE 53. EATON: REVENUE SHARE BY SEGMENT, 2021 (%)
FIGURE 54. EATON: REVENUE SHARE BY REGION, 2021 (%)
FIGURE 55. NIPPON CHEMI-CON CORPORATION: NET REVENUE, 2020-2022 ($MILLION)
FIGURE 56. NIPPON CHEMI-CON CORPORATION: RESEARCH & DEVELOPMENT EXPENDITURE, 2020-2022 ($MILLION
SELECT A FORMAT
Added to Cart
Electronic (PDF)

$5730

This license allows only one user to access the PDF.
Electronic (PDF)

$6450

This license allows 1 - 5 user to access the PDF, license is suitable for small groups of 5 users working together
Electronic (PDF)

$9600

This license allows users/teams in a same Enterprise to use this report, various departments within an enterpise can use this report
Electronic (PDF)

$3840

This license just provides quantitative data in a excel sheet
Add to Cart
Buy Now (15% Discount)

OUR CUSTOMER

Samsung SD

SIMILAR REPORTS


RELATED REPORTS

Global Thyristor Discs Market Research Report 2025

120 Pages
Type: Report
Code: QYRE-Auto-14J20228
Wed Dec 03 00:00:00 UTC 2025

Add to Cart

Global Thyristor Drives Market Research Report 2025

120 Pages
Type: Report
Code: QYRE-Auto-27X19827
Wed Dec 03 00:00:00 UTC 2025

Add to Cart

Global Analog Electrical Conductivity Sensors Market Research Report 2025

120 Pages
Type: Report
Code: QYRE-Auto-25L19925
Wed Dec 03 00:00:00 UTC 2025

Add to Cart

Global Potentiometer Transducers Market Research Report 2025

120 Pages
Type: Report
Code: QYRE-Auto-33U20003
Tue Dec 02 00:00:00 UTC 2025

Add to Cart