
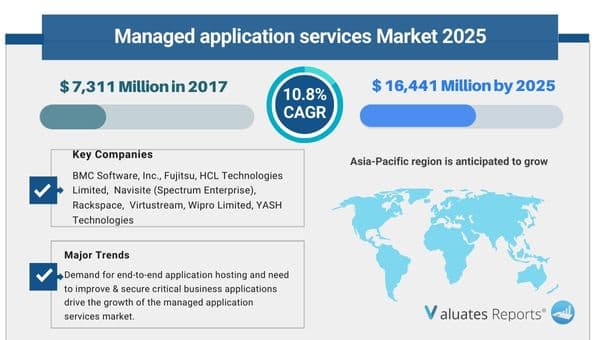
The global managed application services market size was USD 7,311 Million in 2017 and is projected to reach USD 16,441 Million by 2025, growing at a CAGR of 10.8% from 2018 to 2025.
Managed application services transform application portfolios into smooth running operations that facilitate accomplishment of business goals. These services provide experienced IT professionals methodologies to maintain, support, and improve important applications of an organization. They are adopted by numerous enterprises to manage the existing business-critical applications and exclusively focus on core competencies of the business.
Rise in demand for end-to-end application hosting and need to improve & secure critical business applications drive the growth of the managed application services market. However, risks associated with application data security are expected to impede the market growth. Furthermore, rise in application complexity and growth in investment in managed application services by small and medium enterprises (SME) are expected to present major opportunities for this market in future.
The global managed application services market is segmented based on service type, organization size, application type, industry vertical, and region. Based on service type, it is divided into operational services, application service desk, application hosting, application security & disaster recovery services, and application infrastructure. Based on organization size, the market is bifurcated into small & medium-sized enterprises (SMEs) & large enterprises. Based on application type, the market is classified into web-based applications and mobile applications. Based on industry vertical, it is divided into telecom & IT, government, healthcare, BFSI, retail, energy & utilities, and others. Based on region, the market is analyzed across North America, Europe, Asia-Pacific, and LAMEA.

Top impacting factors
An increase in demand for end-to-end application hosting, need to improve and secure critical business applications, and surge in application complexity drive the demand for managed application services market. However, risks associated with application data security hamper the market growth.
Increase in demand for end-to-end application hosting:
The rise in demand for end-to-end application hosting due to its numerous benefits is expected to boost the growth of the market. It includes benefits such as no vendor installation, low costs, minimized risk, no long-term commitment, backups, and security.
Application hosting allows access from a remote cloud infrastructure through the internet. Growth in adoption of cloud technology has created a huge demand for managed application hosting services. Application hosting services enable clients to focus on improving the application instead of worrying about the infrastructure issues. Cloud engineers manage the infrastructure including OS patches, upgrades, monitoring, and others to enable development teams focus on core business objectives. The need to assess applications throughout their lifecycles further drives the growth of this market.
Need to improve and secure critical business applications:
Managed application services facilitate monitoring and maintenance of business applications by a managed service provider for a subscription-based fee for SMEs as well as large enterprises, thus, reducing the risk of downtime. Large enterprises have realized the importance of reducing IT downtime for business applications as leads to a considerable loss of revenue. Further, increase in need for business continuity and disaster recovery services owing to rise in business risks caused by application vulnerability fuel the growth of the global managed application services market. Thus, organizations adopt managed application services to alleviate risk of downtime.
Furthermore, managed application services providers have access to skill pools for managing various critical business applications. This is advantageous for the organization as it helps to save the cost associated with hiring the required IT talent and technical expertise.
Hence, managed application services are being adopted by enterprises to improve the performance, system availability, application uptime, and security of business-critical applications across all sectors.
Increase in application complexity:
Implementation of managed application services has provided organizations with considerable opportunities to improve agility, efficiency, speed, and manageability within their IT environments. Moreover, use of these services improves efficiency and performance of application infrastructure without making additional investments in hardware. Increased complexity of application infrastructure owing to the adoption of hybrid models in large enterprises is opportunistic for the managed application services market. In addition, ongoing trend of application modernization due to improved digital expertise of an organization drives the growth of this market. Furthermore, the trend of minimizing capital as well as operating expenditure is anticipated to create large opportunities for this market. Owing to its numerous advantages, several companies have invested in managed application services technology, which is expected to provide lucrative opportunities for the market.
Risks associated with application data security:
The managed application services come with security concerns of application data, which impedes the growth of the market. Organizations find it difficult to trust third-party companies while operating the business-critical application data. This lack of trust by other organizations on third party managed application service providers results in hesitancy for adopting managed services, which in turn hampers the growth of this market.
The report provides the profiles of key players, namely BMC Software, Inc., Rackspace US, Inc., DXC.Technology Company, Fujitsu, HCL Technologies Limited, International Business Management (IBM) Corporation, Wipro Limited, Navisite (Spectrum Enterprise), Virtustream, and YASH Technologies.
Key Benefits For Managed Application Services Market
.jpg)
|
Report Metric |
Details |
|
Report Name |
Managed Application Services Market |
|
Market size value in 2017 |
USD 7,311 Million |
|
Revenue forecast in 2025 |
USD 16,441 Million |
|
Growth Rate |
10.8% |
|
Base year considered |
2017 |
|
Forecast Period |
2018-2025 |
|
By Type |
Operational services, Application service desk, Application hosting, Application security, and disaster recovery, Application Infrastructure |
|
By Application |
Web-based applications, Mobile applications |
|
Report Coverage |
Revenue & volume forecast, company share, competitive landscape, growth factors, and trends |
|
Segments Covered |
By Type, Application, and Region |
|
Geographic Regions Covered |
North America, Europe, Asia Pacific, Latin America, Middle East & Africa |
Ans. Due to the COVID-19 pandemic, The global managed application services market size was USD 7,311 Million in 2017 and is projected to reach USD 16,441 Million by 2025, growing at a CAGR of 10.8% from 2018 to 2025.
Ans. Some of the Major companies are BMC Software, Inc., Fujitsu, HCL Technologies Limited, International Business Management (IBM) Corporation, Navisite (Spectrum Enterprise), Rackspace, Virtustream, Wipro Limited, YASH Technologies
Ans. Yes, the report includes a COVID-19 impact analysis. Also, it is further extended into every individual segment of the report.
List of Tables & Figures
Table 01. Global Managed Application Services Market Revenue, By Services, 20172025 ($Million)
Table 02. Managed Application Services Market Revenue For Operational Services, By Region, 20172025 ($Million)
Table 03. Managed Application Services Market Revenue For Application Service Desk, By Region, 20172025 ($Million)
Table 04. Managed Application Services Market Revenue For Application Hosting, By Region, 20172025 ($Million)
Table 05. Managed Application Services Market Revenue For Application Security And Disaster Recovery, By Region, 20172025 ($Million)
Table 06. Managed Application Services Market Revenue For Application Infrastructure, By Region, 20172025 ($Million)
Table 07. Global Managed Application Services Market Revenue, By Organization Size, 20172025 ($Million)
Table 08. Managed Application Services Market Revenue For Smes, By Region, 20172025 ($Million)
Table 09. Managed Application Services Market Revenue For Large Enterprises, By Region, 20172025 ($Million)
Table 10. Global Managed Application Services Market Revenue, By Application Type, 20172025 ($Million)
Table 11. Managed Application Services Market Revenue For Web-based Applications, By Region, 20172025 ($Million)
Table 12. Managed Application Services Market Revenue For Mobile Applications, By Region, 20172025 ($Million)
Table 13. Global Managed Application Services Market Revenue, By Industry Verticals, 20172025 ($Million)
Table 14. Managed Application Services Market Revenue For Telecom & It, By Region, 20172025 ($Million)
Table 15. Managed Application Services Market Revenue For Government, By Region, 20172025 ($Million)
Table 16. Managed Application Services Market Revenue For Healthcare, By Region, 20172025 ($Million)
Table 17. Managed Application Services Market Revenue For Bfsi, By Region, 20172025 ($Million)
Table 18. Managed Application Services Market Revenue For Retail, By Region, 20172025 ($Million)
Table 19. Managed Application Services Market Revenue For Energy And Utilities, By Region, 20172025 ($Million)
Table 20. Managed Application Services Market Revenue For Education, By Region, 20172025 ($Million)
Table 21. Managed Application Services Market Revenue, By Region, 20172025 ($Million)
Table 22. North America Managed Application Services Market, By Services, 20172025 ($Million)
Table 23. North America Managed Application Services Market, By Organization Size, 20172025 ($Million)
Table 24. North America Managed Application Services Market, By Application Type, 20172025 ($Million)
Table 25. North America Managed Application Services Market, By Industry Vertical, 20172025 ($Million)
Table 26. North America Managed Application Services Market, By Country, 20172025 ($Million)
Table 27. U.S. Managed Application Services Market, By Services, 20172025 ($Million)
Table 28. U.S. Managed Application Services Market, By Organization Size, 20172025 ($Million)
Table 29. U.S. Managed Application Services Market, By Application Type, 20172025 ($Million)
Table 30. U.S. Managed Application Services Market, By Industry Vertical, 20172025 ($Million)
Table 31. Canada Managed Application Services Market, By Services, 20172025 ($Million)
Table 32. Canada Managed Application Services Market, By Organization Size, 20172025 ($Million)
Table 33. Canada Managed Application Services Market, By Application Type, 20172025 ($Million)
Table 34. Canada Managed Application Services Market, By Industry Vertical, 20172025 ($Million)
Table 35. Mexico Managed Application Services Market, By Services, 20172025 ($Million)
Table 36. Mexico Managed Application Services Market, By Organization Size, 20172025 ($Million)
Table 37. Mexico Managed Application Services Market, By Application Type, 20172025 ($Million)
Table 38. Mexico Managed Application Services Market, By Industry Vertical, 20172025 ($Million)
Table 39. Europe Managed Application Services Market, By Services, 20172025 ($Million)
Table 40. Europe Managed Application Services Market, By Organization Size, 20172025 ($Million)
Table 41. Europe Managed Application Services Market, By Application Type, 20172025 ($Million)
Table 42. Europe Managed Application Services Market, By Industry Vertical, 20172025 ($Million)
Table 43. Europe Managed Application Services Market, By Country, 20172025 ($Million)
Table 44. Uk Managed Application Services Market, By Services, 20172025 ($Million)
Table 45. Uk Managed Application Services Market, By Organization Size, 20172025 ($Million)
Table 46. Uk Managed Application Services Market, By Application Type, 20172025 ($Million)
Table 47. Uk Managed Application Services Market, By Industry Vertical, 20172025 ($Million)
Table 48. Germany Managed Application Services Market, By Services, 20172025 ($Million)
Table 49. Germany Managed Application Services Market, By Organization Size, 20172025 ($Million)
Table 50. Germany Managed Application Services Market, By Application Type, 20172025 ($Million)
Table 51. Germany Managed Application Services Market, By Industry Vertical, 20172025 ($Million)
Table 52. France Managed Application Services Market, By Services, 20172025 ($Million)
Table 53. France Managed Application Services Market, By Organization Size, 20172025 ($Million)
Table 54. France Managed Application Services Market, By Application Type, 20172025 ($Million)
Table 55. France Managed Application Services Market, By Industry Vertical, 20172025 ($Million)
Table 56. Rest Of Europe Managed Application Services Market, By Services, 20172025 ($Million)
Table 57. Rest Of Europe Managed Application Services Market, By Organization Size, 20172025 ($Million)
Table 58. Rest Of Europe Managed Application Services Market, By Application Type, 20172025 ($Million)
Table 59. Rest Of Europe Managed Application Services Market, By Industry Vertical, 20172025 ($Million)
Table 60. Asia-pacific Managed Application Services Market, By Services, 20172025 ($Million)
Table 61. Asia-pacific Managed Application Services Market, By Organization Size, 20172025 ($Million)
Table 62. Asia-pacific Managed Application Services Market, By Application Type, 20172025 ($Million)
Table 63. Asia-pacific Managed Application Services Market, By Industry Vertical, 20172025 ($Million)
Table 64. Asia-pacific Managed Application Services Market, By Country, 20172025 ($Million)
Table 65. China Managed Application Services Market, By Services, 20172025 ($Million)
Table 66. China Managed Application Services Market, By Organization Size, 20172025 ($Million)
Table 67. China Managed Application Services Market, By Application Type, 20172025 ($Million)
Table 68. China Managed Application Services Market, By Industry Vertical, 20172025 ($Million)
Table 69. India Managed Application Services Market, By Services, 20172025 ($Million)
Table 70. India Managed Application Services Market, By Organization Size, 20172025 ($Million)
Table 71. India Managed Application Services Market, By Application Type, 20172025 ($Million)
Table 72. India Managed Application Services Market, By Industry Vertical, 20172025 ($Million)
Table 73. Japan Managed Application Services Market, By Services, 20172025 ($Million)
Table 74. Japan Managed Application Services Market, By Organization Size, 20172025 ($Million)
Table 75. Japan Managed Application Services Market, By Application Type, 20172025 ($Million)
Table 76. Japan Managed Application Services Market, By Industry Vertical, 20172025 ($Million)
Table 77. Australia Managed Application Services Market, By Services, 20172025 ($Million)
Table 78. Australia Managed Application Services Market, By Organization Size, 20172025 ($Million)
Table 79. Australia Managed Application Services Market, By Application Type, 20172025 ($Million)
Table 80. Australia Managed Application Services Market, By Industry Vertical, 20172025 ($Million)
Table 81. Rest Of Apac Managed Application Services Market, By Services, 20172025 ($Million)
Table 82. Rest Of Apac Managed Application Services Market, By Organization Size, 20172025 ($Million)
Table 83. Rest Of Apac Managed Application Services Market, By Application Type, 20172025 ($Million)
Table 84. Rest Of Apac Managed Application Services Market, By Industry Vertical, 20172025 ($Million)
Table 85. Lamea Managed Application Services Market, By Services, 20172025 ($Million)
Table 86. Lamea Managed Application Services Market, By Organization Size, 20172025 ($Million)
Table 87. Lamea Managed Application Services Market, By Application Type, 20172025 ($Million)
Table 88. Lamea Managed Application Services Market, By Industry Vertical, 20172025 ($Million)
Table 89. Lamea Managed Application Services Market, By Country, 20172025 ($Million)
Table 90. Latin America Managed Application Services Market, By Services, 20172025 ($Million)
Table 91. Latin America Managed Application Services Market, By Organization Size, 20172025 ($Million)
Table 92. Latin America Managed Application Services Market, By Application Type, 20172025 ($Million)
Table 93. Latin America Managed Application Services Market, By Industry Vertical, 20172025 ($Million)
Table 94. Middle East Managed Application Services Market, By Services, 20172025 ($Million)
Table 95. Middle East Managed Application Services Market, By Organization Size, 20172025 ($Million)
Table 96. Middle East Managed Application Services Market, By Application Type, 20172025 ($Million)
Table 97. Middle East Managed Application Services Market, By Industry Vertical, 20172025 ($Million)
Table 98. Africa Managed Application Services Market, By Services, 20172025 ($Million)
Table 99. Africa Managed Application Services Market, By Organization Size, 20172025 ($Million)
Table 100. Africa Managed Application Services Market, By Application Type, 20172025 ($Million)
Table 101. Africa Managed Application Services Market, By Industry Vertical, 20172025 ($Million)
Table 102. Bmc Software, Inc.: Company Snapshot
Table 103. Bmc Software, Inc.: Product Categories
Table 104. Bmc Software, Inc: Product Portfolio
Table 105. Charter Communications, Inc.: Company Snapshot
Table 106. Charter Communications, Inc: Operating Segments
Table 107. Charter Communications, Inc: Product Portfolio
Table 108. Dxc Technology Company: Company Snapshot
Table 109. Dxc Technology Company: Operating Segments
Table 110. Dxc Technology Company: Product Portfolio
Table 111. Fujitsu: Company Snapshot
Table 112. Fujitsu: Operating Segments
Table 113. Fujitsu: Product Portfolio
Table 114. Hcl Technologies Limited: Company Snapshot
Table 115. Hcl Technologies Limited: Operating Segments
Table 116. Hcl Technologies Limited: Product Portfolio
Table 117. Ibm: Company Snapshot
Table 118. Ibm: Operating Segments
Table 119. Ibm: Product Portfolio
Table 120. Rackspace Inc: Company Snapshot
Table 121. Rackspace Inc: Operating Segments
Table 122. Rackspace Inc: Product Portfolio
Table 123. Virtustream Inc: Company Snapshot
Table 124. Virtustream Inc: Product Categories
Table 125. Dell Technologies Inc: Product Portfolio
Table 126. Wipro Limited: Company Snapshot
Table 127. Wipro Limited: Operating Segments
Table 128. Wipro Limited: Product Portfolio
Table 129. Yash Technologies: Company Snapshot
Table 130. Yash Technologies: Product Categories
Table 131. Yash Technologies: Product Portfolio Figure 01. Global Managed Application Services Market, 20172025
Figure 02. Managed Application Services Market, By Region, 20172025
Figure 03. Global Managed Application Services Market: Key Players
Figure 04. Global Managed Application Services Market Segmentation
Figure 05. Managed Application Services Market: Top Impacting Factor
Figure 06. Managed Application Services Market: Top Investment Pockets
Figure 07. Moderate-to-high Bargaining Power Of Supplier
Figure 08. Moderate Bargaining Power Of Buyer
Figure 09. High Threat Of Substitutes
Figure 10. Moderate-to-high Threat Of New Entrants
Figure 11. Moderate-to-high Competitive Rivalry
Figure 12. Managed Application Services Market: Key Player Positioning, 2017
Figure 13. Drivers, Restraints, And Opportunities
Figure 14. Comparative Share Analysis Of Managed Application Services Market For Operational Services, By Country, 2017 & 2025(%)
Figure 15. Comparative Share Analysis Of Managed Application Services Market For Application Service Desk, By Country, 2017 & 2025(%)
Figure 16. Comparative Share Analysis Of Managed Application Services Market For Application Hosting, By Country, 2017 & 2025(%)
Figure 17. Comparative Share Analysis Of Managed Application Services Market For Application Security And Disaster Recovery, By Country, 2017 & 2025(%)
Figure 18. Comparative Share Analysis Of Managed Application Services Market For Application Infrastructure, By Country, 2017 & 2025(%)
Figure 19. Comparative Share Analysis Of Managed Application Services Market For Smes, By Country, 2017 & 2025(%)
Figure 20. Comparative Share Analysis Of Managed Application Services Market For Large Enterprises, By Country, 2017 & 2025(%)
Figure 21. Comparative Share Analysis Of Managed Application Services Market For Web-based Applications, By Country, 2017 & 2025(%)
Figure 22. Comparative Share Analysis Of Managed Application Services Market For Mobile Applications, By Country, 2017 & 2025(%)
Figure 23. Comparative Share Analysis Of Managed Application Services Market For Telecom & It, By Country, 2017 & 2025(%)
Figure 24. Comparative Share Analysis Of Managed Application Services Market For Government, By Country, 2017 & 2025(%)
Figure 25. Comparative Share Analysis Of Managed Application Services Market For Healthcare, By Country, 2017 & 2025(%)
Figure 26. Comparative Share Analysis Of Managed Application Services Market For Government, By Country, 2017 & 2025(%)
Figure 27. Comparative Share Analysis Of Managed Application Services Market For Retail, By Country, 2017 & 2025(%)
Figure 28. Comparative Share Analysis Of Managed Application Services Market For Energy And Utilities, By Country, 2017 & 2025(%)
Figure 29. Comparative Share Analysis Of Managed Application Services Market For Education, By Country, 2017 & 2025(%)
Figure 30. U.S. Managed Application Services Market, 20172025 ($ Million)
Figure 31. Canada Managed Application Services Market, 20172025 ($ Million)
Figure 32. Mexico Managed Application Services Market, 20172025 ($ Million)
Figure 33. Uk Managed Application Services Market, 20172025 ($ Million)
Figure 34. Germany Managed Application Services Market, 20172025 ($ Million)
Figure 35. France Managed Application Services Market, 20172025 ($ Million)
Figure 36. Rest Of Europe Managed Application Services Market, 20172025 ($ Million)
Figure 37. China Managed Application Services Market, 20172025 ($ Million)
Figure 38. India Managed Application Services Market, 20172025 ($ Million)
Figure 39. Japan Managed Application Services Market, 20172025 ($ Million)
Figure 40. Australia Managed Application Services Market, 20172025 ($ Million)
Figure 41. Rest Of Apac Managed Application Services Market, 20172025 ($ Million)
Figure 42. Latin America Managed Application Services Market, 20172025 ($ Million)
Figure 43. Middle East Managed Application Services Market, 20172025 ($ Million)
Figure 44. Africa Managed Application Services Market, 20172025 ($ Million)
Figure 45. Charter Communications, Inc: Revenue, 20152017 ($Million)
Figure 46. Charter Communications, Inc: Revenue Share By Service, 2017 (%)
Figure 47. Dxc Technology Company: Revenue, 20162018 ($Million)
Figure 48. Dxc Technology Company: Revenue Share By Segment, 2018 (%)
Figure 49. Dxc Technology Company: Revenue Share By Geography, 2018 (%)
Figure 50. Fujitsu: Net Sales, 20152017 ($Million)
Figure 51. Fujitsu: Revenue Share By Segment, 2017 (%)
Figure 52. Fujitsu: Revenue Share By Geography, 2017 (%)
Figure 53. Hcl Technologies Limited: Revenue, 20162018 ($Million)
Figure 54. Hcl Technologies Limited: Revenue Share By Segment, 2018 (%)
Figure 55. Hcl Technologies Limited: Revenue Share By Geography, 2018 (%)
Figure 56. Ibm: Net Sales, 20152017 ($Million)
Figure 57. Ibm: Revenue Share By Segment, 2017 (%)
Figure 58. Ibm: Revenue Share By Geography, 2017 (%)
Figure 59. Dell Technologies Inc: Revenue, 20152017 ($Million)
Figure 60. Dell Technologies Inc: Revenue Share By Segment, 2017 (%)
Figure 61. Dell Technologies Inc: Revenue Share By Geography, 2017 (%)
Figure 62. Wipro Limited: Revenue, 20162018 ($Million)
Figure 63. Wipro Limited: Revenue Share By Segment, 2018 (%)
Figure 64. Wipro Limited: Revenue Share By Geography, 2018 (%)
$5769
$10995
HAVE A QUERY?
OUR CUSTOMER
