0
U.S. (TOLL FREE)
+1 (315) 215-3225
Automative

0
U.S. (TOLL FREE)
+1 (315) 215-3225
Syphilis Testing Market By Type (Primary & Secondary Syphilis, Others), By Location of Testing (Laboratory testing, Point of care (POC) testing): Global Opportunity Analysis and Industry Forecast, 2020-2030
Published Date: April 2022
|
Report Code: ALLI-Auto-3I18
Home | Market Reports | Health| Reproductive Health
Syphilis Testing Market by Types Primary Syphilis Secondary Syphilis Global Opportunity Analysis and Industry Forecast 2014 2020
BUY CHAPTERS

Syphilis Testing Market By Type (Primary & Secondary Syphilis, Others), By Location of Testing (Laboratory testing, Point of care (POC) testing): Global Opportunity Analysis and Industry Forecast, 2020-2030

Code: ALLI-Auto-3I18
Report
April 2022
Pages:200
Allied Market Research
Buy Now with 15% Discount
DESCRIPTION
TABLE OF CONTENT
TABLES & FIGURES

Syphilis Testing Market Size

According to a new report published by , titled, “Syphilis Testing Market," The syphilis testing market was valued at $1.1 billion in 2020, and is estimated to reach $1.9 billion by 2030, growing at a CAGR of 5.6% from 2021 to 2030. 

Syphilis Testing Market

Syphilis Testing Market

Syphilis is a sexually transmitted disease caused by Treponema pallidum bacteria. Syphilis tests are used for screening and detection of antibodies against bacteria into the patients’ blood. There are various complications related to syphilis infection, such as infertility in both, men and women, ectopic pregnancy, cervical cancer in women and congenital mortality, and infections. Treponemal tests applied for the screening of bacterial infection includes the Treponema pallidum particle agglutination (TP-PA) and fluorescent treponemal antibody (FTA-ABS). Non-treponemal tests are relatively simple to perform and interpret, give rapid results, and are economic. However, non-treponemal tests require laboratory equipment and trained personnel to perform and interpret test reactions. Non-treponemal tests include, Rapid Plasma Reagin (RPR), which is an improved version of the Venereal Disease Research Laboratory (VDRL) test and tests for the same antigen.
The key factors that drive the growth of syphilis testing market size are rise in the prevalence of sexually transmitted disease and technological advancements. Moreover, improved healthcare infrastructure, rapid development in diagnostic kits, and availability of test kits are other factors that are expected to create opportunities for market growth during the forecast period. Furthermore, growth in incidences of diseases such as sexually transmitted disease, including syphilis has positively propelled the growth of the global syphilis testing market share. There are increasing incidences of the condition being transmitted by and among MSM (Men who have sex with men) population, injecting drug users, and sex workers. Syphilis constitutes a high proportion of health and economic burden for the developing countries. Especially, visits to the specialized STD clinics are noticed and to avoid uncomfortable situations or embarrassment in the society, many refrain from voluntary / CICT Syphilis testing at any of the labs or STD clinics. This hinders the uptake of diagnostic tests or testing volume, thus restraining the growth of the syphilis testing market.
The syphilis testing market analysis is segmented on the basis of type , location of testing  and geography. On the basis of type, the syphilis testing market growth is segmented into primary and secondary syphilis testing. On the basis of location of testing , the market is segmented into laboratory testing & point of care. Geographically, the market is segmented into North America, Europe, Asia-Pacific, and LAMEA.
By type, the syphilis testing market forecast is segment into primary and secondary syphilis testing market. The secondary syphilis segment holds the largest market share whereas the primary syphilis segment is estimated to witness the highest CAGR during the forecast period.
By location of testing, the syphilis testing industry is segmented into laboratory testing & point of care . The laboratory test segment is a highest market contributor in 2020. As laboratory testing is cost efficient, convenient and confidential the laboratory testing segment dominated the market in 2020 and is expected to continue this trend during the forecast period.
By region, the syphilis testing industry is analyzed across North America, Asia-Pacific, Europe, and LAMEA. LAMEA dominated the market in 2020, accounting for the highest share, and is anticipated to maintain this trend during the forecast period. The prevalence and incidence rates of syphilis, typically have higher laboratory testing costs in LAMEA than in Asia-Pacific.
KEY FINDINGS OF STUDY
By type, the secondary syphilis testing segment was the highest contributor to the market in 2020.
By location of testing, the laboratory test segment was the highest contributor to the market in 2020.
Region-wise, North America is the  largest revenue share in 2020. However, Europe  is anticipated to grow at the highest CAGR during the forecast period.

Overview

The syphilis testing market was valued at $ 1,125.1 million in 2020, and is projected to reach $ 1,935.8 million by 2030, registering a CAGR of 5.6 % from 2021 to 2030. 
Syphilis is an infectious condition, usually spread by sexual contact. The disease starts as a painless sore on the genitals, rectum, or mouth. The mode of transmission of the disease is person to person via skin or mucous membrane contact. There are two types of tests that are performed for the detection and screening of diseases, such as the treponemal test and non-treponemal tests. The non treponemal test includes, the Treponema pallidum particle agglutination (TP-PA) and fluorescent treponemal antibody (FTA-ABS). The non treponemal test includes, Venereal Disease Research Laboratory (VDRL), which is a laboratory-based test performed for the disease screening. The tests are performed to protect the health of a sexual partner and helps the spread of the disease. It also helps to protect fertility and provides protection to the unborn baby from the infection.
Increase in prevalence of sexually transmitted disease, growth in incidences of sexual contact, and technological advancements in syphilis testing drive the growth of the syphilis testing market. In addition, the rise in geriatric population globally boosts the market growth. Lack of healthcare insurance and less awareness among individuals regarding the benefits of tests declines the growth of market. Higher adoption rates for technologically advanced screening tests, active measures from the governments and private associations, and growing awareness for the syphilis infections largely contribute to the growth of the market.
The syphilis test market is segmented on the basis of type , location of testing  and geography. On the basis of type, the market is segmented into primary and secondary syphilis testing. On the basis of location of testing, the market is segmented into laboratory testing & point of care .Geographically, the market is segmented into North America, Europe, Asia-Pacific, and LAMEA.
The major players in the syphilis testing market are focusing on technological advancements in developing syphilis testing products along with complementary service portfolios. Some of the key companies profiled in the report are Roche Diagnostics, Hologic, Inc., Becton Dickinson & Company, Abbott Laboratories, BioMerieux, Astam Diagnostic, Cepheid Inc., Affymetrix, Inc., and Diasorin

Key Benefits For Stakeholders

This report provides a quantitative analysis of the market segments, current trends, estimations, and dynamics of the cosmetic surgery market analysis from 2021 to 2031 to identify the prevailingcosmetic surgery market opportunity.
The market research is offered along with information related to key drivers, restraints, and opportunities.
Porter's five forces analysis highlights the potency of buyers and suppliers to enable stakeholders make profit-oriented business decisions and strengthen their supplier-buyer network.
In-depth analysis of the cosmetic surgery market segmentation assists to determine the prevailing market opportunities.
Major countries in each region are mapped according to their revenue contribution to the global market.
Market player positioning facilitates benchmarking and provides a clear understanding of the present position of the market players.
The report includes the analysis of the regional as well as global cosmetic surgery market trends, key players, market segments, application areas, and market growth strategies.
Key Market Segments
Affymetrix, In

Scope of Syphilis Testing Market Report

Report Metric Details
Report Name Syphilis Testing Market
Accounted market size in 2020 $ 1.1 in billion
Forecasted market size in 2030 $ 1.9 billion
CAGR 5.6%
Base Year 2020
Forecasted years 2024 - 2030
By Type
  • Primary Secondary Syphilis
  • Others
By Location of Testing
  • Laboratory testing
  • Point of care (POC) testing
By Region
  • North America (United States, Canada)
  • Europe (Germany, France, UK, Italy, Russia) Rest of Europe
  • Nordic Countries
  • Asia-Pacific (China, Japan, South Korea)
  • Southeast Asia (India, Australia)
  • Rest of Asia
  • Latin America (Mexico, Brazil)
  • Rest of Latin America
  • Middle East & Africa (Turkey, Saudi Arabia, UAE, Rest of MEA)
Forecast units USD million in value
Report coverage Revenue and volume forecast, company share, competitive landscape, growth factors and trends

FAQ for this report

How fast is Syphilis Testing Market growing?

Ans: The Syphilis Testing Market witnessing a CAGR of 5.6% during the forecast period 2024-2030.

What is the Syphilis Testing Market size in 2030?

Ans: The Syphilis Testing Market size in 2030 will be $ 1.9 billion.

What are the Type segmentation covered in the Syphilis Testing Market report?

Ans: The Types covered in the Syphilis Testing Market report are Primary Secondary Syphilis, Others

CHAPTER 1:INTRODUCTION
1.1.Report description
1.2.Key market segments
1.3.Key benefits to the stakeholders
1.4.Research Methodology
1.4.1.Secondary research
1.4.2.Primary research
1.4.3.Analyst tools and models
CHAPTER 2:EXECUTIVE SUMMARY
2.1.Key findings of the study
2.2.CXO Perspective
CHAPTER 3:MARKET OVERVIEW
3.1.Market definition and scope
3.2.Key findings
3.2.1.Top investment pockets
3.3.Porter’s five forces analysis
3.4.Top player positioning
3.5.Market dynamics
3.5.1.Drivers
3.5.2.Restraints
3.5.3.Opportunities
3.6.COVID-19 Impact Analysis on the market
CHAPTER 4: SYPHILIS TESTING MARKET, BY BY TYPE
4.1 Overview
4.1.1 Market size and forecast
4.2 Primary & Secondary Syphilis
4.2.1 Key market trends, growth factors and opportunities
4.2.2 Market size and forecast, by region
4.2.3 Market analysis by country
4.3 Others
4.3.1 Key market trends, growth factors and opportunities
4.3.2 Market size and forecast, by region
4.3.3 Market analysis by country
CHAPTER 5: SYPHILIS TESTING MARKET, BY LOCATION OF TESTING
5.1 Overview
5.1.1 Market size and forecast
5.2 Laboratory testing
5.2.1 Key market trends, growth factors and opportunities
5.2.2 Market size and forecast, by region
5.2.3 Market analysis by country
5.3 Point of care (POC) testing
5.3.1 Key market trends, growth factors and opportunities
5.3.2 Market size and forecast, by region
5.3.3 Market analysis by country
CHAPTER 6: SYPHILIS TESTING MARKET, BY REGION
6.1 Overview
6.1.1 Market size and forecast
6.2 North America
6.2.1 Key trends and opportunities
6.2.2 North America Market size and forecast, by By Type
6.2.3 North America Market size and forecast, by Location of Testing
6.2.4 North America Market size and forecast, by country
6.2.4.1 U.S.
6.2.4.1.1 Market size and forecast, by By Type
6.2.4.1.2 Market size and forecast, by Location of Testing
6.2.4.2 Canada
6.2.4.2.1 Market size and forecast, by By Type
6.2.4.2.2 Market size and forecast, by Location of Testing
6.2.4.3 Mexico
6.2.4.3.1 Market size and forecast, by By Type
6.2.4.3.2 Market size and forecast, by Location of Testing
6.3 Europe
6.3.1 Key trends and opportunities
6.3.2 Europe Market size and forecast, by By Type
6.3.3 Europe Market size and forecast, by Location of Testing
6.3.4 Europe Market size and forecast, by country
6.3.4.1 Germany
6.3.4.1.1 Market size and forecast, by By Type
6.3.4.1.2 Market size and forecast, by Location of Testing
6.3.4.2 France
6.3.4.2.1 Market size and forecast, by By Type
6.3.4.2.2 Market size and forecast, by Location of Testing
6.3.4.3 U.K.
6.3.4.3.1 Market size and forecast, by By Type
6.3.4.3.2 Market size and forecast, by Location of Testing
6.3.4.4 Italy
6.3.4.4.1 Market size and forecast, by By Type
6.3.4.4.2 Market size and forecast, by Location of Testing
6.3.4.5 Rest of Europe
6.3.4.5.1 Market size and forecast, by By Type
6.3.4.5.2 Market size and forecast, by Location of Testing
6.4 Asia-Pacific
6.4.1 Key trends and opportunities
6.4.2 Asia-Pacific Market size and forecast, by By Type
6.4.3 Asia-Pacific Market size and forecast, by Location of Testing
6.4.4 Asia-Pacific Market size and forecast, by country
6.4.4.1 Japan
6.4.4.1.1 Market size and forecast, by By Type
6.4.4.1.2 Market size and forecast, by Location of Testing
6.4.4.2 China
6.4.4.2.1 Market size and forecast, by By Type
6.4.4.2.2 Market size and forecast, by Location of Testing
6.4.4.3 India
6.4.4.3.1 Market size and forecast, by By Type
6.4.4.3.2 Market size and forecast, by Location of Testing
6.4.4.4 Rest of Asia-Pacific
6.4.4.4.1 Market size and forecast, by By Type
6.4.4.4.2 Market size and forecast, by Location of Testing
6.5 LAMEA
6.5.1 Key trends and opportunities
6.5.2 LAMEA Market size and forecast, by By Type
6.5.3 LAMEA Market size and forecast, by Location of Testing
6.5.4 LAMEA Market size and forecast, by country
6.5.4.1 Brazil
6.5.4.1.1 Market size and forecast, by By Type
6.5.4.1.2 Market size and forecast, by Location of Testing
6.5.4.2 Saudi Arabia
6.5.4.2.1 Market size and forecast, by By Type
6.5.4.2.2 Market size and forecast, by Location of Testing
CHAPTER 7: COMPANY LANDSCAPE
7.1. Introduction
7.2. Top winning strategies
7.3. Product Mapping of Top 10 Player
7.4. Competitive Dashboard
7.5. Competitive Heatmap
7.6. Key developments
CHAPTER 8: COMPANY PROFILES
8.1 Hologic, Inc.
8.1.1 Company overview
8.1.2 Company snapshot
8.1.3 Operating business segments
8.1.4 Product portfolio
8.1.5 Business performance
8.1.6 Key strategic moves and developments
8.2 Becton Dickinson And Company
8.2.1 Company overview
8.2.2 Company snapshot
8.2.3 Operating business segments
8.2.4 Product portfolio
8.2.5 Business performance
8.2.6 Key strategic moves and developments
8.3 Cepheid Inc.
8.3.1 Company overview
8.3.2 Company snapshot
8.3.3 Operating business segments
8.3.4 Product portfolio
8.3.5 Business performance
8.3.6 Key strategic moves and developments
8.4 Abbott Laboratories
8.4.1 Company overview
8.4.2 Company snapshot
8.4.3 Operating business segments
8.4.4 Product portfolio
8.4.5 Business performance
8.4.6 Key strategic moves and developments
8.5 DiaSorin
8.5.1 Company overview
8.5.2 Company snapshot
8.5.3 Operating business segments
8.5.4 Product portfolio
8.5.5 Business performance
8.5.6 Key strategic moves and developments
8.6 beckman coulter
8.6.1 Company overview
8.6.2 Company snapshot
8.6.3 Operating business segments
8.6.4 Product portfolio
8.6.5 Business performance
8.6.6 Key strategic moves and developments
8.7 Bio-Rad Laboratories
8.7.1 Company overview
8.7.2 Company snapshot
8.7.3 Operating business segments
8.7.4 Product portfolio
8.7.5 Business performance
8.7.6 Key strategic moves and developments
8.8 F. Hoffmann-La Roche
8.8.1 Company overview
8.8.2 Company snapshot
8.8.3 Operating business segments
8.8.4 Product portfolio
8.8.5 Business performance
8.8.6 Key strategic moves and developments
8.9 siemens healthcare
8.9.1 Company overview
8.9.2 Company snapshot
8.9.3 Operating business segments
8.9.4 Product portfolio
8.9.5 Business performance
8.9.6 Key strategic moves and developments
8.10 Affymetrix, Inc
8.10.1 Company overview
8.10.2 Company snapshot
8.10.3 Operating business segments
8.10.4 Product portfolio
8.10.5 Business performance
8.10.6 Key strategic moves and development
LIST OF TABLES
TABLE 1. GLOBAL SYPHILIS TESTING MARKET, BY BY TYPE, 2020-2030,($MILLION)
TABLE 2. SYPHILIS TESTING MARKET REVENUE, FOR PRIMARY & SECONDARY SYPHILIS, BY REGION , 2020-2030,($MILLION)
TABLE 3. SYPHILIS TESTING MARKET PRIMARY & SECONDARY SYPHILIS BY COUNTRY, 2020-2030,($MILLION)
TABLE 4. SYPHILIS TESTING MARKET REVENUE, FOR OTHERS, BY REGION , 2020-2030,($MILLION)
TABLE 5. SYPHILIS TESTING MARKET OTHERS BY COUNTRY, 2020-2030,($MILLION)
TABLE 6. GLOBAL SYPHILIS TESTING MARKET, BY LOCATION OF TESTING, 2020-2030,($MILLION)
TABLE 7. SYPHILIS TESTING MARKET REVENUE, FOR LABORATORY TESTING, BY REGION , 2020-2030,($MILLION)
TABLE 8. SYPHILIS TESTING MARKET LABORATORY TESTING BY COUNTRY, 2020-2030,($MILLION)
TABLE 9. SYPHILIS TESTING MARKET REVENUE, FOR POINT OF CARE (POC) TESTING, BY REGION , 2020-2030,($MILLION)
TABLE 10. SYPHILIS TESTING MARKET POINT OF CARE (POC) TESTING BY COUNTRY, 2020-2030,($MILLION)
TABLE 11. SYPHILIS TESTING MARKET, BY REGION, 2020-2030,($MILLION)
TABLE 12. NORTH AMERICA SYPHILIS TESTING MARKET, BY BY TYPE, 2020-2030,($MILLION)
TABLE 13. NORTH AMERICA SYPHILIS TESTING MARKET, BY LOCATION OF TESTING, 2020-2030,($MILLION)
TABLE 14. NORTH AMERICA SYPHILIS TESTING MARKET, BY COUNTRY, 2020-2030,($MILLION)
TABLE 15. U.S. SYPHILIS TESTING MARKET BY BY TYPE 2020-2030,($MILLION)
TABLE 16. U.S. SYPHILIS TESTING MARKET BY LOCATION OF TESTING 2020-2030,($MILLION)
TABLE 17. CANADA SYPHILIS TESTING MARKET BY BY TYPE 2020-2030,($MILLION)
TABLE 18. CANADA SYPHILIS TESTING MARKET BY LOCATION OF TESTING 2020-2030,($MILLION)
TABLE 19. MEXICO SYPHILIS TESTING MARKET BY BY TYPE 2020-2030,($MILLION)
TABLE 20. MEXICO SYPHILIS TESTING MARKET BY LOCATION OF TESTING 2020-2030,($MILLION)
TABLE 21. EUROPE SYPHILIS TESTING MARKET, BY BY TYPE, 2020-2030,($MILLION)
TABLE 22. EUROPE SYPHILIS TESTING MARKET, BY LOCATION OF TESTING, 2020-2030,($MILLION)
TABLE 23. EUROPE SYPHILIS TESTING MARKET, BY COUNTRY, 2020-2030,($MILLION)
TABLE 24. GERMANY SYPHILIS TESTING MARKET BY BY TYPE 2020-2030,($MILLION)
TABLE 25. GERMANY SYPHILIS TESTING MARKET BY LOCATION OF TESTING 2020-2030,($MILLION)
TABLE 26. FRANCE SYPHILIS TESTING MARKET BY BY TYPE 2020-2030,($MILLION)
TABLE 27. FRANCE SYPHILIS TESTING MARKET BY LOCATION OF TESTING 2020-2030,($MILLION)
TABLE 28. U.K. SYPHILIS TESTING MARKET BY BY TYPE 2020-2030,($MILLION)
TABLE 29. U.K. SYPHILIS TESTING MARKET BY LOCATION OF TESTING 2020-2030,($MILLION)
TABLE 30. ITALY SYPHILIS TESTING MARKET BY BY TYPE 2020-2030,($MILLION)
TABLE 31. ITALY SYPHILIS TESTING MARKET BY LOCATION OF TESTING 2020-2030,($MILLION)
TABLE 32. REST OF EUROPE SYPHILIS TESTING MARKET BY BY TYPE 2020-2030,($MILLION)
TABLE 33. REST OF EUROPE SYPHILIS TESTING MARKET BY LOCATION OF TESTING 2020-2030,($MILLION)
TABLE 34. ASIA-PACIFIC SYPHILIS TESTING MARKET, BY BY TYPE, 2020-2030,($MILLION)
TABLE 35. ASIA-PACIFIC SYPHILIS TESTING MARKET, BY LOCATION OF TESTING, 2020-2030,($MILLION)
TABLE 36. ASIA-PACIFIC SYPHILIS TESTING MARKET, BY COUNTRY, 2020-2030,($MILLION)
TABLE 37. JAPAN SYPHILIS TESTING MARKET BY BY TYPE 2020-2030,($MILLION)
TABLE 38. JAPAN SYPHILIS TESTING MARKET BY LOCATION OF TESTING 2020-2030,($MILLION)
TABLE 39. CHINA SYPHILIS TESTING MARKET BY BY TYPE 2020-2030,($MILLION)
TABLE 40. CHINA SYPHILIS TESTING MARKET BY LOCATION OF TESTING 2020-2030,($MILLION)
TABLE 41. INDIA SYPHILIS TESTING MARKET BY BY TYPE 2020-2030,($MILLION)
TABLE 42. INDIA SYPHILIS TESTING MARKET BY LOCATION OF TESTING 2020-2030,($MILLION)
TABLE 43. REST OF ASIA-PACIFIC SYPHILIS TESTING MARKET BY BY TYPE 2020-2030,($MILLION)
TABLE 44. REST OF ASIA-PACIFIC SYPHILIS TESTING MARKET BY LOCATION OF TESTING 2020-2030,($MILLION)
TABLE 45. LAMEA SYPHILIS TESTING MARKET, BY BY TYPE, 2020-2030,($MILLION)
TABLE 46. LAMEA SYPHILIS TESTING MARKET, BY LOCATION OF TESTING, 2020-2030,($MILLION)
TABLE 47. LAMEA SYPHILIS TESTING MARKET, BY COUNTRY, 2020-2030,($MILLION)
TABLE 48. BRAZIL SYPHILIS TESTING MARKET BY BY TYPE 2020-2030,($MILLION)
TABLE 49. BRAZIL SYPHILIS TESTING MARKET BY LOCATION OF TESTING 2020-2030,($MILLION)
TABLE 50. SAUDI ARABIA SYPHILIS TESTING MARKET BY BY TYPE 2020-2030,($MILLION)
TABLE 51. SAUDI ARABIA SYPHILIS TESTING MARKET BY LOCATION OF TESTING 2020-2030,($MILLION)
TABLE 52.HOLOGIC, INC.: COMPANY SNAPSHOT
TABLE 53.HOLOGIC, INC.: OPERATING SEGMENTS
TABLE 54.HOLOGIC, INC.: PRODUCT PORTFOLIO
TABLE 55.HOLOGIC, INC.: NET SALES,
TABLE 56.HOLOGIC, INC.: KEY STRATERGIES
TABLE 57.BECTON DICKINSON AND COMPANY: COMPANY SNAPSHOT
TABLE 58.BECTON DICKINSON AND COMPANY: OPERATING SEGMENTS
TABLE 59.BECTON DICKINSON AND COMPANY: PRODUCT PORTFOLIO
TABLE 60.BECTON DICKINSON AND COMPANY: NET SALES,
TABLE 61.BECTON DICKINSON AND COMPANY: KEY STRATERGIES
TABLE 62.CEPHEID INC.: COMPANY SNAPSHOT
TABLE 63.CEPHEID INC.: OPERATING SEGMENTS
TABLE 64.CEPHEID INC.: PRODUCT PORTFOLIO
TABLE 65.CEPHEID INC.: NET SALES,
TABLE 66.CEPHEID INC.: KEY STRATERGIES
TABLE 67.ABBOTT LABORATORIES: COMPANY SNAPSHOT
TABLE 68.ABBOTT LABORATORIES: OPERATING SEGMENTS
TABLE 69.ABBOTT LABORATORIES: PRODUCT PORTFOLIO
TABLE 70.ABBOTT LABORATORIES: NET SALES,
TABLE 71.ABBOTT LABORATORIES: KEY STRATERGIES
TABLE 72.DIASORIN: COMPANY SNAPSHOT
TABLE 73.DIASORIN: OPERATING SEGMENTS
TABLE 74.DIASORIN: PRODUCT PORTFOLIO
TABLE 75.DIASORIN: NET SALES,
TABLE 76.DIASORIN: KEY STRATERGIES
TABLE 77.BECKMAN COULTER: COMPANY SNAPSHOT
TABLE 78.BECKMAN COULTER: OPERATING SEGMENTS
TABLE 79.BECKMAN COULTER: PRODUCT PORTFOLIO
TABLE 80.BECKMAN COULTER: NET SALES,
TABLE 81.BECKMAN COULTER: KEY STRATERGIES
TABLE 82.BIO-RAD LABORATORIES: COMPANY SNAPSHOT
TABLE 83.BIO-RAD LABORATORIES: OPERATING SEGMENTS
TABLE 84.BIO-RAD LABORATORIES: PRODUCT PORTFOLIO
TABLE 85.BIO-RAD LABORATORIES: NET SALES,
TABLE 86.BIO-RAD LABORATORIES: KEY STRATERGIES
TABLE 87.F. HOFFMANN-LA ROCHE: COMPANY SNAPSHOT
TABLE 88.F. HOFFMANN-LA ROCHE: OPERATING SEGMENTS
TABLE 89.F. HOFFMANN-LA ROCHE: PRODUCT PORTFOLIO
TABLE 90.F. HOFFMANN-LA ROCHE: NET SALES,
TABLE 91.F. HOFFMANN-LA ROCHE: KEY STRATERGIES
TABLE 92.SIEMENS HEALTHCARE: COMPANY SNAPSHOT
TABLE 93.SIEMENS HEALTHCARE: OPERATING SEGMENTS
TABLE 94.SIEMENS HEALTHCARE: PRODUCT PORTFOLIO
TABLE 95.SIEMENS HEALTHCARE: NET SALES,
TABLE 96.SIEMENS HEALTHCARE: KEY STRATERGIES
TABLE 97.AFFYMETRIX, INC: COMPANY SNAPSHOT
TABLE 98.AFFYMETRIX, INC: OPERATING SEGMENTS
TABLE 99.AFFYMETRIX, INC: PRODUCT PORTFOLIO
TABLE 100.AFFYMETRIX, INC: NET SALES,
TABLE 101.AFFYMETRIX, INC: KEY STRATERGIES LIST OF FIGURES
FIGURE 1.SYPHILIS TESTING MARKET SEGMENTATION
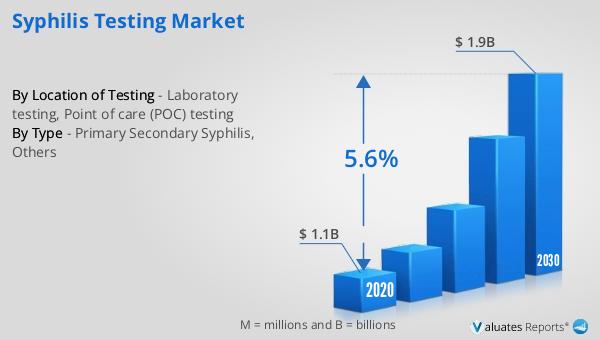
FIGURE 2.SYPHILIS TESTING MARKET,2020-2030
FIGURE 3.SYPHILIS TESTING MARKET,2020-2030
FIGURE 4. TOP INVESTMENT POCKETS, BY REGION
FIGURE 5.PORTER FIVE-1
FIGURE 6.PORTER FIVE-2
FIGURE 7.PORTER FIVE-3
FIGURE 8.PORTER FIVE-4
FIGURE 9.PORTER FIVE-5
FIGURE 10.TOP PLAYER POSITIONING
FIGURE 11.SYPHILIS TESTING MARKET:DRIVERS, RESTRAINTS AND OPPORTUNITIES
FIGURE 12.SYPHILIS TESTING MARKET,BY BY TYPE,2020(%)
FIGURE 13.COMPARATIVE SHARE ANALYSIS OF PRIMARY & SECONDARY SYPHILIS SYPHILIS TESTING MARKET,2020-2030(%)
FIGURE 14.COMPARATIVE SHARE ANALYSIS OF OTHERS SYPHILIS TESTING MARKET,2020-2030(%)
FIGURE 15.SYPHILIS TESTING MARKET,BY LOCATION OF TESTING,2020(%)
FIGURE 16.COMPARATIVE SHARE ANALYSIS OF LABORATORY TESTING SYPHILIS TESTING MARKET,2020-2030(%)
FIGURE 17.COMPARATIVE SHARE ANALYSIS OF POINT OF CARE (POC) TESTING SYPHILIS TESTING MARKET,2020-2030(%)
FIGURE 18.SYPHILIS TESTING MARKET BY REGION,2020
FIGURE 19.U.S. SYPHILIS TESTING MARKET,2020-2030($MILLION)
FIGURE 20.CANADA SYPHILIS TESTING MARKET,2020-2030($MILLION)
FIGURE 21.MEXICO SYPHILIS TESTING MARKET,2020-2030($MILLION)
FIGURE 22.GERMANY SYPHILIS TESTING MARKET,2020-2030($MILLION)
FIGURE 23.FRANCE SYPHILIS TESTING MARKET,2020-2030($MILLION)
FIGURE 24.U.K. SYPHILIS TESTING MARKET,2020-2030($MILLION)
FIGURE 25.ITALY SYPHILIS TESTING MARKET,2020-2030($MILLION)
FIGURE 26.REST OF EUROPE SYPHILIS TESTING MARKET,2020-2030($MILLION)
FIGURE 27.JAPAN SYPHILIS TESTING MARKET,2020-2030($MILLION)
FIGURE 28.CHINA SYPHILIS TESTING MARKET,2020-2030($MILLION)
FIGURE 29.INDIA SYPHILIS TESTING MARKET,2020-2030($MILLION)
FIGURE 30.REST OF ASIA-PACIFIC SYPHILIS TESTING MARKET,2020-2030($MILLION)
FIGURE 31.BRAZIL SYPHILIS TESTING MARKET,2020-2030($MILLION)
FIGURE 32.SAUDI ARABIA SYPHILIS TESTING MARKET,2020-2030($MILLION)
FIGURE 33. TOP WINNING STRATEGIES, BY YEAR
FIGURE 34. TOP WINNING STRATEGIES, BY DEVELOPMENT
FIGURE 35. TOP WINNING STRATEGIES, BY COMPANY
FIGURE 36.PRODUCT MAPPING OF TOP 10 PLAYERS
FIGURE 37.COMPETITIVE DASHBOARD
FIGURE 38.COMPETITIVE HEATMAP OF TOP 10 KEY PLAYERS
FIGURE 39.HOLOGIC, INC..: NET SALES ,($MILLION)
FIGURE 40.BECTON DICKINSON AND COMPANY.: NET SALES ,($MILLION)
FIGURE 41.CEPHEID INC..: NET SALES ,($MILLION)
FIGURE 42.ABBOTT LABORATORIES.: NET SALES ,($MILLION)
FIGURE 43.DIASORIN.: NET SALES ,($MILLION)
FIGURE 44.BECKMAN COULTER.: NET SALES ,($MILLION)
FIGURE 45.BIO-RAD LABORATORIES.: NET SALES ,($MILLION)
FIGURE 46.F. HOFFMANN-LA ROCHE.: NET SALES ,($MILLION)
FIGURE 47.SIEMENS HEALTHCARE.: NET SALES ,($MILLION)
FIGURE 48.AFFYMETRIX, INC.: NET SALES ,($MILLION
SELECT A FORMAT
Added to Cart
Electronic (PDF)

$5939

This license allows only one user to access the PDF.
Electronic (PDF)

$6654

This license allows 1 - 5 user to access the PDF, license is suitable for small groups of 5 users working together
Electronic (PDF)

$10280

This license allows users/teams in a same Enterprise to use this report, various departments within an enterpise can use this report
Electronic (PDF)

$3961

This license just provides quantitative data in a excel sheet
Add to Cart
Buy Now (15% Discount)

OUR CUSTOMER

Samsung SD

SIMILAR REPORTS