0
U.S. (TOLL FREE)
+1 (315) 215-3225
Automative

0
U.S. (TOLL FREE)
+1 (315) 215-3225
Clean Hydrogen Market By Type (Blue Hydrogen, Green Hydrogen), By Method (Electrolysis, Carbon Capture), By Application (Industrial, Transportation, Power, Others): Global Opportunity Analysis and Industry Forecast, 2022-2032
Published Date: March 2023
|
Report Code: ALLI-Auto-3J787
Home | Market Reports | Business & Industrial| Energy & Utilities
Clean Hydrogen Market By Type Blue Hydrogen Green Hydrogen By Method Electrolysis Carbon Capture By Application Industrial Transportation Power Others Global Opportunity Analysis and Industry Forecast 2022 2032
BUY CHAPTERS

Clean Hydrogen Market By Type (Blue Hydrogen, Green Hydrogen), By Method (Electrolysis, Carbon Capture), By Application (Industrial, Transportation, Power, Others): Global Opportunity Analysis and Industry Forecast, 2022-2032

Code: ALLI-Auto-3J787
Report
March 2023
Pages:350
Allied Market Research
Buy Now with 15% Discount
DESCRIPTION
TABLE OF CONTENT
TABLES & FIGURES

Clean Hydrogen Market Size

According to a new report published by , titled, “Clean Hydrogen Market," The clean hydrogen market was valued at $3.8 billion in 2022, and is estimated to reach $18.3 billion by 2032, growing at a CAGR of 14.8% from 2023 to 2032.

Clean Hydrogen Market

Clean Hydrogen Market

According to IEA, global hydrogen production is 94 Mt. This generates emissions of around 900Mt CO2, double that of the UK. The vast majority of this is grey hydrogen (made with fossil fuels and no carbon capture) and used by the refining and chemicals industries. For achieving net zero targets, by 2050, hydrogen’s contribution to the primary energy mix must be around 12%. However, to achieve such targets, fossil fuels need to be eliminated from the hydrogen production process. Moreover, reducing carbon emissions during blue hydrogen (derived from methane reformation combined with carbon capture technology) production is also an essential aspect to be worked on.
Clean hydrogen is a wide concept that includes grey, blue, and green hydrogen. Clean Hydrogen includes blue as well as green hydrogen. Blue hydrogen is produced through the steam methane reformation technology (SMR) process. whereas green hydrogen production is done through the electrolysis of water where the electricity is sourced from renewables. Increased commercial viability, growth in the application of hydrogen, rise in demand for hydrogen as alternative fuels, and net zero targets and aim to decarbonize the economy drive the growth of the global clean hydrogen market. However, the lack of policies and regulatory framework and high cost & efficiency losses hampers the market growth for clean hydrogen. Meanwhile, the flexibility of hydrogen production through on-site installation offers a lucrative opportunity for the clean hydrogen industry.
The clean hydrogen market size is studied based on type, method, application, and region. Based on type, the clean hydrogen market is bifurcated into blue hydrogen and green hydrogen. The carbon emission during the process of production of blue hydrogen is captured at the location and is stored for further utilization in any way or form. Depending on the method, the market is further classified into electrolysis and carbon capture. The electrolysis segment is further divided into alkaline electrolyzers, polymer electrolyte membrane electrolyzers (PEM), and solid oxide electrolyzers (SOE). The carbon capture technology aids to achieve deep decarbonization in the industrial sector. 
By application, the market is divided into industrial, transportation, power, and others. Hydrogen is used in several industrial processes in metallurgy, as a chemical feedstock, glass, and food & beverages sectors. By region, the clean hydrogen market analysis is done across North America, Europe, Asia-Pacific, and LAMEA (Latin America, the Middle East, and Africa). North America dominated the market share revenue followed by Europe and Asia-Pacific. Europe is heavily focused on emissions-free green hydrogen, with a target to install 40 gigawatts of renewable hydrogen electrolyzer capacity by 2030. However, Europe’s green hydrogen capacity is set to reach just 2.7 gigawatts by 2025. The EU has $4.56 billion of annual funding potential for hydrogen projects in 2021-30.  
The major players operating in the clean hydrogen industry are Saudi ARAMCO, Iberdrola, S.A., China Petroleum & Chemical Corporation (Sinopec), Linde plc, Exxon Mobil Corporation, FuelCell Energy, Inc., Air Products and Chemicals, Inc., Plug Power Inc., Orsted A/S, and Enel Green Power Spa. The other market players are NEL ASA, Air Liquide SA, Siemens Energy, Oil & Natural Gas Corporation, and Adani Green Energy. The drivers, restraints, and opportunities are explained in the report to better understand the market dynamics.
The U.S. government passed into law the Infrastructure Investment and Jobs Act of 2021; it contained a $9.5 billion budget to boost clean hydrogen development. This was followed by the launch of the government’s Hydrogen Earthshot program, with its so-called “111 goals” to cut the cost of clean hydrogen to $1 per 1 kilogram in 1 decade. 
In 2017, Japan became the first country to formulate a national hydrogen strategy as part of its ambition to become the world’s first “hydrogen society” by adopting fuel across all sectors. South Korea is planning for hydrogen to provide 10% of the energy needs of its cities, counties, and towns by 2030, with its share rising to 30% by 2040. 
African countries such as Morocco and Namibia are emerging as exporters of emissions-free green hydrogen. In Saudi Arabia, THE LINE will have a production site for hydrogen produced with low environmental impact. In July 2020, NEOM signed an agreement with ACWA Power and Air Products to build the world’s largest green hydrogen plant—a $5 billion venture that will produce more than 4 GW of solar and wind power and yield 650 tons per day of hydrogen and 1.2 million tons per year of ammonia. 
This report further highlights the key areas of investment. In addition, it includes Porter’s five forces analysis to understand the competitive scenario of the industry and the role of each stakeholder. The report features strategies adopted by key market players to maintain their foothold in the market. Furthermore, it highlights the competitive landscape of key players to increase their market share and sustain the intense competition in the industry.
Key findings of the study
By type, green hydrogen is projected to grow at the highest CAGR of approximately 15.2%, in terms of during the clean hydrogen market forecast period
By the method, the carbon capture segment dominated the clean hydrogen market share by over 70% in 2021
By application, the industrial segment is projected to grow at the highest CAGR of approximately 15.0%, in terms of during the clean hydrogen market forecast period.
By region, North America dominated the clean hydrogen market and is expected to grow at a CAGR of 15.1% during the forecast period

Overview

The global clean hydrogen market was valued at $3.8 billion in 2022 and is projected to reach $18.3 billion by 2032, growing at a CAGR of 14.8% from 2023 to 2032.
Clean hydrogen is both green and blue hydrogen. Green hydrogen is made by using clean electricity from surplus renewable energy sources, such as solar or wind power, to electrolyze water. Electrolyzers use an electrochemical reaction to split water into its components of hydrogen and oxygen, emitting zero-carbon dioxide in the process. Solid oxide electrolyzers (SOE) use solid ceramics for the purpose of electrolytes. The most common electrolyte for the SOE is a solid oxide fuel cell. The electrolysis in SOEs takes place when electrons from the external circuit combine with the water. At the cathode, hydrogen gas and negative ions are formed.
The oxygen is passed from solid ceramics membranes, which further reacts at the anode end and thus generates clean hydrogen. The SOEs operate at higher temperatures such as above 500°C. A proton exchange membrane (PEM) electrolyzer uses a solid polymer electrolyte. PEM electrolyzers were introduced in 1960 and were developed to replace alkaline electrolyzers. The electrolysis in a PEM takes place in a cell equipped with solid polymer electrolytes. The solid polymer electrolyte is responsible for proton conduction, gas separation, and electrical insulation for electrodes. They can overcome low current density, low-pressure operations, and partial loads.
Blue hydrogen is produced mainly from natural gas, using a process called steam reforming, which brings together natural gas and heated water in the form of steam. The output is hydrogen, but carbon dioxide is also produced as a by-product. So, the definition of blue hydrogen includes the use of carbon capture and storage (CCS) to trap and store this carbon. Blue hydrogen is sometimes described as ‘low-carbon hydrogen’, as the steam reforming process does not actually avoid the creation of greenhouse gases.
Liquid hydrogen is used in aviation and especially aerospace sectors. Moreover, large-scale production of synthetic fuels derived from hydrocarbons and electric vehicles operating on fuel cells contributes to rising demand for the product. Such demand potential needs to be met and thus speeding up the production of clean hydrogen. However, the cost of production of hydrogen involving electrolyzers and carbon capture technology is very high. It brings out the final product to cost around $2-2.5/kg. This cost is not on par with conventional fuels and thus there is reduced interest from customers. Moreover, the production process also incurs efficiency losses. The energy efficiency of hydrogen fuels is much lower in comparison with other sources of energy and thus the market growth suffers for the product.
The clean hydrogen market size is studied by type, method, application, and region. Based on type, the clean hydrogen market is bifurcated into blue hydrogen and green hydrogen. Blue hydrogen dominated the market share revenue for clean hydrogen. However, green hydrogen is projected to grow at a higher CAGR during the clean hydrogen market forecast period. This is owed to boosted search for alternative fuels to transition from conventional fuels to a carbon-free economy. Depending on the method, the market is further classified into electrolysis and carbon capture. Carbon capture dominated the market share revenue for clean hydrogen. However, electrolysis is projected to grow at a higher CAGR during the clean hydrogen market forecast period. This was owed to increased investment in advancing electrolyzers technology for improving efficiency. The electrolysis segment is further divided into alkaline electrolyzers, polymer electrolyte membrane electrolyzers (PEM), and solid oxide electrolyzers (SOE).
By application, the market is divided into industrial, transportation, power, and others. The industrial segment dominated the market share revenue for clean hydrogen. The same is expected to maintain its lead position during the forecast period for the clean hydrogen market. By region, the clean hydrogen market analysis is done across North America, Europe, Asia-Pacific, and LAMEA (Latin America, the Middle East, and Africa). North Amercia dominated the clean hydrogen market share revenue for 2022. The same is expected to grow at a higher CAGR during the forecast period of the clean hydrogen market. Europe follows closely to North America followed by Asia-Pacific.
The major players operating in the clean hydrogen industry are Saudi ARAMCO, Iberdrola, S.A., China Petroleum & Chemical Corporation (Sinopec), Linde plc, Exxon Mobil Corporation, FuelCell Energy, Inc., Air Products and Chemicals, Inc., Plug Power Inc., Orsted A/S, and Enel Green Power Spa. The other market players are NEL ASA, Air Liquide SA, Siemens Energy, Oil & Natural Gas Corporation, and Adani Green Energy.
The drivers, restraints, and opportunities are explained in the report to better understand the market dynamics. This report further highlights the key areas of investment. In addition, it includes Porter’s five forces analysis to understand the competitive scenario of the industry and the role of each stakeholder. The report features strategies adopted by key market players to maintain their foothold in the market. Furthermore, it highlights the competitive landscape of key players to increase their market share and sustain the intense competition in the industry.

Key Benefits For Stakeholders

●This report provides a quantitative analysis of the market segments, current trends, estimations, and dynamics of the clean hydrogen market analysis from 2022 to 2032 to identify the prevailing clean hydrogen market opportunities.
●The market research is offered along with information related to key drivers, restraints, and opportunities.
●Porter's five forces analysis highlights the potency of buyers and suppliers to enable stakeholders make profit-oriented business decisions and strengthen their supplier-buyer network.
●In-depth analysis of the clean hydrogen market segmentation assists to determine the prevailing market opportunities.
●Major countries in each region are mapped according to their revenue contribution to the global market.
●Market player positioning facilitates benchmarking and provides a clear understanding of the present position of the market players.
●The report includes the analysis of the regional as well as global clean hydrogen market trends, key players, market segments, application areas, and market growth strategies.
Key Market Segments
○ FuelCell Energy In

Scope of Clean Hydrogen Market Report

Report Metric Details
Report Name Clean Hydrogen Market
Accounted market size in 2022 $ 3.8 in billion
Forecasted market size in 2032 $ 18.3 billion
CAGR 14.8%
Base Year 2022
Forecasted years 2024 - 2032
By Type ● Blue Hydrogen
● Green Hydrogen
By Method ● Electrolysis
○ Alkaline Electrolyzers
○ Polymer Electrolyte Membrane Electrolyzers
○ Solid Oxide Electrolyzers
● Carbon Capture
By Application ● Others
● Industrial
● Transportation
● Power
By Region
  • North America (United States, Canada)
  • Europe (Germany, France, UK, Italy, Russia) Rest of Europe
  • Nordic Countries
  • Asia-Pacific (China, Japan, South Korea)
  • Southeast Asia (India, Australia)
  • Rest of Asia
  • Latin America (Mexico, Brazil)
  • Rest of Latin America
  • Middle East & Africa (Turkey, Saudi Arabia, UAE, Rest of MEA)
Forecast units USD million in value
Report coverage Revenue and volume forecast, company share, competitive landscape, growth factors and trends

FAQ for this report

How fast is Clean Hydrogen Market growing?

Ans: The Clean Hydrogen Market witnessing a CAGR of 14.8% during the forecast period 2024-2032.

What is the Clean Hydrogen Market size in 2032?

Ans: The Clean Hydrogen Market size in 2032 will be $ 18.3 billion.

What are the Application segmentation covered in the Clean Hydrogen Market report?

Ans: The Applications covered in the Clean Hydrogen Market report are ● Others, ● Industrial, ● Transportation, ● Power

What are the Type segmentation covered in the Clean Hydrogen Market report?

Ans: The Types covered in the Clean Hydrogen Market report are ● Blue Hydrogen, ● Green Hydrogen

CHAPTER 1: INTRODUCTION
1.1. Report description
1.2. Key market segments
1.3. Key benefits to the stakeholders
1.4. Research Methodology
1.4.1. Primary research
1.4.2. Secondary research
1.4.3. Analyst tools and models
CHAPTER 2: EXECUTIVE SUMMARY
2.1. CXO Perspective
CHAPTER 3: MARKET OVERVIEW
3.1. Market definition and scope
3.2. Key findings
3.2.1. Top impacting factors
3.2.2. Top investment pockets
3.3. Porter’s five forces analysis
3.3.1. Bargaining power of suppliers
3.3.2. Bargaining power of buyers
3.3.3. Threat of substitutes
3.3.4. Threat of new entrants
3.3.5. Intensity of rivalry
3.4. Market dynamics
3.4.1. Drivers
3.4.1.1. Increased commercial viability
3.4.1.2. Growth in application of hydrogen
3.4.1.3. Rise in demand for hydrogen as alternative fuels
3.4.1.4. Net zero targets and aim to decarbonize the economy
3.4.2. Restraints
3.4.2.1. Lack of policies and regulatory framework
3.4.2.2. High cost and efficiency losses
3.4.3. Opportunities
3.4.3.1. Flexibility of hydrogen leading to integration on site
3.5. COVID-19 Impact Analysis on the market
3.6. Patent Landscape
3.7. Value Chain Analysis
CHAPTER 4: CLEAN HYDROGEN MARKET, BY TYPE
4.1. Overview
4.1.1. Market size and forecast
4.2. Blue Hydrogen
4.2.1. Key market trends, growth factors and opportunities
4.2.2. Market size and forecast, by region
4.2.3. Market share analysis by country
4.3. Green Hydrogen
4.3.1. Key market trends, growth factors and opportunities
4.3.2. Market size and forecast, by region
4.3.3. Market share analysis by country
CHAPTER 5: CLEAN HYDROGEN MARKET, BY METHOD
5.1. Overview
5.1.1. Market size and forecast
5.2. Electrolysis
5.2.1. Key market trends, growth factors and opportunities
5.2.2. Market size and forecast, by region
5.2.3. Market share analysis by country
5.2.4. Electrolysis Clean Hydrogen Market by Alkaline Electrolyzers
5.2.5. Electrolysis Clean Hydrogen Market by Polymer Electrolyte Membrane Electrolyzers
5.2.6. Electrolysis Clean Hydrogen Market by Solid Oxide Electrolyzers
5.3. Carbon Capture
5.3.1. Key market trends, growth factors and opportunities
5.3.2. Market size and forecast, by region
5.3.3. Market share analysis by country
CHAPTER 6: CLEAN HYDROGEN MARKET, BY APPLICATION
6.1. Overview
6.1.1. Market size and forecast
6.2. Industrial
6.2.1. Key market trends, growth factors and opportunities
6.2.2. Market size and forecast, by region
6.2.3. Market share analysis by country
6.3. Transportation
6.3.1. Key market trends, growth factors and opportunities
6.3.2. Market size and forecast, by region
6.3.3. Market share analysis by country
6.4. Power
6.4.1. Key market trends, growth factors and opportunities
6.4.2. Market size and forecast, by region
6.4.3. Market share analysis by country
6.5. Others
6.5.1. Key market trends, growth factors and opportunities
6.5.2. Market size and forecast, by region
6.5.3. Market share analysis by country
CHAPTER 7: CLEAN HYDROGEN MARKET, BY REGION
7.1. Overview
7.1.1. Market size and forecast By Region
7.2. North America
7.2.1. Key trends and opportunities
7.2.2. Market size and forecast, by Type
7.2.3. Market size and forecast, by Method
7.2.4. Market size and forecast, by Application
7.2.5. Market size and forecast, by country
7.2.5.1. U.S.
7.2.5.1.1. Key market trends, growth factors and opportunities
7.2.5.1.2. Market size and forecast, by Type
7.2.5.1.3. Market size and forecast, by Method
7.2.5.1.4. Market size and forecast, by Application
7.2.5.2. Canada
7.2.5.2.1. Key market trends, growth factors and opportunities
7.2.5.2.2. Market size and forecast, by Type
7.2.5.2.3. Market size and forecast, by Method
7.2.5.2.4. Market size and forecast, by Application
7.2.5.3. Mexico
7.2.5.3.1. Key market trends, growth factors and opportunities
7.2.5.3.2. Market size and forecast, by Type
7.2.5.3.3. Market size and forecast, by Method
7.2.5.3.4. Market size and forecast, by Application
7.3. Europe
7.3.1. Key trends and opportunities
7.3.2. Market size and forecast, by Type
7.3.3. Market size and forecast, by Method
7.3.4. Market size and forecast, by Application
7.3.5. Market size and forecast, by country
7.3.5.1. Germany
7.3.5.1.1. Key market trends, growth factors and opportunities
7.3.5.1.2. Market size and forecast, by Type
7.3.5.1.3. Market size and forecast, by Method
7.3.5.1.4. Market size and forecast, by Application
7.3.5.2. UK
7.3.5.2.1. Key market trends, growth factors and opportunities
7.3.5.2.2. Market size and forecast, by Type
7.3.5.2.3. Market size and forecast, by Method
7.3.5.2.4. Market size and forecast, by Application
7.3.5.3. France
7.3.5.3.1. Key market trends, growth factors and opportunities
7.3.5.3.2. Market size and forecast, by Type
7.3.5.3.3. Market size and forecast, by Method
7.3.5.3.4. Market size and forecast, by Application
7.3.5.4. Italy
7.3.5.4.1. Key market trends, growth factors and opportunities
7.3.5.4.2. Market size and forecast, by Type
7.3.5.4.3. Market size and forecast, by Method
7.3.5.4.4. Market size and forecast, by Application
7.3.5.5. Spain
7.3.5.5.1. Key market trends, growth factors and opportunities
7.3.5.5.2. Market size and forecast, by Type
7.3.5.5.3. Market size and forecast, by Method
7.3.5.5.4. Market size and forecast, by Application
7.3.5.6. Rest of Europe
7.3.5.6.1. Key market trends, growth factors and opportunities
7.3.5.6.2. Market size and forecast, by Type
7.3.5.6.3. Market size and forecast, by Method
7.3.5.6.4. Market size and forecast, by Application
7.4. Asia-Pacific
7.4.1. Key trends and opportunities
7.4.2. Market size and forecast, by Type
7.4.3. Market size and forecast, by Method
7.4.4. Market size and forecast, by Application
7.4.5. Market size and forecast, by country
7.4.5.1. China
7.4.5.1.1. Key market trends, growth factors and opportunities
7.4.5.1.2. Market size and forecast, by Type
7.4.5.1.3. Market size and forecast, by Method
7.4.5.1.4. Market size and forecast, by Application
7.4.5.2. Japan
7.4.5.2.1. Key market trends, growth factors and opportunities
7.4.5.2.2. Market size and forecast, by Type
7.4.5.2.3. Market size and forecast, by Method
7.4.5.2.4. Market size and forecast, by Application
7.4.5.3. India
7.4.5.3.1. Key market trends, growth factors and opportunities
7.4.5.3.2. Market size and forecast, by Type
7.4.5.3.3. Market size and forecast, by Method
7.4.5.3.4. Market size and forecast, by Application
7.4.5.4. South Korea
7.4.5.4.1. Key market trends, growth factors and opportunities
7.4.5.4.2. Market size and forecast, by Type
7.4.5.4.3. Market size and forecast, by Method
7.4.5.4.4. Market size and forecast, by Application
7.4.5.5. Australia
7.4.5.5.1. Key market trends, growth factors and opportunities
7.4.5.5.2. Market size and forecast, by Type
7.4.5.5.3. Market size and forecast, by Method
7.4.5.5.4. Market size and forecast, by Application
7.4.5.6. Rest of Asia-Pacific
7.4.5.6.1. Key market trends, growth factors and opportunities
7.4.5.6.2. Market size and forecast, by Type
7.4.5.6.3. Market size and forecast, by Method
7.4.5.6.4. Market size and forecast, by Application
7.5. LAMEA
7.5.1. Key trends and opportunities
7.5.2. Market size and forecast, by Type
7.5.3. Market size and forecast, by Method
7.5.4. Market size and forecast, by Application
7.5.5. Market size and forecast, by country
7.5.5.1. Brazil
7.5.5.1.1. Key market trends, growth factors and opportunities
7.5.5.1.2. Market size and forecast, by Type
7.5.5.1.3. Market size and forecast, by Method
7.5.5.1.4. Market size and forecast, by Application
7.5.5.2. South Africa,
7.5.5.2.1. Key market trends, growth factors and opportunities
7.5.5.2.2. Market size and forecast, by Type
7.5.5.2.3. Market size and forecast, by Method
7.5.5.2.4. Market size and forecast, by Application
7.5.5.3. Saudi Arabia
7.5.5.3.1. Key market trends, growth factors and opportunities
7.5.5.3.2. Market size and forecast, by Type
7.5.5.3.3. Market size and forecast, by Method
7.5.5.3.4. Market size and forecast, by Application
7.5.5.4. Rest of LAMEA
7.5.5.4.1. Key market trends, growth factors and opportunities
7.5.5.4.2. Market size and forecast, by Type
7.5.5.4.3. Market size and forecast, by Method
7.5.5.4.4. Market size and forecast, by Application
CHAPTER 8: COMPETITIVE LANDSCAPE
8.1. Introduction
8.2. Top winning strategies
8.3. Product Mapping of Top 10 Player
8.4. Competitive Dashboard
8.5. Competitive Heatmap
8.6. Top player positioning, 2022
CHAPTER 9: COMPANY PROFILES
9.1. Saudi Aramco
9.1.1. Company overview
9.1.2. Key Executives
9.1.3. Company snapshot
9.1.4. Operating business segments
9.1.5. Product portfolio
9.1.6. Business performance
9.2. Iberdrola SA
9.2.1. Company overview
9.2.2. Key Executives
9.2.3. Company snapshot
9.2.4. Operating business segments
9.2.5. Product portfolio
9.2.6. Business performance
9.3. China Petroleum & Chemical Corporation
9.3.1. Company overview
9.3.2. Key Executives
9.3.3. Company snapshot
9.3.4. Operating business segments
9.3.5. Product portfolio
9.3.6. Business performance
9.4. Linde plc
9.4.1. Company overview
9.4.2. Key Executives
9.4.3. Company snapshot
9.4.4. Operating business segments
9.4.5. Product portfolio
9.4.6. Business performance
9.5. ExxonMobil
9.5.1. Company overview
9.5.2. Key Executives
9.5.3. Company snapshot
9.5.4. Operating business segments
9.5.5. Product portfolio
9.5.6. Business performance
9.6. FuelCell Energy Inc
9.6.1. Company overview
9.6.2. Key Executives
9.6.3. Company snapshot
9.6.4. Operating business segments
9.6.5. Product portfolio
9.6.6. Business performance
9.7. Air Products & Chemicals Inc.
9.7.1. Company overview
9.7.2. Key Executives
9.7.3. Company snapshot
9.7.4. Operating business segments
9.7.5. Product portfolio
9.7.6. Business performance
9.8. Plug Power Inc.
9.8.1. Company overview
9.8.2. Key Executives
9.8.3. Company snapshot
9.8.4. Operating business segments
9.8.5. Product portfolio
9.8.6. Business performance
9.9. Orsted A/S
9.9.1. Company overview
9.9.2. Key Executives
9.9.3. Company snapshot
9.9.4. Operating business segments
9.9.5. Product portfolio
9.9.6. Business performance
9.10. Enel Green Power Spa
9.10.1. Company overview
9.10.2. Key Executives
9.10.3. Company snapshot
9.10.4. Operating business segments
9.10.5. Product portfoli
LIST OF TABLES
TABLE 01. GLOBAL CLEAN HYDROGEN MARKET, BY TYPE, 2022-2032 ($MILLION)
TABLE 02. CLEAN HYDROGEN MARKET FOR BLUE HYDROGEN, BY REGION, 2022-2032 ($MILLION)
TABLE 03. CLEAN HYDROGEN MARKET FOR GREEN HYDROGEN, BY REGION, 2022-2032 ($MILLION)
TABLE 04. GLOBAL CLEAN HYDROGEN MARKET, BY METHOD, 2022-2032 ($MILLION)
TABLE 05. CLEAN HYDROGEN MARKET FOR ELECTROLYSIS, BY REGION, 2022-2032 ($MILLION)
TABLE 06. GLOBAL ELECTROLYSIS CLEAN HYDROGEN MARKET, BY ALKALINE ELECTROLYZERS, 2022-2032 ($MILLION)
TABLE 07. GLOBAL ELECTROLYSIS CLEAN HYDROGEN MARKET, BY POLYMER ELECTROLYTE MEMBRANE ELECTROLYZERS, 2022-2032 ($MILLION)
TABLE 08. GLOBAL ELECTROLYSIS CLEAN HYDROGEN MARKET, BY SOLID OXIDE ELECTROLYZERS, 2022-2032 ($MILLION)
TABLE 09. CLEAN HYDROGEN MARKET FOR CARBON CAPTURE, BY REGION, 2022-2032 ($MILLION)
TABLE 10. GLOBAL CLEAN HYDROGEN MARKET, BY APPLICATION, 2022-2032 ($MILLION)
TABLE 11. CLEAN HYDROGEN MARKET FOR INDUSTRIAL, BY REGION, 2022-2032 ($MILLION)
TABLE 12. CLEAN HYDROGEN MARKET FOR TRANSPORTATION, BY REGION, 2022-2032 ($MILLION)
TABLE 13. CLEAN HYDROGEN MARKET FOR POWER, BY REGION, 2022-2032 ($MILLION)
TABLE 14. CLEAN HYDROGEN MARKET FOR OTHERS, BY REGION, 2022-2032 ($MILLION)
TABLE 15. CLEAN HYDROGEN MARKET, BY REGION, 2022-2032 ($MILLION)
TABLE 16. NORTH AMERICA CLEAN HYDROGEN MARKET, BY TYPE, 2022-2032 ($MILLION)
TABLE 17. NORTH AMERICA CLEAN HYDROGEN MARKET, BY METHOD, 2022-2032 ($MILLION)
TABLE 18. NORTH AMERICA CLEAN HYDROGEN MARKET, BY APPLICATION, 2022-2032 ($MILLION)
TABLE 19. NORTH AMERICA CLEAN HYDROGEN MARKET, BY COUNTRY, 2022-2032 ($MILLION)
TABLE 20. U.S. CLEAN HYDROGEN MARKET, BY TYPE, 2022-2032 ($MILLION)
TABLE 21. U.S. CLEAN HYDROGEN MARKET, BY METHOD, 2022-2032 ($MILLION)
TABLE 22. U.S. CLEAN HYDROGEN MARKET, BY APPLICATION, 2022-2032 ($MILLION)
TABLE 23. CANADA CLEAN HYDROGEN MARKET, BY TYPE, 2022-2032 ($MILLION)
TABLE 24. CANADA CLEAN HYDROGEN MARKET, BY METHOD, 2022-2032 ($MILLION)
TABLE 25. CANADA CLEAN HYDROGEN MARKET, BY APPLICATION, 2022-2032 ($MILLION)
TABLE 26. MEXICO CLEAN HYDROGEN MARKET, BY TYPE, 2022-2032 ($MILLION)
TABLE 27. MEXICO CLEAN HYDROGEN MARKET, BY METHOD, 2022-2032 ($MILLION)
TABLE 28. MEXICO CLEAN HYDROGEN MARKET, BY APPLICATION, 2022-2032 ($MILLION)
TABLE 29. EUROPE CLEAN HYDROGEN MARKET, BY TYPE, 2022-2032 ($MILLION)
TABLE 30. EUROPE CLEAN HYDROGEN MARKET, BY METHOD, 2022-2032 ($MILLION)
TABLE 31. EUROPE CLEAN HYDROGEN MARKET, BY APPLICATION, 2022-2032 ($MILLION)
TABLE 32. EUROPE CLEAN HYDROGEN MARKET, BY COUNTRY, 2022-2032 ($MILLION)
TABLE 33. GERMANY CLEAN HYDROGEN MARKET, BY TYPE, 2022-2032 ($MILLION)
TABLE 34. GERMANY CLEAN HYDROGEN MARKET, BY METHOD, 2022-2032 ($MILLION)
TABLE 35. GERMANY CLEAN HYDROGEN MARKET, BY APPLICATION, 2022-2032 ($MILLION)
TABLE 36. UK CLEAN HYDROGEN MARKET, BY TYPE, 2022-2032 ($MILLION)
TABLE 37. UK CLEAN HYDROGEN MARKET, BY METHOD, 2022-2032 ($MILLION)
TABLE 38. UK CLEAN HYDROGEN MARKET, BY APPLICATION, 2022-2032 ($MILLION)
TABLE 39. FRANCE CLEAN HYDROGEN MARKET, BY TYPE, 2022-2032 ($MILLION)
TABLE 40. FRANCE CLEAN HYDROGEN MARKET, BY METHOD, 2022-2032 ($MILLION)
TABLE 41. FRANCE CLEAN HYDROGEN MARKET, BY APPLICATION, 2022-2032 ($MILLION)
TABLE 42. ITALY CLEAN HYDROGEN MARKET, BY TYPE, 2022-2032 ($MILLION)
TABLE 43. ITALY CLEAN HYDROGEN MARKET, BY METHOD, 2022-2032 ($MILLION)
TABLE 44. ITALY CLEAN HYDROGEN MARKET, BY APPLICATION, 2022-2032 ($MILLION)
TABLE 45. SPAIN CLEAN HYDROGEN MARKET, BY TYPE, 2022-2032 ($MILLION)
TABLE 46. SPAIN CLEAN HYDROGEN MARKET, BY METHOD, 2022-2032 ($MILLION)
TABLE 47. SPAIN CLEAN HYDROGEN MARKET, BY APPLICATION, 2022-2032 ($MILLION)
TABLE 48. REST OF EUROPE CLEAN HYDROGEN MARKET, BY TYPE, 2022-2032 ($MILLION)
TABLE 49. REST OF EUROPE CLEAN HYDROGEN MARKET, BY METHOD, 2022-2032 ($MILLION)
TABLE 50. REST OF EUROPE CLEAN HYDROGEN MARKET, BY APPLICATION, 2022-2032 ($MILLION)
TABLE 51. ASIA-PACIFIC CLEAN HYDROGEN MARKET, BY TYPE, 2022-2032 ($MILLION)
TABLE 52. ASIA-PACIFIC CLEAN HYDROGEN MARKET, BY METHOD, 2022-2032 ($MILLION)
TABLE 53. ASIA-PACIFIC CLEAN HYDROGEN MARKET, BY APPLICATION, 2022-2032 ($MILLION)
TABLE 54. ASIA-PACIFIC CLEAN HYDROGEN MARKET, BY COUNTRY, 2022-2032 ($MILLION)
TABLE 55. CHINA CLEAN HYDROGEN MARKET, BY TYPE, 2022-2032 ($MILLION)
TABLE 56. CHINA CLEAN HYDROGEN MARKET, BY METHOD, 2022-2032 ($MILLION)
TABLE 57. CHINA CLEAN HYDROGEN MARKET, BY APPLICATION, 2022-2032 ($MILLION)
TABLE 58. JAPAN CLEAN HYDROGEN MARKET, BY TYPE, 2022-2032 ($MILLION)
TABLE 59. JAPAN CLEAN HYDROGEN MARKET, BY METHOD, 2022-2032 ($MILLION)
TABLE 60. JAPAN CLEAN HYDROGEN MARKET, BY APPLICATION, 2022-2032 ($MILLION)
TABLE 61. INDIA CLEAN HYDROGEN MARKET, BY TYPE, 2022-2032 ($MILLION)
TABLE 62. INDIA CLEAN HYDROGEN MARKET, BY METHOD, 2022-2032 ($MILLION)
TABLE 63. INDIA CLEAN HYDROGEN MARKET, BY APPLICATION, 2022-2032 ($MILLION)
TABLE 64. SOUTH KOREA CLEAN HYDROGEN MARKET, BY TYPE, 2022-2032 ($MILLION)
TABLE 65. SOUTH KOREA CLEAN HYDROGEN MARKET, BY METHOD, 2022-2032 ($MILLION)
TABLE 66. SOUTH KOREA CLEAN HYDROGEN MARKET, BY APPLICATION, 2022-2032 ($MILLION)
TABLE 67. AUSTRALIA CLEAN HYDROGEN MARKET, BY TYPE, 2022-2032 ($MILLION)
TABLE 68. AUSTRALIA CLEAN HYDROGEN MARKET, BY METHOD, 2022-2032 ($MILLION)
TABLE 69. AUSTRALIA CLEAN HYDROGEN MARKET, BY APPLICATION, 2022-2032 ($MILLION)
TABLE 70. REST OF ASIA-PACIFIC CLEAN HYDROGEN MARKET, BY TYPE, 2022-2032 ($MILLION)
TABLE 71. REST OF ASIA-PACIFIC CLEAN HYDROGEN MARKET, BY METHOD, 2022-2032 ($MILLION)
TABLE 72. REST OF ASIA-PACIFIC CLEAN HYDROGEN MARKET, BY APPLICATION, 2022-2032 ($MILLION)
TABLE 73. LAMEA CLEAN HYDROGEN MARKET, BY TYPE, 2022-2032 ($MILLION)
TABLE 74. LAMEA CLEAN HYDROGEN MARKET, BY METHOD, 2022-2032 ($MILLION)
TABLE 75. LAMEA CLEAN HYDROGEN MARKET, BY APPLICATION, 2022-2032 ($MILLION)
TABLE 76. LAMEA CLEAN HYDROGEN MARKET, BY COUNTRY, 2022-2032 ($MILLION)
TABLE 77. BRAZIL CLEAN HYDROGEN MARKET, BY TYPE, 2022-2032 ($MILLION)
TABLE 78. BRAZIL CLEAN HYDROGEN MARKET, BY METHOD, 2022-2032 ($MILLION)
TABLE 79. BRAZIL CLEAN HYDROGEN MARKET, BY APPLICATION, 2022-2032 ($MILLION)
TABLE 80. SOUTH AFRICA, CLEAN HYDROGEN MARKET, BY TYPE, 2022-2032 ($MILLION)
TABLE 81. SOUTH AFRICA, CLEAN HYDROGEN MARKET, BY METHOD, 2022-2032 ($MILLION)
TABLE 82. SOUTH AFRICA, CLEAN HYDROGEN MARKET, BY APPLICATION, 2022-2032 ($MILLION)
TABLE 83. SAUDI ARABIA CLEAN HYDROGEN MARKET, BY TYPE, 2022-2032 ($MILLION)
TABLE 84. SAUDI ARABIA CLEAN HYDROGEN MARKET, BY METHOD, 2022-2032 ($MILLION)
TABLE 85. SAUDI ARABIA CLEAN HYDROGEN MARKET, BY APPLICATION, 2022-2032 ($MILLION)
TABLE 86. REST OF LAMEA CLEAN HYDROGEN MARKET, BY TYPE, 2022-2032 ($MILLION)
TABLE 87. REST OF LAMEA CLEAN HYDROGEN MARKET, BY METHOD, 2022-2032 ($MILLION)
TABLE 88. REST OF LAMEA CLEAN HYDROGEN MARKET, BY APPLICATION, 2022-2032 ($MILLION)
TABLE 89. SAUDI ARAMCO: KEY EXECUTIVES
TABLE 90. SAUDI ARAMCO: COMPANY SNAPSHOT
TABLE 91. SAUDI ARAMCO: PRODUCT SEGMENTS
TABLE 92. SAUDI ARAMCO: PRODUCT PORTFOLIO
TABLE 93. IBERDROLA SA: KEY EXECUTIVES
TABLE 94. IBERDROLA SA: COMPANY SNAPSHOT
TABLE 95. IBERDROLA SA: PRODUCT SEGMENTS
TABLE 96. IBERDROLA SA: PRODUCT PORTFOLIO
TABLE 97. CHINA PETROLEUM & CHEMICAL CORPORATION: KEY EXECUTIVES
TABLE 98. CHINA PETROLEUM & CHEMICAL CORPORATION: COMPANY SNAPSHOT
TABLE 99. CHINA PETROLEUM & CHEMICAL CORPORATION: PRODUCT SEGMENTS
TABLE 100. CHINA PETROLEUM & CHEMICAL CORPORATION: PRODUCT PORTFOLIO
TABLE 101. LINDE PLC: KEY EXECUTIVES
TABLE 102. LINDE PLC: COMPANY SNAPSHOT
TABLE 103. LINDE PLC: PRODUCT SEGMENTS
TABLE 104. LINDE PLC: PRODUCT PORTFOLIO
TABLE 105. EXXONMOBIL: KEY EXECUTIVES
TABLE 106. EXXONMOBIL: COMPANY SNAPSHOT
TABLE 107. EXXONMOBIL: PRODUCT SEGMENTS
TABLE 108. EXXONMOBIL: PRODUCT PORTFOLIO
TABLE 109. FUELCELL ENERGY INC: KEY EXECUTIVES
TABLE 110. FUELCELL ENERGY INC: COMPANY SNAPSHOT
TABLE 111. FUELCELL ENERGY INC: PRODUCT SEGMENTS
TABLE 112. FUELCELL ENERGY INC: PRODUCT PORTFOLIO
TABLE 113. AIR PRODUCTS & CHEMICALS INC.: KEY EXECUTIVES
TABLE 114. AIR PRODUCTS & CHEMICALS INC.: COMPANY SNAPSHOT
TABLE 115. AIR PRODUCTS & CHEMICALS INC.: PRODUCT SEGMENTS
TABLE 116. AIR PRODUCTS & CHEMICALS INC.: PRODUCT PORTFOLIO
TABLE 117. PLUG POWER INC.: KEY EXECUTIVES
TABLE 118. PLUG POWER INC.: COMPANY SNAPSHOT
TABLE 119. PLUG POWER INC.: PRODUCT SEGMENTS
TABLE 120. PLUG POWER INC.: PRODUCT PORTFOLIO
TABLE 121. ORSTED A/S: KEY EXECUTIVES
TABLE 122. ORSTED A/S: COMPANY SNAPSHOT
TABLE 123. ORSTED A/S: SERVICE SEGMENTS
TABLE 124. ORSTED A/S: PRODUCT PORTFOLIO
TABLE 125. ENEL GREEN POWER SPA: KEY EXECUTIVES
TABLE 126. ENEL GREEN POWER SPA: COMPANY SNAPSHOT
TABLE 127. ENEL GREEN POWER SPA: PRODUCT SEGMENTS
TABLE 128. ENEL GREEN POWER SPA: PRODUCT PORTFOLIO LIST OF FIGURES
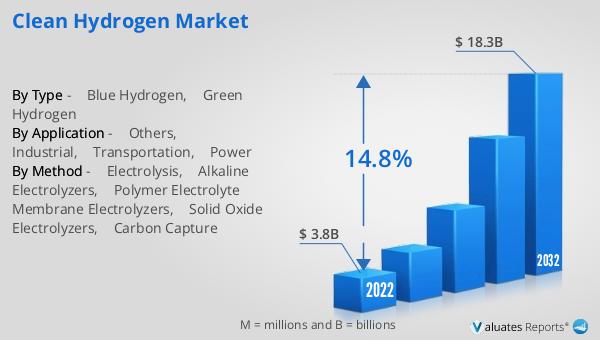
FIGURE 01. CLEAN HYDROGEN MARKET, 2022-2032
FIGURE 02. SEGMENTATION OF CLEAN HYDROGEN MARKET, 2022-2032
FIGURE 03. TOP INVESTMENT POCKETS IN CLEAN HYDROGEN MARKET (2023-2032)
FIGURE 04. LOW BARGAINING POWER OF SUPPLIERS
FIGURE 05. LOW BARGAINING POWER OF BUYERS
FIGURE 06. LOW THREAT OF SUBSTITUTES
FIGURE 07. LOW THREAT OF NEW ENTRANTS
FIGURE 08. LOW INTENSITY OF RIVALRY
FIGURE 09. DRIVERS, RESTRAINTS AND OPPORTUNITIES: GLOBALCLEAN HYDROGEN MARKET
FIGURE 10. PATENT ANALYSIS BY COMPANY
FIGURE 11. PATENT ANALYSIS BY COUNTRY
FIGURE 12. VALUE CHAIN ANALYSIS: CLEAN HYDROGEN MARKET
FIGURE 13. CLEAN HYDROGEN MARKET, BY TYPE, 2022(%)
FIGURE 14. COMPARATIVE SHARE ANALYSIS OF CLEAN HYDROGEN MARKET FOR BLUE HYDROGEN, BY COUNTRY 2022 AND 2032(%)
FIGURE 15. COMPARATIVE SHARE ANALYSIS OF CLEAN HYDROGEN MARKET FOR GREEN HYDROGEN, BY COUNTRY 2022 AND 2032(%)
FIGURE 16. CLEAN HYDROGEN MARKET, BY METHOD, 2022(%)
FIGURE 17. COMPARATIVE SHARE ANALYSIS OF CLEAN HYDROGEN MARKET FOR ELECTROLYSIS, BY COUNTRY 2022 AND 2032(%)
FIGURE 18. COMPARATIVE SHARE ANALYSIS OF CLEAN HYDROGEN MARKET FOR CARBON CAPTURE, BY COUNTRY 2022 AND 2032(%)
FIGURE 19. CLEAN HYDROGEN MARKET, BY APPLICATION, 2022(%)
FIGURE 20. COMPARATIVE SHARE ANALYSIS OF CLEAN HYDROGEN MARKET FOR INDUSTRIAL, BY COUNTRY 2022 AND 2032(%)
FIGURE 21. COMPARATIVE SHARE ANALYSIS OF CLEAN HYDROGEN MARKET FOR TRANSPORTATION, BY COUNTRY 2022 AND 2032(%)
FIGURE 22. COMPARATIVE SHARE ANALYSIS OF CLEAN HYDROGEN MARKET FOR POWER, BY COUNTRY 2022 AND 2032(%)
FIGURE 23. COMPARATIVE SHARE ANALYSIS OF CLEAN HYDROGEN MARKET FOR OTHERS, BY COUNTRY 2022 AND 2032(%)
FIGURE 24. CLEAN HYDROGEN MARKET BY REGION, 2022
FIGURE 25. U.S. CLEAN HYDROGEN MARKET, 2022-2032 ($MILLION)
FIGURE 26. CANADA CLEAN HYDROGEN MARKET, 2022-2032 ($MILLION)
FIGURE 27. MEXICO CLEAN HYDROGEN MARKET, 2022-2032 ($MILLION)
FIGURE 28. GERMANY CLEAN HYDROGEN MARKET, 2022-2032 ($MILLION)
FIGURE 29. UK CLEAN HYDROGEN MARKET, 2022-2032 ($MILLION)
FIGURE 30. FRANCE CLEAN HYDROGEN MARKET, 2022-2032 ($MILLION)
FIGURE 31. ITALY CLEAN HYDROGEN MARKET, 2022-2032 ($MILLION)
FIGURE 32. SPAIN CLEAN HYDROGEN MARKET, 2022-2032 ($MILLION)
FIGURE 33. REST OF EUROPE CLEAN HYDROGEN MARKET, 2022-2032 ($MILLION)
FIGURE 34. CHINA CLEAN HYDROGEN MARKET, 2022-2032 ($MILLION)
FIGURE 35. JAPAN CLEAN HYDROGEN MARKET, 2022-2032 ($MILLION)
FIGURE 36. INDIA CLEAN HYDROGEN MARKET, 2022-2032 ($MILLION)
FIGURE 37. SOUTH KOREA CLEAN HYDROGEN MARKET, 2022-2032 ($MILLION)
FIGURE 38. AUSTRALIA CLEAN HYDROGEN MARKET, 2022-2032 ($MILLION)
FIGURE 39. REST OF ASIA-PACIFIC CLEAN HYDROGEN MARKET, 2022-2032 ($MILLION)
FIGURE 40. BRAZIL CLEAN HYDROGEN MARKET, 2022-2032 ($MILLION)
FIGURE 41. SOUTH AFRICA, CLEAN HYDROGEN MARKET, 2022-2032 ($MILLION)
FIGURE 42. SAUDI ARABIA CLEAN HYDROGEN MARKET, 2022-2032 ($MILLION)
FIGURE 43. REST OF LAMEA CLEAN HYDROGEN MARKET, 2022-2032 ($MILLION)
FIGURE 44. TOP WINNING STRATEGIES, BY YEAR
FIGURE 45. TOP WINNING STRATEGIES, BY DEVELOPMENT
FIGURE 46. TOP WINNING STRATEGIES, BY COMPANY
FIGURE 47. PRODUCT MAPPING OF TOP 10 PLAYERS
FIGURE 48. COMPETITIVE DASHBOARD
FIGURE 49. COMPETITIVE HEATMAP: CLEAN HYDROGEN MARKET
FIGURE 50. TOP PLAYER POSITIONING, 2022
FIGURE 51. SAUDI ARAMCO: NET SALES, 2018-2020 ($MILLION)
FIGURE 52. SAUDI ARAMCO: RESEARCH & DEVELOPMENT EXPENDITURE, 2018-2020 ($MILLION)
FIGURE 53. SAUDI ARAMCO: REVENUE SHARE BY SEGMENT, 2020 (%)
FIGURE 54. SAUDI ARAMCO: REVENUE SHARE BY REGION, 2020 (%)
FIGURE 55. IBERDROLA SA: NET REVENUE, 2020-2022 ($MILLION)
FIGURE 56. IBERDROLA SA: REVENUE SHARE BY REGION, 2022 (%)
FIGURE 57. IBERDROLA SA: REVENUE SHARE BY SEGMENT, 2022 (%)
FIGURE 58. CHINA PETROLEUM & CHEMICAL CORPORATION: NET REVENUE, 2019-2021 ($MILLION)
FIGURE 59. CHINA PETROLEUM & CHEMICAL CORPORATION: REVENUE SHARE BY SEGMENT, 2021 (%)
FIGURE 60. CHINA PETROLEUM & CHEMICAL CORPORATION: REVENUE SHARE BY REGION, 2021 (%)
FIGURE 61. LINDE PLC: NET SALES, 2020-2022 ($MILLION)
FIGURE 62. LINDE PLC: RESEARCH & DEVELOPMENT EXPENDITURE, 2020-2022 ($MILLION)
FIGURE 63. LINDE PLC: REVENUE SHARE BY SEGMENT, 2022 (%)
FIGURE 64. LINDE PLC: REVENUE SHARE BY REGION, 2022 (%)
FIGURE 65. EXXONMOBIL: NET REVENUE, 2019-2021 ($MILLION)
FIGURE 66. EXXONMOBIL: REVENUE SHARE BY SEGMENT, 2021 (%)
FIGURE 67. EXXONMOBIL: REVENUE SHARE BY REGION, 2021 (%)
FIGURE 68. FUELCELL ENERGY INC: NET REVENUE, 2020-2022 ($MILLION)
FIGURE 69. FUELCELL ENERGY INC: REVENUE SHARE BY SEGMENT, 2022 (%)
FIGURE 70. AIR PRODUCTS & CHEMICALS INC.: NET SALES, 2020-2022 ($MILLION)
FIGURE 71. AIR PRODUCTS & CHEMICALS INC.: REVENUE SHARE BY REGION, 2022 (%)
FIGURE 72. AIR PRODUCTS & CHEMICALS INC.: REVENUE SHARE BY SEGMENT, 2022 (%)
FIGURE 73. PLUG POWER INC.: RESEARCH & DEVELOPMENT EXPENDITURE, 2019-2021 ($MILLION)
FIGURE 74. PLUG POWER INC.: NET REVENUE, 2019-2021 ($MILLION)
FIGURE 75. PLUG POWER INC.: REVENUE SHARE BY SEGMENT, 2021 (%)
FIGURE 76. PLUG POWER INC.: REVENUE SHARE BY REGION, 2021 (%)
FIGURE 77. ORSTED A/S: NET REVENUE, 2020-2022 ($MILLION)
FIGURE 78. ORSTED A/S: REVENUE SHARE BY SEGMENT, 2022 (%
SELECT A FORMAT
Added to Cart
Electronic (PDF)

$5730

This license allows only one user to access the PDF.
Electronic (PDF)

$6450

This license allows 1 - 5 user to access the PDF, license is suitable for small groups of 5 users working together
Electronic (PDF)

$9600

This license allows users/teams in a same Enterprise to use this report, various departments within an enterpise can use this report
Electronic (PDF)

$3840

This license just provides quantitative data in a excel sheet
Add to Cart
Buy Now (15% Discount)

OUR CUSTOMER

SecuX Technology Inc

SIMILAR REPORTS