0
U.S. (TOLL FREE)
+1 (315) 215-3225
Automative

0
U.S. (TOLL FREE)
+1 (315) 215-3225
Smart Retail Devices Market By Technology, and Application: Global Opportunity Analysis and Industry Forecast, 2020 - 2027
Published Date: January 2021
|
Report Code: ALLI-Auto-3L454
Home | Market Reports | Business & Industrial| Business Services
Smart Retail Devices Market By Technology Digital Signage Smart Labels Smart Payments Smart Carts Electronic Shelf Labels and Others and Application Smart Transportation Predictive Equipment Maintenance Inventory Management Smart Fitting Room Foot Traffic Monitoring and Others Global Opportunity Analysis and Industry Forecast 2020 2027
BUY CHAPTERS

Smart Retail Devices Market By Technology, and Application: Global Opportunity Analysis and Industry Forecast, 2020 - 2027

Code: ALLI-Auto-3L454
Report
January 2021
Pages:239
Allied Market Research
Buy Now with 15% Discount
DESCRIPTION
TABLE OF CONTENT
TABLES & FIGURES

Smart Retail Devices Market Overview 2027

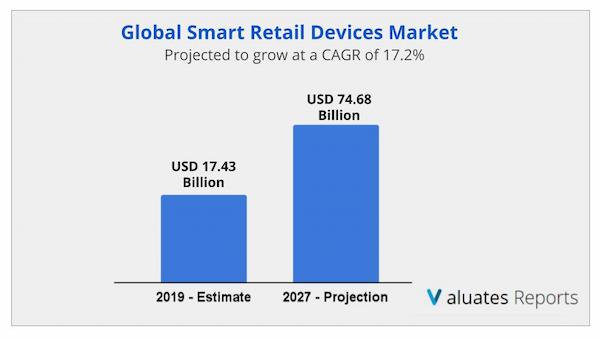
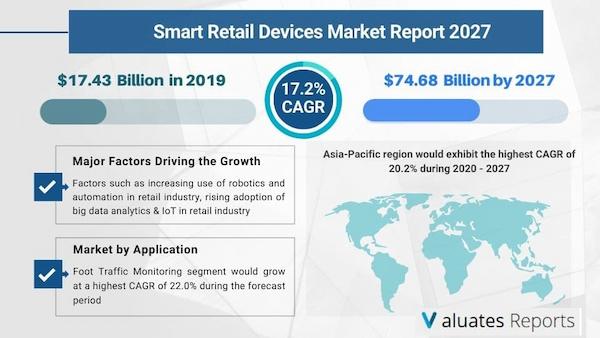
The global smart retail devices market size was valued at $17.43 billion in 2019 and is projected to reach $74.68 billion by 2027, registering a CAGR of 17.2% from 2020 to 2027. According to smart retail devices market trends, smart retail devices industry takes the assistance of internet of things (IoT) in its operation. Smart devices and IoT in retail help retailers enhance the customer experience and drive more enhanced consumer engagement which significantly alters the day-to-day store operations. Energy management, theft prevention, in-store navigation, and customer engagement are few advantages of utilizing IoT in retail industry.
 
Smart Retail Devices Market
Retail stores are focusing on using the emerging technologies such as cloud, mobile, RFID, beacons, and others, to provide connected retail services and better shopping experience to customers. For instance, store owners are integrating sensors in the key zones of retail stores and connecting them to cloud through a gateway that enables real-time data analysis related to products, sales, and customers from the sensors.
 
The growing incorporation of technologies such as augmented reality, virtual reality, artificial intelligence, and IoT, to improve store operations, facilitate accurate inventory management, and enhance consumer’s shopping experience is one of the key trends escalating market growth.
 
Factors such as increase in use of robotics and automation in the retail industry, rise in adoption of big data analytics & IoT in retail industry and surge in purchasing power of consumers and economic growth are the major drivers significantly affecting the market growth. However, increased maintenance costs of advanced high-end computing systems and high risks of customer data thefts have a significant negative impact on the market growth. Furthermore, technological advancements with real-time data analysis and increase in number of smart stores are expected to offer lucrative opportunities to the market growth globally.

Smart Retail Devices Market Segmentation Review

The global smart retail devices market share is segmented on the basis of technology, application, and region. Based on technology, the market is analyzed across digital signage, smart labels, smart payments, smart carts, electronic shelf labels, and others. By application, the market is classified into smart transportation, predictive equipment maintenance, inventory management, smart fitting room, foot traffic monitoring, and others. Region-wise, the market has been analyzed across North America, Europe, Asia-Pacific, and LAMEA.

Smart Retail Devices Market Competitive Analysis

The prominent key players profiled in the smart retail devices market analysis include IBM, Intel, Cisco, NXP semiconductors, Microsoft, NVIDIA Corporation, Samsung Electronics, Texas Instrument, Softbank Robotics and PAX global technology. These key players have adopted strategies, such as product portfolio expansion, mergers & acquisitions, agreements, geographical expansion, and collaborations, to enhance their market penetration.
Smart Retail Devices Market Size
 
The scope of the report discusses the potential opportunities for the market players to enter the global smart retail devices market. This report also provides in-depth analysis of the market, outlining current trends, key driving factors, and key areas of investment. It includes Porter’s five forces analysis to understand the competitive scenario of the industry and role of each stakeholder in the value chain. The report features the strategies adopted by the key market players to maintain their foothold in the market.

Top Impacting Factors

Factors affecting the growth of the global smart retail devices market size include increase in use of robotics and automation in retail industry, rise in adoption of big data analytics & IoT in retail industry and surge in purchasing power of consumers and economic growth. However, increased maintenance costs of advanced high-end computing systems and high risks of customer data thefts have a significant negative impact on the market growth. Furthermore, technological advancements with real-time data analysis and increase in number of smart stores are expected to offer lucrative smart retail devices market opportunity globally.

Increase in Use of Robotics and Automation in the Retail Industry

At present, market is filled with research and adoption of numerous automation techniques to increase productivity, accuracy, and eliminate human errors and for safety. Smart retail is considered to be one of the advancements in automatic system as it provides innovative solutions in the direction of retail automation for consumer experience enhancement.

Increased Maintenance Cost

Smart retail devices enable fast, reliable & precise control, effective production, and increased delivery reliability. However, it incurs high investment in maintenance, which is essential to help the technology enter new markets. The system enables flexibility to inspect multiple products on the same smart camera, which is often difficult.

Technological Advancement in Real-Time Data Analytics

In the current IT-dominant world, people are moving toward automation-based solution and services. This has led to increased focus on IoT-based devices, real-time data analytics and AI due to their innovative and advanced applications. Real-time data analytics provides a common network for successful information transfer.

COVID-19 Impact Analysis

The COVID-19 crisis is creating uncertainty in the stock market due to immense slowdown in the supply chain of various businesses, falling business confidence, and increasing panic among the customer segments. The overall impact of the pandemic is impacting the production process of several industries, including semiconductor, electronics, and others. Trade barriers are further constraining the demand and supply outlook. As the governments of different countries have already declared total lockdown and temporary shutdown of industries, the overall production process has been adversely affected.

COVID-19 is having a large impact on both consumer and the economy. Electronics manufacturing hubs have been temporarily shut down to limit the COVID-19 spread among individuals. This has majorly affected the supply chain of the semiconductor market by creating shortages of materials, components, and finished goods. Lack of business continuity has ensured significant negative impacts on shareholder returns and revenue, which are expected to create financial disruptions in the smart retail devices industry.

To stimulate the local economy, several governments have already announced subsidies and incentives, which are varying by region. For instance, China declared extended state subsidies and tax breaks for consumers purchasing new electric vehicles. In addition, the U.S. has reduced fuel-efficiency standards for automakers. Retail companies are expected to track such regional variation, as it may affect the demand patterns of consumers and anticipate government evolution.

However, the COVID-19 crisis is expected to accelerate automation and the adoption of Industry 4.0 technologies. Remote manufacturing, diagnostics, and maintenance could all become permanent features. If that occurs, smart retail companies might become smart workspaces, with technologies that facilitate remote work for most of the employees. The companies are also expected to adopt and encourage a hybrid model in their manufacturing processes in which a certain number of employees work remotely and the rest remain on site. The efficiencies gained through such changes as well as their start-up costs could influence future smart retail devices revenues.

Key Benefits for Stakeholders

  • This study includes the analytical depiction of the global smart retail devices market along with the current trends and future estimations to determine the imminent investment pockets.
  • The report presents information regarding the key drivers, restraints, and opportunities in the global smart retail devices market.
  • The global smart retail devices market trends are quantitatively analyzed from 2019 to 2027 to highlight the financial competency of the industry.
  • Porter’s five forces analysis illustrates the potency of the buyers and suppliers in the industry.

Smart Retail Devices Market Key Segments

By Technology
  • Digital Signage
  • Smart Labels
  • Smart Payments
  • Smart Carts
  • Electronic Shelf Labels
  • Others
By Application
  • Smart Transportation
  • Predictive Equipment Maintenance
  • Inventory Management
  • Smart Fitting Room
  • Foot Traffic Monitoring
  • Others
By Region
  • North America
    • U.S.
    • Canada
    • Mexico
  • Europe
    • UK
    • Germany
    • France
    • Italy
    • Rest of Europe
  • Asia-Pacific
    • China
    • Japan
    • India
    • Australia
    • Rest of Asia-Pacific
  • LAMEA
    • Latin America
    • Middle East
    • Africa
Key Market Players
  • IBM
  • Intel
  • Cisco
  • NXP semiconductors
  • Microsoft
  • NVIDIA corporation
  • Samsung Electronics
  • Texas Instrument
  • Softbank Robotics
  • PAX global technology
TABLE O
 
CHAPTER 1:INTRODUCTION
1.1.REPORT DESCRIPTION
1.2.KEY BENEFITS FOR STAKEHOLDERS
1.3.KEY MARKET SEGMENTS
1.4.RESEARCH METHODOLOGY
1.4.1.Primary research
1.4.2.Secondary research
1.4.3.Analyst tools and models
CHAPTER 2:EXECUTIVE SUMMARY
2.1.KEY FINDINGS
2.1.1.Top impacting factors
2.1.2.Top investment pockets
2.2.CXO PERSPECTIVE
CHAPTER 3:MARKET OVERVIEW
3.1.MARKET DEFINITION AND SCOPE
3.2.PORTER’S FIVE FORCES ANALYSIS
3.3.PATENT ANALYSIS
3.3.1.By region (2017-2019)
3.3.2.By applicant
3.4.MARKET DYNAMICS
3.4.1.Drivers
3.4.1.1.Increasing use of robotics and automation in retail industry
3.4.1.2.Rising adoption of big data analytics & IoT in retail industry
3.4.1.3.Surge in purchasing power of consumers and economic growth
3.4.2.Restraints
3.4.2.1.Increased maintenance cost of high-end devices
3.4.2.2.Risk towards consumer data thefts
3.4.3.Opportunity
3.4.3.1.Technological advancement with real-time data analytics
3.4.3.2.Increasing number of smart stores
3.5.COVID IMPACT
3.5.1.Impact on market size
3.5.2.End user trends, preferences, and budget impact
3.5.3.End user trends, preferences, and budget impact
3.5.4.Parent industry impact
3.5.5.Key player strategies to tackle negative impact
3.5.5.1.Limiting cuts to R&D expense:
3.5.5.2.Focusing on next-generation products
3.5.5.3.Shifting toward agile supply chain model
3.5.6.Opportunity window
CHAPTER 4:SMART RETAIL DEVICES MARKET, BY TECHNOLOGY
4.1.OVERVIEW
4.2.DIGITAL SIGNAGE
4.2.1.Key market trends, growth factors, and opportunities
4.2.2.Market size and forecast, by region
4.2.3.Market analysis, by country
4.3.SMART LABELS
4.3.1.Key market trends, growth factors, and opportunities
4.3.2.Market size and forecast, by region
4.3.3.Market analysis, by country
4.4.SMART PAYMENTS
4.4.1.Key market trends, growth factors, and opportunities
4.4.2.Market size and forecast, by region
4.4.3.Market analysis, by country
4.5.SMART CARTS
4.5.1.Key market trends, growth factors, and opportunities
4.5.2.Market size and forecast, by region
4.5.3.Market analysis, by country
4.6.ELECTRONIC SHELF LABELS
4.6.1.Key market trends, growth factors, and opportunities
4.6.2.Market size and forecast, by region
4.6.3.Market analysis, by country
4.7.OTHERS
4.7.1.Key market trends, growth factors, and opportunities
4.7.2.Market size and forecast, by region
4.7.3.Market analysis, by country
CHAPTER 5:SMART RETAIL DEVICES MARKET, BY APPLICATION
5.1.OVERVIEW
5.2.SMART TRANSPORTATION
5.2.1.Key market trends, growth factors, and opportunities
5.2.2.Market size and forecast, by region
5.2.3.Market analysis, by country
5.3.PREDICTIVE EQUIPMENT MAINTENANCE
5.3.1.Key market trends, growth factors, and opportunities
5.3.2.Market size and forecast, by region
5.3.3.Market analysis, by country
5.4.INVENTORY MANAGEMENT
5.4.1.Key market trends, growth factors, and opportunities
5.4.2.Market size and forecast, by region
5.4.3.Market analysis, by country
5.5.SMART FITTING ROOM
5.5.1.Key market trends, growth factors, and opportunities
5.5.2.Market size and forecast, by region
5.5.3.Market analysis, by country
5.6.FOOT TRAFFIC MONITORING
5.6.1.Key market trends, growth factors, and opportunities
5.6.2.Market size and forecast, by region
5.6.3.Market analysis, by country
5.7.OTHERS
5.7.1.Key market trends, growth factors, and opportunities
5.7.2.Market size and forecast, by region
5.7.3.Market analysis, by country
CHAPTER 6:SMART RETAIL DEVICES MARKET, BY REGION
6.1.OVERVIEW
6.2.NORTH AMERICA
6.2.1.Key market trends, growth factors, and opportunities
6.2.2.Market size and forecast, by technology
6.2.3.Market size and forecast, by application
6.2.4.Market analysis, by country
6.2.4.1.U.S.
6.2.4.1.1.Market size and forecast, by technology
6.2.4.1.2.Market size and forecast, by application
6.2.4.2.Canada
6.2.4.2.1.Market size and forecast, by technology
6.2.4.2.2.Market size and forecast, by application
6.2.4.3.Mexico
6.2.4.3.1.Market size and forecast, by technology
6.2.4.3.2.Market size and forecast, by application
6.3.EUROPE
6.3.1.Key market trends, growth factors, and opportunities
6.3.2.Market size and forecast, by technology
6.3.3.Market size and forecast, by application
6.3.4.Market analysis, by country
6.3.4.1.UK
6.3.4.1.1.Market size and forecast, by technology
6.3.4.1.2.Market size and forecast, by application
6.3.4.2.Germany
6.3.4.2.1.Market size and forecast, by technology
6.3.4.2.2.Market size and forecast, by application
6.3.4.3.France
6.3.4.3.1.Market size and forecast, by technology
6.3.4.3.2.Market size and forecast, by application
6.3.4.4.Italy
6.3.4.4.1.Market size and forecast, by technology
6.3.4.4.2.Market size and forecast, by application
6.3.4.5.Rest of Europe
6.3.4.5.1.Market size and forecast, by technology
6.3.4.5.2.Market size and forecast, by application
6.4.ASIA-PACIFIC
6.4.1.Key market trends, growth factors, and opportunities
6.4.2.Market size and forecast, by technology
6.4.3.Market size and forecast, by application
6.4.4.Market analysis, by country
6.4.4.1.China
6.4.4.1.1.Market size and forecast, by technology
6.4.4.1.2.Market size and forecast, by application
6.4.4.2.Japan
6.4.4.2.1.Market size and forecast, by technology
6.4.4.2.2.Market size and forecast, by application
6.4.4.3.India
6.4.4.3.1.Market size and forecast, by technology
6.4.4.3.2.Market size and forecast, by application
6.4.4.4.Australia
6.4.4.4.1.Market size and forecast, by technology
6.4.4.4.2.Market size and forecast, by application
6.4.4.5.Rest of Asia-Pacific
6.4.4.5.1.Market size and forecast, by technology
6.4.4.5.2.Market size and forecast, by application
6.5.LAMEA
6.5.1.Key market trends, growth factors, and opportunities
6.5.2.Market size and forecast, by technology
6.5.3.Market size and forecast, by application
6.5.4.Market analysis, by country
6.5.4.1.Latin America
6.5.4.1.1.Market size and forecast, by technology
6.5.4.1.2.Market size and forecast, by application
6.5.4.2.Middle East
6.5.4.2.1.Market size and forecast, by technology
6.5.4.2.2.Market size and forecast, by application
6.5.4.3.Africa
6.5.4.3.1.Market size and forecast, by technology
6.5.4.3.2.Market size and forecast, by application
CHAPTER 7:COMPETITIVE LANDSCAPE
7.1.INTRODUCTION
7.1.1.MARKET PLAYER POSITIONING, 2019
7.2.TOP WINNING STRATEGIES
7.2.1.Top winning strategies, by year
7.2.2.Top winning strategies, by development
7.2.3.Top winning strategies, by company
7.3.COMPETITIVE DASHBOARD
7.4.COMPETITIVE HEATMAP
CHAPTER 8:COMPANY PROFILES
8.1.IBM
8.1.1.Company overview
8.1.2.Company snapshot
8.1.3.Operating business segments
8.1.4.Product portfolio
8.1.5.R&D Expenditure
8.1.6.Business performance
8.1.7.Key strategic moves and developments
8.2.INTEL
8.2.1.Company overview
8.2.2.Company snapshot
8.2.3.Operating business segments
8.2.4.Product portfolio
8.2.5.R&D expenditure
8.2.6.Business performance
8.2.7.Key strategic moves and developments
8.3.NXP SEMICONDUCTOR
8.3.1.Company overview
8.3.2.Company snapshot
8.3.3.Product portfolio
8.3.4.R&D Expenditure
8.3.5.Business performance
8.3.6.Key strategic moves and developments
8.4.CISCO
8.4.1.Company overview
8.4.2.Key executives
8.4.3.Company snapshot
8.4.4.Product portfolio
8.4.5.Key strategic moves and developments
8.5.MICROSOFT
8.5.1.Company overview
8.5.2.Key executives
8.5.3.Company snapshot
8.5.4.Product portfolio
8.5.5.R&D expenditure
8.5.6.Business performance
8.5.7.Key strategic moves and developments
8.6.NVIDIA CORPORATION
8.6.1.Company overview
8.6.2.Key executives
8.6.3.Company snapshot
8.6.4.Product portfolio
8.6.5.R&D expenditure
8.6.6.Business performance
8.7.SAMSUNG ELECTRONICS
8.7.1.Company overview
8.7.2.Company snapshot
8.7.3.Operating business segments
8.7.4.Product portfolio
8.7.5.R&D expenditure
8.7.6.Business performance
8.7.7.Key strategic moves and developments
8.8.TEXAS INSTRUMENTS
8.8.1.Company overview
8.8.2.Key executives
8.8.3.Company snapshot
8.8.4.Operating business segments
8.8.5.Product portfolio
8.8.6.R&D expenditure
8.8.7.Business performance
8.8.8.Key strategic moves and developments
8.9.SOFTBANKS ROBOTICS
8.9.1.Company overview
8.9.2.Company snapshot
8.9.3.Operating business segments
8.9.4.Product portfolio
8.9.5.R&D Expenditure
8.9.6.Business performance
8.9.7.Key strategic moves and developments
8.10.PAX GLOBAL TECHNOLOGIES
8.10.1.Company overview
8.10.2.Company snapshot
8.10.3.Operating business segments
8.10.4.Product portfolio
8.10.5.Business performance
8.10.6.Key strategic moves and developments
8.10.7.Key strategic moves and development
LIST OF TABLES

TABLE 01.SMART RETAIL DEVICES MARKET FOR DIGITAL SIGNAGE, BY REGION, 2019-2027 ($MILLION)
TABLE 02.SMART RETAIL DEVICES MARKET FOR SMART LABELS, BY REGION 2019-2027 ($MILLION)
TABLE 03.SMART RETAIL DEVICES MARKET FOR SMART PAYMENTS, BY REGION 2019-2027 ($MILLION)
TABLE 04.SMART RETAIL DEVICES MARKET FOR SMART CARTS, BY REGION 2019-2027 ($MILLION)
TABLE 05.SMART RETAIL DEVICES MARKET FOR ELECTRONIC SHELF LABELS, BY REGION 2019-2027 ($MILLION)
TABLE 06.SMART RETAIL DEVICES MARKET FOR OTHERS, BY REGION 2019-2027 ($MILLION)
TABLE 07.GLOBAL SMART RETAIL DEVICES MARKET, BY APPLICATION, 2019-2027($MILLION)
TABLE 08.SMART RETAIL DEVICES MARKET FOR SMART TRANSPORTATION, BY REGION 2019-2027 ($MILLION)
TABLE 09.SMART RETAIL DEVICES MARKET FOR PREDICTIVE EQUIPMENT MAINTENANCE, BY REGION 2019-2027 ($MILLION)
TABLE 10.SMART RETAIL DEVICES MARKET FOR INVENTORY MANAGEMENT, BY REGION 2019-2027 ($MILLION)
TABLE 11.SMART RETAIL DEVICES MARKET FOR SMART FITTING ROOM, BY REGION 2019-2027 ($MILLION)
TABLE 12.SMART RETAIL DEVICES MARKET FOR FOOT TRAFFIC MONITORING, BY REGION 2019-2027 ($MILLION)
TABLE 13.SMART RETAIL DEVICES MARKET FOR OTHERS, BY REGION 2019-2027 ($MILLION)
TABLE 14.SMART RETAIL DEVICES MARKET REVENUE, BY REGION, 2019–2027 ($MILLION)
TABLE 15.NORTH AMERICA SMART RETAIL DEVICES MARKET, BY TECHNOLOGY, 2019–2027 ($MILLION)
TABLE 16.NORTH AMERICA SMART RETAIL DEVICES MARKET, BY APPLICATION, 2019–2027 ($MILLION)
TABLE 17.U.S. SMART RETAIL DEVICES MARKET, BY TECHNOLOGY, 2019–2027 ($MILLION)
TABLE 18.U.S. SMART RETAIL DEVICES MARKET, BY APPLICATION, 2019–2027 ($MILLION)
TABLE 19.CANADA SMART RETAIL DEVICES MARKET, BY TECHNOLOGY, 2019–2027 ($MILLION)
TABLE 20.CANADA SMART RETAIL DEVICES MARKET, BY APPLICATION, 2019–2027 ($MILLION)
TABLE 21.MEXICO SMART RETAIL DEVICES MARKET, BY TECHNOLOGY, 2019–2027 ($MILLION)
TABLE 22.MEXICO SMART RETAIL DEVICES MARKET, BY APPLICATION, 2019–2027 ($MILLION)
TABLE 23.EUROPE SMART RETAIL DEVICES MARKET, BY TECHNOLOGY, 2019–2027 ($MILLION)
TABLE 24.EUROPE SMART RETAIL DEVICES MARKET, BY APPLICATION, 2019–2027 ($MILLION)
TABLE 25.UK SMART RETAIL DEVICES MARKET, BY TECHNOLOGY, 2019–2027 ($MILLION)
TABLE 26.UK SMART RETAIL DEVICES MARKET, BY APPLICATION, 2019–2027 ($MILLION)
TABLE 27.GERMANY SMART RETAIL DEVICES MARKET, BY TECHNOLOGY, 2019–2027 ($MILLION)
TABLE 28.GERMANY SMART RETAIL DEVICES MARKET, BY APPLICATION, 2019–2027 ($MILLION)
TABLE 29.FRANCE SMART RETAIL DEVICES MARKET, BY TECHNOLOGY, 2019–2027 ($MILLION)
TABLE 30.FRANCE SMART RETAIL DEVICES MARKET, BY APPLICATION, 2019–2027 ($MILLION)
TABLE 31.ITALY SMART RETAIL DEVICES MARKET, BY TECHNOLOGY, 2019–2027 ($MILLION)
TABLE 32.ITALY SMART RETAIL DEVICES MARKET, BY APPLICATION, 2019–2027 ($MILLION)
TABLE 33.REST OF EUROPE SMART RETAIL DEVICES MARKET, BY TECHNOLOGY, 2019–2027 ($MILLION)
TABLE 34.REST OF EUROPE SMART RETAIL DEVICES MARKET, BY APPLICATION, 2019–2027 ($MILLION)
TABLE 35.ASIA-PACIFIC SMART RETAIL DEVICES MARKET, BY TECHNOLOGY, 2019–2027 ($MILLION)
TABLE 36.ASIA-PACIFIC SMART RETAIL DEVICES MARKET, BY APPLICATION, 2019–2027 ($MILLION)
TABLE 37.CHINA SMART RETAIL DEVICES MARKET, BY TECHNOLOGY, 2019–2027 ($MILLION)
TABLE 38.CHINA SMART RETAIL DEVICES MARKET, BY APPLICATION, 2019–2027 ($MILLION)
TABLE 39.JAPAN SMART RETAIL DEVICES MARKET, BY TECHNOLOGY, 2019–2027 ($MILLION)
TABLE 40.JAPAN SMART RETAIL DEVICES MARKET, BY APPLICATION, 2019–2027 ($MILLION)
TABLE 41.INDIA SMART RETAIL DEVICES MARKET, BY TECHNOLOGY, 2019–2027 ($MILLION)
TABLE 42.INDIA SMART RETAIL DEVICES MARKET, BY APPLICATION, 2019–2027 ($MILLION)
TABLE 43.AUSTRALIA SMART RETAIL DEVICES MARKET, BY TECHNOLOGY, 2019–2027 ($MILLION)
TABLE 44.AUSTRALIA SMART RETAIL DEVICES MARKET, BY APPLICATION, 2019–2027 ($MILLION)
TABLE 45.REST OF ASIA-PACIFIC SMART RETAIL DEVICES MARKET, BY TECHNOLOGY, 2019–2027 ($MILLION)
TABLE 46.REST OF ASIA-PACIFIC SMART RETAIL DEVICES MARKET, BY APPLICATION, 2019–2027 ($MILLION)
TABLE 47.LAMEA SMART RETAIL DEVICES MARKET, BY TECHNOLOGY, 2019–2027 ($MILLION)
TABLE 48.LAMEA SMART RETAIL DEVICES MARKET, BY APPLICATION, 2019–2027 ($MILLION)
TABLE 49.LATIN AMERICA SMART RETAIL DEVICES MARKET, BY TECHNOLOGY, 2019–2027 ($MILLION)
TABLE 50.LATIN AMERICA SMART RETAIL DEVICES MARKET, BY APPLICATION, 2019–2027 ($MILLION)
TABLE 51.MIDDLE EAST SMART RETAIL DEVICES MARKET, BY TECHNOLOGY, 2019–2027 ($MILLION)
TABLE 52.MIDDLE EAST SMART RETAIL DEVICES MARKET, BY APPLICATION, 2019–2027 ($MILLION)
TABLE 53.AFRICA. SMART RETAIL DEVICES MARKET, BY TECHNOLOGY, 2019–2027 ($MILLION)
TABLE 54.AFRICA SMART RETAIL DEVICES MARKET, BY APPLICATION, 2019–2027 ($MILLION)
TABLE 55.IBM: COMPANY SNAPSHOT
TABLE 56.IBM: OPERATING SEGMENTS
TABLE 57.IBM: PRODUCT PORTFOLIO
TABLE 58.COMPANY SNAPSHOT
TABLE 59.INTEL: OPERATING SEGMENTS
TABLE 60.INTEL: PRODUCT PORTFOLIO
TABLE 61.COMPANY SNAPSHOT
TABLE 62.NXP: PRODUCT PORTFOLIO
TABLE 63.CISCO: KEY EXECUTIVES
TABLE 64.CISCO: COMPANY SNAPSHOT
TABLE 65.CISCO: PRODUCT PORTFOLIO
TABLE 66.MICROSOFT.: KEY EXECUTIVES
TABLE 67.MICROSOFT: COMPANY SNAPSHOT
TABLE 68.MICROSOFT: PRODUCT PORTFOLIO
TABLE 69.MICROSOFT: KEY STRATEGIC MOVES AND DEVELOPMENTS
TABLE 70.NVIDIA CORPORATION: KEY EXECUTIVES
TABLE 71.NVIDIA CORPORATION: COMPANY SNAPSHOT
TABLE 72.NVIDIA CORPORATION: PRODUCT PORTFOLIO
TABLE 73.SAMSUNG ELECTRONICS: COMPANY SNAPSHOT
TABLE 74.SAMSUNG ELECTRONICS: OPERATING SEGMENTS
TABLE 75.SAMSUNG ELECTRONICS: PRODUCT PORTFOLIO
TABLE 76.SAMSUNG ELECTRONICS: KEY STRATEGIC MOVES AND DEVELOPMENTS
TABLE 77.TI: KEY EXECUTIVES
TABLE 78.TI: COMPANY SNAPSHOT
TABLE 79.TI: OPERATING SEGMENTS
TABLE 80.TI: PRODUCT PORTFOLIO
TABLE 81.SOFTBANKS ROBOTICS: COMPANY SNAPSHOT
TABLE 82.SOFTBANKS ROBOTICS: OPERATING SEGMENTS
TABLE 83.SOFTBANKS ROBOTICS: PRODUCT PORTFOLIO
TABLE 84.PAX: COMPANY SNAPSHOT
TABLE 85.PAX: OPERATING SEGMENTS
TABLE 86.PAX: PRODUCT PORTFOLIO
TABLE 87.PAX: KEY STRATEGIC MOVES AND DEVELOPMENTS LIST OF FIGURES

FIGURE 01.KEY MARKET SEGMENTS
FIGURE 02.EXECUTIVE SUMMARY, BY SEGMENTATION
FIGURE 03.EXECUTIVE SUMMARY, BY REGION
FIGURE 04.TOP IMPACTING FACTORS
FIGURE 05.TOP INVESTMENT POCKETS
FIGURE 06.MODERATE TO HIGH BARGAINING POWER OF SUPPLIERS
FIGURE 07.MODERATE THREAT OF NEW ENTRANTS
FIGURE 08.HIGH THREAT OF SUBSTITUTES
FIGURE 09.HIGH INTENSITY OF RIVALRY
FIGURE 10.MODERATE TO HIGH BARGAINING POWER OF BUYERS
FIGURE 11.PATENT ANALYSIS, BY COUNTRY
FIGURE 12.PATENT ANALYSIS, BY APPLICANT
FIGURE 13.GLOBAL SMART RETAIL DEVICES MARKET SHARE, BY TECHNOLOGY, 2019–2027 (%)
FIGURE 14.GLOBAL SMART RETAIL DEVICES MARKET, BY TECHNOLOGY, 2019-2027 ($MILLION)
FIGURE 15.COMPARATIVE SHARE ANALYSIS SMART RETAIL DEVICES MARKET FOR DIGITAL SIGNAGE, BY COUNTRY, 2019 & 2027 (%)
FIGURE 16.COMPARATIVE SHARE ANALYSIS SMART RETAIL DEVICES MARKET FOR SMART LABELS, BY COUNTRY, 2019 & 2027 (%)
FIGURE 17.COMPARATIVE SHARE ANALYSIS SMART RETAIL DEVICES MARKET FOR SMART PAYMENTS, BY COUNTRY, 2019 & 2027 (%)
FIGURE 18.COMPARATIVE SHARE ANALYSIS SMART RETAIL DEVICES MARKET FOR SMART CARTS, BY COUNTRY, 2019 & 2027 (%)
FIGURE 19.COMPARATIVE SHARE ANALYSIS SMART RETAIL DEVICES MARKET FOR ELECTRONIC SHELF LABELS, BY COUNTRY, 2019 & 2027 (%)
FIGURE 20.COMPARATIVE SHARE ANALYSIS SMART RETAIL DEVICES MARKET FOR OTHERS, BY COUNTRY, 2019 & 2027 (%)
FIGURE 21.GLOBAL SMART RETAIL DEVICES MARKET SHARE, BY APPLICATION, 2019–2027 (%)
FIGURE 22.COMPARATIVE SHARE ANALYSIS OF SMART RETAIL DEVICES MARKET FOR SMART TRANSPORTATION, BY COUNTRY, 2019 & 2027 (%)
FIGURE 23.COMPARATIVE SHARE ANALYSIS OF SMART RETAIL DEVICES MARKET FOR PREDICTIVE EQUIPMENT MAINTENANCE, BY COUNTRY, 2019 & 2027 (%)
FIGURE 24.COMPARATIVE SHARE ANALYSIS OF SMART RETAIL DEVICES MARKET FOR INVENTORY MANAGEMENT, BY COUNTRY, 2019 & 2027 (%)
FIGURE 25.COMPARATIVE SHARE ANALYSIS OF SMART RETAIL DEVICES MARKET FOR SMART FITTING ROOM, BY COUNTRY, 2019 & 2027 (%)
FIGURE 26.COMPARATIVE SHARE ANALYSIS OF SMART RETAIL DEVICES MARKET FOR FOOT TRAFFIC MONITORING, BY COUNTRY, 2019 & 2027 (%)
FIGURE 27.COMPARATIVE SHARE ANALYSIS OF SMART RETAIL DEVICES MARKET FOR OTHERS, BY COUNTRY, 2019 & 2027 (%)
FIGURE 28.SMART RETAIL DEVICES MARKET, BY REGION, 2019-2027 (%)
FIGURE 29.COMPARATIVE SHARE ANALYSIS OF NORTH AMERICA SMART RETAIL DEVICES MARKET, BY COUNTRY, 2019–2027 (%)
FIGURE 30.U.S. SMART RETAIL DEVICES MARKET, 2019–2027 ($MILLION)
FIGURE 31.CANADA SMART RETAIL DEVICES MARKET, 2019–2027 ($MILLION)
FIGURE 32.MEXICO SMART RETAIL DEVICES MARKET, 2019–2027 ($MILLION)
FIGURE 33.COMPARATIVE SHARE ANALYSIS OF EUROPE SMART RETAIL DEVICES MARKET, BY COUNTRY, 2019–2027 (%)
FIGURE 34.UK SMART RETAIL DEVICES MARKET, 2019–2027 ($MILLION)
FIGURE 35.GERMANY SMART RETAIL DEVICES MARKET, 2019–2027 ($MILLION)
FIGURE 36.FRANCE SMART RETAIL DEVICES MARKET, 2019–2027 ($MILLION)
FIGURE 37.ITALY SMART RETAIL DEVICES MARKET, 2019–2027 ($MILLION)
FIGURE 38.REST OF EUROPE SMART RETAIL DEVICES MARKET, 2019–2027 ($MILLION)
FIGURE 39.COMPARATIVE SHARE ANALYSIS OF ASIA-PACIFIC SMART RETAIL DEVICES MARKET, BY COUNTRY, 2019–2027 (%)
FIGURE 40.CHINA SMART RETAIL DEVICES MARKET, 2019–2027 ($MILLION)
FIGURE 41.JAPAN SMART RETAIL DEVICES MARKET, 2019–2027 ($MILLION)
FIGURE 42.INDIA SMART RETAIL DEVICES MARKET, 2019–2027 ($MILLION)
FIGURE 43.AUSTRALIA SMART RETAIL DEVICES MARKET, 2019–2027 ($MILLION)
FIGURE 44.REST OF ASIA-PACIFIC SMART RETAIL DEVICES MARKET, 2019–2027 ($MILLION)
FIGURE 45.COMPARATIVE SHARE ANALYSIS OF LAMEA SMART RETAIL DEVICES MARKET, BY COUNTRY, 2019–2027 (%)
FIGURE 46.LATIN AMERICA SMART RETAIL DEVICES MARKET, 2019–2027 ($MILLION)
FIGURE 47.MIDDLE EAST SMART RETAIL DEVICES MARKET, 2019–2027 ($MILLION)
FIGURE 48.AFRICA SMART RETAIL DEVICES MARKET, 2019–2027 ($MILLION)
FIGURE 49.MARKET PLAYER POSITIONING, 2019
FIGURE 50.TOP WINNING STRATEGIES, BY YEAR, 2017–2020
FIGURE 51.TOP WINNING STRATEGIES, BY DEVELOPMENT, 2017–2020 (%)
FIGURE 52.TOP WINNING STRATEGIES, BY COMPANY, 2017–2020
FIGURE 53.COMPETITIVE DASHBOARD
FIGURE 54.COMPETITIVE DASHBOARD
FIGURE 55.COMPETITIVE HEATMAP OF KEY PLAYERS
FIGURE 56.IBM: R&D EXPENDITURE, 2016–2018 ($MILLION)
FIGURE 57.IBM: NET SALES, 2016–2018 ($MILLION)
FIGURE 58.IBM: REVENUE SHARE BY SEGMENT, 2018 (%)
FIGURE 59.IBM: REVENUE SHARE, BY REGION, 2018 (%)
FIGURE 60.INTEL: R&D EXPENDITURE, 2017–2019 ($MILLION)
FIGURE 61.INTEL: NET SALES, 2017–2019 ($MILLION)
FIGURE 62.INTEL: REVENUE SHARE BY SEGMENT, 2019 (%)
FIGURE 63.INTEL: REVENUE SHARE BY REGION, 2019 (%)
FIGURE 64.NXP: R&D EXPENDITURE, 2017–2019 ($MILLION)
FIGURE 65.NXP: NET SALES, 2016–2018 ($MILLION)
FIGURE 66.NXP: REVENUE SHARE BY SEGMENT, 2019 (%)
FIGURE 67.NXP: REVENUE SHARE, BY REGION, 2019 (%)
FIGURE 68.R&D EXPENDITURE, 2017–2019 ($MILLION)
FIGURE 69.MICROSOFT: REVENUE, 2017–2019 ($MILLION)
FIGURE 70.MICROSOFT: REVENUE SHARE BY REGION, 2019 (%)
FIGURE 71.R&D EXPENDITURE, 2017–2019 ($MILLION)
FIGURE 72.NVIDIA CORPORATION.: REVENUE, 2017–2019 ($MILLION)
FIGURE 73.NVIDIA CORPORATION.: REVENUE SHARE BY REGION, 2019 (%)
FIGURE 74.SAMSUNG ELECTRONICS: R&D EXPENDITURE, 2017–2019 ($MILLION)
FIGURE 75.SAMSUNG ELECTRONICS: NET SALES, 2017–2019 ($MILLION)
FIGURE 76.SAMSUNG ELECTRONICS: REVENUE SHARE BY SEGMENT, 2019 (%)
FIGURE 77.SAMSUNG ELECTRONICS: REVENUE SHARE BY REGION, 2019 (%)
FIGURE 78.R&D EXPENDITURE, 2017–2019 ($MILLION)
FIGURE 79.TI: REVENUE, 2017–2019 ($MILLION)
FIGURE 80.TI: REVENUE SHARE BY SEGMENT, 2019 (%)
FIGURE 81.TI: REVENUE SHARE BY REGION, 2019 (%)
FIGURE 82.SOFTBANKS ROBOTICS: R&D EXPENDITURE, 2017–2019 ($MILLION)
FIGURE 83.SOFTBANKS ROBOTICS: NET SALES, 2017–2019 ($MILLION)
FIGURE 84.SOFTBANKS ROBOTICS: REVENUE SHARE BY SEGMENT, 2019 (%)
FIGURE 85.SOFTBANKS ROBOTICS: REVENUE SHARE, BY REGION, 2019 (%)
FIGURE 86.PAX: NET SALES, 2017–2019 ($MILLION)
FIGURE 87.PAX: REVENUE SHARE BY SEGMENT, 2019 (%)
FIGURE 88.PAX: REVENUE SHARE BY REGION, 2019 (%)

SELECT A FORMAT
Added to Cart
Electronic (PDF)

$5769

This license allows only one user to access the PDF.
Electronic (PDF)

$6450

This license allows 1 - 5 user to access the PDF, license is suitable for small groups of 5 users working together
Electronic (PDF)

$8995

This license allows users/teams in a same Enterprise to use this report, various departments within an enterpise can use this report
Electronic (PDF)

$3840

This license just provides quantitative data in a excel sheet
Add to Cart
Buy Now (15% Discount)

OUR CUSTOMER

Lukasiewicz Research Network

SIMILAR REPORTS


RELATED REPORTS

Global Epidermic Toner Market Research Report 2024

120 Pages
Type: Report
Code: QYRE-Auto-6P8642
Wed Apr 17 00:00:00 UTC 2024

Add to Cart

Global DOD Inkjet Printer Market Research Report 2024

120 Pages
Type: Report
Code: QYRE-Auto-25O8228
Wed Apr 17 00:00:00 UTC 2024

Add to Cart

Global Resin 3D Printer Market Research Report 2024

120 Pages
Type: Report
Code: QYRE-Auto-10L8407
Wed Apr 17 00:00:00 UTC 2024

Add to Cart

Global E-Commerce Fitness Products Market Research Report 2024

120 Pages
Type: Report
Code: QYRE-Auto-38S8256
Wed Apr 17 00:00:00 UTC 2024

Add to Cart