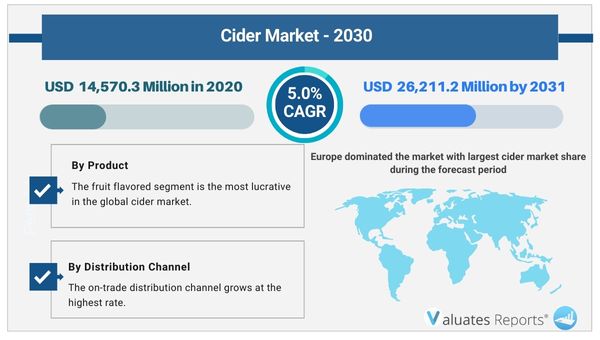
The global cider market size was valued at $14,570.3 million in 2020 and is projected to reach $26,211.2 million by 2031, registering a CAGR of 5.0% from 2022 to 2031.
Two major factors that are projected to fuel the cider market expansion over the forecast period are alcohol consumption as a status symbol and the rise in demand for premium spirits as a result of rising per capita income. Due to rising health risks, concerns about alcohol consumption, and the appeal of non-alcoholic beverages, the global cider market has grown.
The impact of COVID-19 pandemic on the global cider market was moderate in nature. The supply chain disruption due to trade and lockdown restrictions had negative impact on the market. On the other hand, the rise in penetration of online sales channel had positive impact on the market. People were able to buy products through e-commerce sales channel, which resulted into significant opportunities for the growth of the market.
Cider is a low alcohol drink produced by partial or complete fermentation of apple juices, pear juices, and other fruit juices. The alcoholic content of the beverage ranges from 1.2% to 8.5% alcohol by volume (ABV). Moreover, ciders can be still or carbonated based upon secondary fermentation and carbon dioxide injection. Currently, the market registers the highest growth rates as compared to other alcoholic drinks in different regions, globally.
According to global cider market analysis, the global market is segmented based on type, distribution channel, packaging, and region. On the basis of type, the market is classified into apple flavored, fruit flavored, and perry. On the basis of packaging, the market is segmented into draught, cans, glass bottles, plastic bottles, and others. On the basis of distribution channel, it is categorized into on-trade and off-trade. The off-trade segment is further divided into supermarkets & hypermarkets, specialist retailers, convenience stores, and others, on global level. On the basis of region, the market is analyzed across North America, Europe, Asia-Pacific, and LAMEA.
The demand for craft beverages has exploded throughout the course of the projected period, and one of this industry's fastest-growing divisions is the hard cider sector. In order to become a more popular beverage, cider hopes to take advantage of customer demand for gluten-free choices and increased interest in alternative beverages. Millennial beer enthusiasts who prefer alcoholic beverages with sweet and distinctive flavor characteristics really enjoy Hard Cider, a craft beer market. The cider market is anticipated to be driven by this aspect.
Because it has a number of health benefits, cider is more than just a tasty beverage. Cider appeals to customers looking for a healthier alcohol option, but for those attempting to limit their alcohol use, THC-infused ciders provide an intriguing brand-new option. Non-alcoholic beers have undergone enormous changes since their introduction. As more people cut back or stop drinking entirely for health and other reasons, the industry is responding by offering a greater choice of products with little to no alcohol. The cider market is then anticipated to benefit from this.
In addition, the canned cider market is anticipated to grow. Can weigh less than bottles, which results in significant transportation cost savings. Currently, a producer has access to markets outside of their city, state, or possibly even country! The key factors driving demand are the eco-conscious millennial demographic and expanded use scenarios including camping, athletic events, festivals, and other outdoor settings.
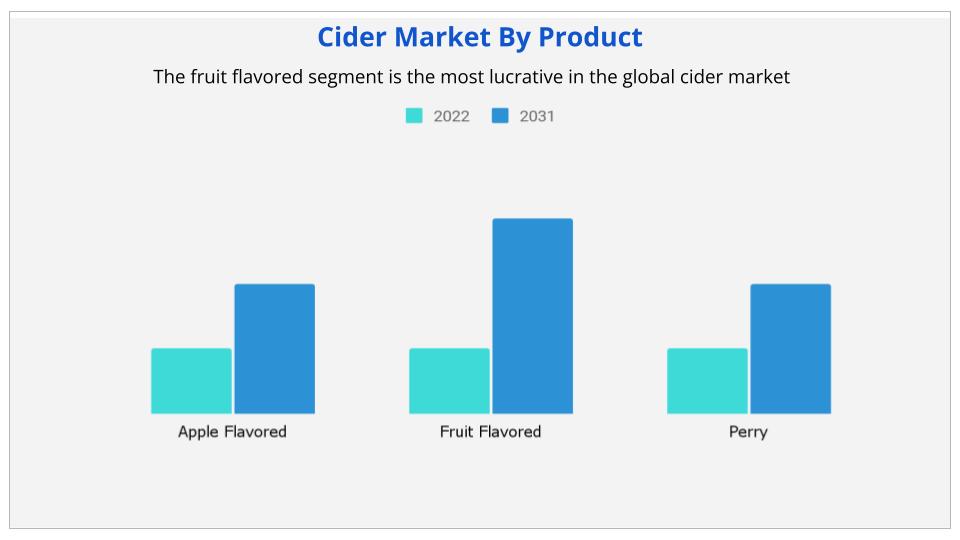
The fruit flavored segment is the most lucrative in the global cider market, owing to the varieties available and innovations done by different manufacturers to attract customers. Moreover, people are concerned about their health and prefer low alcohol & gluten-free beverages, which augments the demand for cider in the global market. In addition, the presence of various popular brands such as Kopparberg, Woodchuck, and Angry Orchard boosts the expansion of premium quality cider. The market is more concentrated in Europe and grows rapidly in North America. Developing regions of Asia-Pacific and LAMEA are anticipated to provide great opportunities to the market during the forecast period.
Cider is either supplied on draft to on-trade distribution channels or packaged in cans or bottles of six packs, four packs, and singles for sale in different off-trade distribution channels. The different cider packaging considered in this report include draught, cans, glass bottles, plastic bottles, and others, majorly including bag in box.
Based on packaging, The cans market is anticipated to be the most profitable. The demand for luxury beverages and artisan branding contribute to the growth of ciders. Glass takes longer to cool than cans, which encourages the market's sustainable growth. Cans are also eternally recyclable.
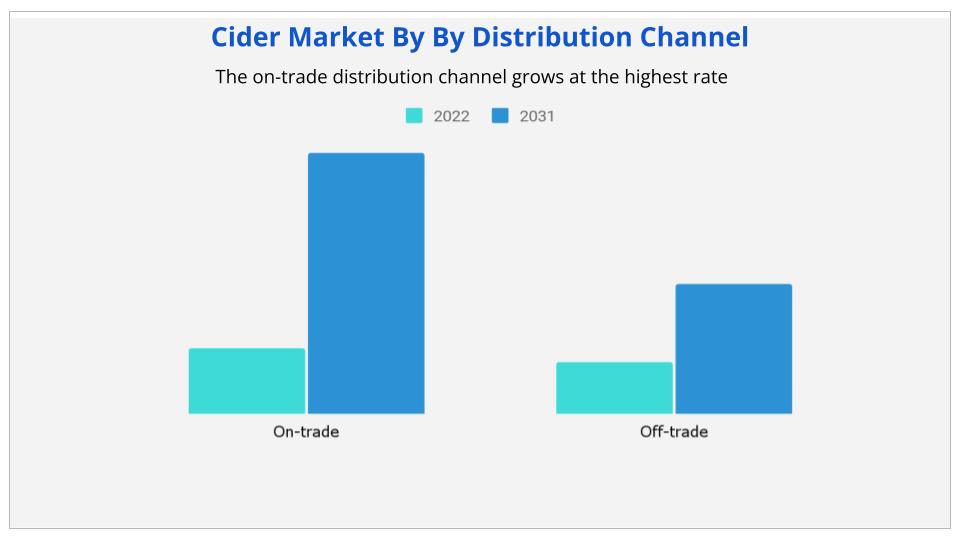
Based on the Distribution Channel, The distribution channel for goods sold on the open market is growing most quickly. This is because pubs and bars are growing and because emerging economies have more discretionary income.
Consumers purchase cider by two channels, that is, on-trade, including bars, pubs, and restaurants for immediate consumption and as off-trade, including supermarkets & hypermarkets, specialist retailers, convenience stores, and others for residential consumption. The on-trade distribution channel grows at the highest rate, owing to the increase in pubs & bars and the rise in disposable income of emerging economies.
Based on region, With the largest cider market share during the projection period, Europe dominated the market. Ciders and their many variations are the most consumed alcoholic beverages in Europe, particularly in the UK. Different cider flavors are preferred differently due to distinct geographic areas. However, alcohol usage is a common practice because of the colder climate in most of Europe.
In alcoholic beverages, consumers are increasingly valuing tradition, quality and innovation. The increase in demand for premium spirits due to the rise in per capita income and alcohol consumption as a status symbol are major factors that are expected to drive the growth of the market during the forecast period.
The major players analyzed for the cider industry are Anheuser-Busch Companies LLC, Asahi Premium Beverages, Aston Manor, C&C Group plc, Carlsberg Breweries A/S, Carlton & United Breweries (CUB), Distell, Halewood, Heineken UK Limited, and The Boston Beer Company.
Key Benefits For Stakeholders
KEY MARKET SEGMENTS
By Product
By Distribution Channel
By Packaging
By Region
|
Report Metric |
Details |
|
Base Year: |
2021 |
|
Market Size in 2020: |
USD 14,570.3 Million |
|
Forecast Period: |
2022 to 2031 |
|
Forecast Period 2022 to 2031 CAGR: |
5.0% |
|
2031 Value Projection: |
USD 26,211.2 Million |
|
No. of Pages: |
230 |
|
Tables & Figures |
58 |
|
Charts |
127 |
|
Segments covered: |
By Type, By Distribution Channel, By Packaging, and By Region. |
Ans. The global cider market size was valued at $14,570.3 million in 2020 and is projected to reach $26,211.2 million by 2031, registering a CAGR of 5.0% from 2022 to 2031.
Ans. The global Cider market value was valued at US$ 14,570.3 million in 2020.
Ans. Europe dominated the market with largest cider market share during the forecast period.
Ans. The forecast period considered for the global Cider market is 2022 to 2031.
Ans. The fruit flavored segment is the most lucrative in the global cider market, owing to the varieties available and innovations done by different manufacturers to attract customers.
CHAPTER 1:INTRODUCTION
1.1.Report Description
1.2.Key Market Segments
1.3.Key Benefits
1.4.Research Methodology
1.4.1. Primary Research
1.4.2. Secondary Research
1.4.3. Analyst Tools and Models
CHAPTER 2:EXECUTIVE SUMMARY
2.1.CXO Perspective
CHAPTER 3:MARKET LANDSCAPE
3.1.Market Definition and Scope
3.2.Key Findings
3.2.1. Top Investment Pockets
3.2.2. Top Winning Strategies
3.3.Porter's Five Forces Analysis
3.3.1. Bargaining Power of Suppliers
3.3.2. Threat of New Entrants
3.3.3. Threat of Substitutes
3.3.4. Competitive Rivalry
3.3.5. Bargaining Power among Buyers
3.4.Market Share Analysis/Top Player Positioning
3.4.1. Market Share Analysis/Top Player Positioning 2020
3.5.Market Dynamics
3.5.1. Drivers
3.5.2. Restraints
3.5.3. Opportunities
3.6.COVID-19 Impact Analysis
3.7. Patent landscape
3.8.Market Share Analysis
3.9.Competitive Heatmap
3.10.Technology Landscape
3.11.Strategic Overview
CHAPTER 4:CIDER MARKET, BY TYPE
4.1.Market Overview
4.1.1Market Size and Forecast, By Type
4.2. Apple Flavored
4.2.1. Key Market Trends, Growth Factors and Opportunities
4.2.2. Market Size and Forecast, By Region
4.2.3. Market Share Analysis, By Country
4.3. Fruit Flavored
4.3.1. Key Market Trends, Growth Factors and Opportunities
4.3.2. Market Size and Forecast, By Region
4.3.3. Market Share Analysis, By Country
4.4. Perry
4.4.1. Key Market Trends, Growth Factors and Opportunities
4.4.2. Market Size and Forecast, By Region
4.4.3. Market Share Analysis, By Country
CHAPTER 5:CIDER MARKET, BY PACKAGING
5.1.Market Overview
5.1.1Market Size and Forecast, By Packaging
5.2. Draught
5.2.1. Key Market Trends, Growth Factors and Opportunities
5.2.2. Market Size and Forecast, By Region
5.2.3. Market Share Analysis, By Country
5.3. Cans
5.3.1. Key Market Trends, Growth Factors and Opportunities
5.3.2. Market Size and Forecast, By Region
5.3.3. Market Share Analysis, By Country
5.4. Glass Bottle
5.4.1. Key Market Trends, Growth Factors and Opportunities
5.4.2. Market Size and Forecast, By Region
5.4.3. Market Share Analysis, By Country
5.5. Plastic Bottle
5.5.1. Key Market Trends, Growth Factors and Opportunities
5.5.2. Market Size and Forecast, By Region
5.5.3. Market Share Analysis, By Country
5.6. Others
5.6.1. Key Market Trends, Growth Factors and Opportunities
5.6.2. Market Size and Forecast, By Region
5.6.3. Market Share Analysis, By Country
CHAPTER 6:CIDER MARKET, BY DISTRIBUTION CHANNEL
6.1.Market Overview
6.1.1Market Size and Forecast, By Distribution Channel
6.2. On-trade
6.2.1. Key Market Trends, Growth Factors and Opportunities
6.2.2. Market Size and Forecast, By Region
6.2.3. Market Share Analysis, By Country
6.3. Off-trade
6.3.1. Key Market Trends, Growth Factors and Opportunities
6.3.2. Market Size and Forecast, By Region
6.3.3. Market Share Analysis, By Country
CHAPTER 7:CIDER MARKET, BY REGION
7.1.Market Overview
7.1.1Market Size and Forecast, By Region
7.2.North America
7.2.1. Key Market Trends and Opportunities
7.2.2. Market Size and Forecast, By Type
7.2.3. Market Size and Forecast, By Packaging
7.2.4. Market Size and Forecast, By Distribution Channel
7.2.5. Market Size and Forecast, By Country
7.2.6. U.s. Cider Market
7.2.6.1. Market Size and Forecast, By Type
7.2.6.2. Market Size and Forecast, By Packaging
7.2.6.3. Market Size and Forecast, By Distribution Channel
7.2.7. Canada Cider Market
7.2.7.1. Market Size and Forecast, By Type
7.2.7.2. Market Size and Forecast, By Packaging
7.2.7.3. Market Size and Forecast, By Distribution Channel
7.2.8. Mexico Cider Market
7.2.8.1. Market Size and Forecast, By Type
7.2.8.2. Market Size and Forecast, By Packaging
7.2.8.3. Market Size and Forecast, By Distribution Channel
7.3.Europe
7.3.1. Key Market Trends and Opportunities
7.3.2. Market Size and Forecast, By Type
7.3.3. Market Size and Forecast, By Packaging
7.3.4. Market Size and Forecast, By Distribution Channel
7.3.5. Market Size and Forecast, By Country
7.3.6. Uk Cider Market
7.3.6.1. Market Size and Forecast, By Type
7.3.6.2. Market Size and Forecast, By Packaging
7.3.6.3. Market Size and Forecast, By Distribution Channel
7.3.7. Germany Cider Market
7.3.7.1. Market Size and Forecast, By Type
7.3.7.2. Market Size and Forecast, By Packaging
7.3.7.3. Market Size and Forecast, By Distribution Channel
7.3.8. France Cider Market
7.3.8.1. Market Size and Forecast, By Type
7.3.8.2. Market Size and Forecast, By Packaging
7.3.8.3. Market Size and Forecast, By Distribution Channel
7.3.9. Italy Cider Market
7.3.9.1. Market Size and Forecast, By Type
7.3.9.2. Market Size and Forecast, By Packaging
7.3.9.3. Market Size and Forecast, By Distribution Channel
7.3.10. Spain Cider Market
7.3.10.1. Market Size and Forecast, By Type
7.3.10.2. Market Size and Forecast, By Packaging
7.3.10.3. Market Size and Forecast, By Distribution Channel
7.3.11. Rest Of Europe Cider Market
7.3.11.1. Market Size and Forecast, By Type
7.3.11.2. Market Size and Forecast, By Packaging
7.3.11.3. Market Size and Forecast, By Distribution Channel
7.4.Asia-Pacific
7.4.1. Key Market Trends and Opportunities
7.4.2. Market Size and Forecast, By Type
7.4.3. Market Size and Forecast, By Packaging
7.4.4. Market Size and Forecast, By Distribution Channel
7.4.5. Market Size and Forecast, By Country
7.4.6. China Cider Market
7.4.6.1. Market Size and Forecast, By Type
7.4.6.2. Market Size and Forecast, By Packaging
7.4.6.3. Market Size and Forecast, By Distribution Channel
7.4.7. India Cider Market
7.4.7.1. Market Size and Forecast, By Type
7.4.7.2. Market Size and Forecast, By Packaging
7.4.7.3. Market Size and Forecast, By Distribution Channel
7.4.8. Australia Cider Market
7.4.8.1. Market Size and Forecast, By Type
7.4.8.2. Market Size and Forecast, By Packaging
7.4.8.3. Market Size and Forecast, By Distribution Channel
7.4.9. Thailand Cider Market
7.4.9.1. Market Size and Forecast, By Type
7.4.9.2. Market Size and Forecast, By Packaging
7.4.9.3. Market Size and Forecast, By Distribution Channel
7.4.10. Rest of Asia Pacific Cider Market
7.4.10.1. Market Size and Forecast, By Type
7.4.10.2. Market Size and Forecast, By Packaging
7.4.10.3. Market Size and Forecast, By Distribution Channel
7.5.LAMEA
7.5.1. Key Market Trends and Opportunities
7.5.2. Market Size and Forecast, By Type
7.5.3. Market Size and Forecast, By Packaging
7.5.4. Market Size and Forecast, By Distribution Channel
7.5.5. Market Size and Forecast, By Country
7.5.6. Latin America Cider Market
7.5.6.1. Market Size and Forecast, By Type
7.5.6.2. Market Size and Forecast, By Packaging
7.5.6.3. Market Size and Forecast, By Distribution Channel
7.5.7. Middle East Cider Market
7.5.7.1. Market Size and Forecast, By Type
7.5.7.2. Market Size and Forecast, By Packaging
7.5.7.3. Market Size and Forecast, By Distribution Channel
7.5.8. Africa Cider Market
7.5.8.1. Market Size and Forecast, By Type
7.5.8.2. Market Size and Forecast, By Packaging
7.5.8.3. Market Size and Forecast, By Distribution Channel
CHAPTER 8:COMPANY PROFILES
8.1. Anheuser-Busch Companies LLC
8.1.1.Company Overview
8.1.2.Key Executives
8.1.3.Company snapshot
8.1.4.Operating business segments
8.1.5.Product portfolio
8.1.6.Business Performance
8.1.7.Key Strategic Moves and Developments
8.2. Asahi Premium Beverages
8.2.1.Company Overview
8.2.2.Key Executives
8.2.3.Company snapshot
8.2.4.Operating business segments
8.2.5.Product portfolio
8.2.6.Business Performance
8.2.7.Key Strategic Moves and Developments
8.3. Aston Manor
8.3.1.Company Overview
8.3.2.Key Executives
8.3.3.Company snapshot
8.3.4.Operating business segments
8.3.5.Product portfolio
8.3.6.Business Performance
8.3.7.Key Strategic Moves and Developments
8.4. CAndC Group Plc
8.4.1.Company Overview
8.4.2.Key Executives
8.4.3.Company snapshot
8.4.4.Operating business segments
8.4.5.Product portfolio
8.4.6.Business Performance
8.4.7.Key Strategic Moves and Developments
8.5. Carlsberg Breweries A/S
8.5.1.Company Overview
8.5.2.Key Executives
8.5.3.Company snapshot
8.5.4.Operating business segments
8.5.5.Product portfolio
8.5.6.Business Performance
8.5.7.Key Strategic Moves and Developments
8.6. Carlton And United Breweries (CUB)
8.6.1.Company Overview
8.6.2.Key Executives
8.6.3.Company snapshot
8.6.4.Operating business segments
8.6.5.Product portfolio
8.6.6.Business Performance
8.6.7.Key Strategic Moves and Developments
8.7. Distell
8.7.1.Company Overview
8.7.2.Key Executives
8.7.3.Company snapshot
8.7.4.Operating business segments
8.7.5.Product portfolio
8.7.6.Business Performance
8.7.7.Key Strategic Moves and Developments
8.8. Halewood
8.8.1.Company Overview
8.8.2.Key Executives
8.8.3.Company snapshot
8.8.4.Operating business segments
8.8.5.Product portfolio
8.8.6.Business Performance
8.8.7.Key Strategic Moves and Developments
8.9. Heineken UK Limited
8.9.1.Company Overview
8.9.2.Key Executives
8.9.3.Company snapshot
8.9.4.Operating business segments
8.9.5.Product portfolio
8.9.6.Business Performance
8.9.7.Key Strategic Moves and Developments
8.10. The Boston Beer Company
8.10.1.Company Overview
8.10.2.Key Executives
8.10.3.Company snapshot
8.10.4.Operating business segments
8.10.5.Product portfolio
8.10.6.Business Performance
8.10.7.Key Strategic Moves and Developments
LIST OF TABLES
TABLE 1.GLOBAL CIDER MARKET, BY TYPE, 2020-2031 ($MILLION)
TABLE 2.GLOBAL CIDER MARKET FOR APPLE FLAVORED, BY REGION, 2020-2031 ($MILLION)
TABLE 3.GLOBAL CIDER MARKET FOR FRUIT FLAVORED, BY REGION, 2020-2031 ($MILLION)
TABLE 4.GLOBAL CIDER MARKET FOR PERRY, BY REGION, 2020-2031 ($MILLION)
TABLE 5.GLOBAL CIDER MARKET, BY PACKAGING, 2020-2031 ($MILLION)
TABLE 6.GLOBAL CIDER MARKET FOR DRAUGHT, BY REGION, 2020-2031 ($MILLION)
TABLE 7.GLOBAL CIDER MARKET FOR CANS, BY REGION, 2020-2031 ($MILLION)
TABLE 8.GLOBAL CIDER MARKET FOR GLASS BOTTLE, BY REGION, 2020-2031 ($MILLION)
TABLE 9.GLOBAL CIDER MARKET FOR PLASTIC BOTTLE, BY REGION, 2020-2031 ($MILLION)
TABLE 10.GLOBAL CIDER MARKET FOR OTHERS, BY REGION, 2020-2031 ($MILLION)
TABLE 11.GLOBAL CIDER MARKET, BY DISTRIBUTION CHANNEL, 2020-2031 ($MILLION)
TABLE 12.GLOBAL CIDER MARKET FOR ON-TRADE, BY REGION, 2020-2031 ($MILLION)
TABLE 13.GLOBAL CIDER MARKET FOR OFF-TRADE, BY REGION, 2020-2031 ($MILLION)
TABLE 14.GLOBAL CIDER MARKET, BY REGION, 2020-2031 ($MILLION)
TABLE 15.NORTH AMERICA CIDER, BY TYPE, 2020-2031 ($MILLION)
TABLE 16.NORTH AMERICA CIDER, BY PACKAGING, 2020-2031 ($MILLION)
TABLE 17.NORTH AMERICA CIDER, BY DISTRIBUTION CHANNEL, 2020-2031 ($MILLION)
TABLE 18.U.S. CIDER, BY TYPE, 2020-2031 ($MILLION)
TABLE 19.U.S. CIDER, BY PACKAGING, 2020-2031 ($MILLION)
TABLE 20.U.S. CIDER, BY DISTRIBUTION CHANNEL, 2020-2031 ($MILLION)
TABLE 21.CANADA CIDER, BY TYPE, 2020-2031 ($MILLION)
TABLE 22.CANADA CIDER, BY PACKAGING, 2020-2031 ($MILLION)
TABLE 23.CANADA CIDER, BY DISTRIBUTION CHANNEL, 2020-2031 ($MILLION)
TABLE 24.MEXICO CIDER, BY TYPE, 2020-2031 ($MILLION)
TABLE 25.MEXICO CIDER, BY PACKAGING, 2020-2031 ($MILLION)
TABLE 26.MEXICO CIDER, BY DISTRIBUTION CHANNEL, 2020-2031 ($MILLION)
TABLE 27.EUROPE CIDER, BY TYPE, 2020-2031 ($MILLION)
TABLE 28.EUROPE CIDER, BY PACKAGING, 2020-2031 ($MILLION)
TABLE 29.EUROPE CIDER, BY DISTRIBUTION CHANNEL, 2020-2031 ($MILLION)
TABLE 30.UK CIDER, BY TYPE, 2020-2031 ($MILLION)
TABLE 31.UK CIDER, BY PACKAGING, 2020-2031 ($MILLION)
TABLE 32.UK CIDER, BY DISTRIBUTION CHANNEL, 2020-2031 ($MILLION)
TABLE 33.GERMANY CIDER, BY TYPE, 2020-2031 ($MILLION)
TABLE 34.GERMANY CIDER, BY PACKAGING, 2020-2031 ($MILLION)
TABLE 35.GERMANY CIDER, BY DISTRIBUTION CHANNEL, 2020-2031 ($MILLION)
TABLE 36.FRANCE CIDER, BY TYPE, 2020-2031 ($MILLION)
TABLE 37.FRANCE CIDER, BY PACKAGING, 2020-2031 ($MILLION)
TABLE 38.FRANCE CIDER, BY DISTRIBUTION CHANNEL, 2020-2031 ($MILLION)
TABLE 39.ITALY CIDER, BY TYPE, 2020-2031 ($MILLION)
TABLE 40.ITALY CIDER, BY PACKAGING, 2020-2031 ($MILLION)
TABLE 41.ITALY CIDER, BY DISTRIBUTION CHANNEL, 2020-2031 ($MILLION)
TABLE 42.SPAIN CIDER, BY TYPE, 2020-2031 ($MILLION)
TABLE 43.SPAIN CIDER, BY PACKAGING, 2020-2031 ($MILLION)
TABLE 44.SPAIN CIDER, BY DISTRIBUTION CHANNEL, 2020-2031 ($MILLION)
TABLE 45.REST OF EUROPE CIDER, BY TYPE, 2020-2031 ($MILLION)
TABLE 46.REST OF EUROPE CIDER, BY PACKAGING, 2020-2031 ($MILLION)
TABLE 47.REST OF EUROPE CIDER, BY DISTRIBUTION CHANNEL, 2020-2031 ($MILLION)
TABLE 48.ASIA-PACIFIC CIDER, BY TYPE, 2020-2031 ($MILLION)
TABLE 49.ASIA-PACIFIC CIDER, BY PACKAGING, 2020-2031 ($MILLION)
TABLE 50.ASIA-PACIFIC CIDER, BY DISTRIBUTION CHANNEL, 2020-2031 ($MILLION)
TABLE 51.CHINA CIDER, BY TYPE, 2020-2031 ($MILLION)
TABLE 52.CHINA CIDER, BY PACKAGING, 2020-2031 ($MILLION)
TABLE 53.CHINA CIDER, BY DISTRIBUTION CHANNEL, 2020-2031 ($MILLION)
TABLE 54.INDIA CIDER, BY TYPE, 2020-2031 ($MILLION)
TABLE 55.INDIA CIDER, BY PACKAGING, 2020-2031 ($MILLION)
TABLE 56.INDIA CIDER, BY DISTRIBUTION CHANNEL, 2020-2031 ($MILLION)
TABLE 57.AUSTRALIA CIDER, BY TYPE, 2020-2031 ($MILLION)
TABLE 58.AUSTRALIA CIDER, BY PACKAGING, 2020-2031 ($MILLION)
TABLE 59.AUSTRALIA CIDER, BY DISTRIBUTION CHANNEL, 2020-2031 ($MILLION)
TABLE 60.THAILAND CIDER, BY TYPE, 2020-2031 ($MILLION)
TABLE 61.THAILAND CIDER, BY PACKAGING, 2020-2031 ($MILLION)
TABLE 62.THAILAND CIDER, BY DISTRIBUTION CHANNEL, 2020-2031 ($MILLION)
TABLE 63.REST OF ASIA PACIFIC CIDER, BY TYPE, 2020-2031 ($MILLION)
TABLE 64.REST OF ASIA PACIFIC CIDER, BY PACKAGING, 2020-2031 ($MILLION)
TABLE 65.REST OF ASIA PACIFIC CIDER, BY DISTRIBUTION CHANNEL, 2020-2031 ($MILLION)
TABLE 66.LAMEA CIDER, BY TYPE, 2020-2031 ($MILLION)
TABLE 67.LAMEA CIDER, BY PACKAGING, 2020-2031 ($MILLION)
TABLE 68.LAMEA CIDER, BY DISTRIBUTION CHANNEL, 2020-2031 ($MILLION)
TABLE 69.LATIN AMERICA CIDER, BY TYPE, 2020-2031 ($MILLION)
TABLE 70.LATIN AMERICA CIDER, BY PACKAGING, 2020-2031 ($MILLION)
TABLE 71.LATIN AMERICA CIDER, BY DISTRIBUTION CHANNEL, 2020-2031 ($MILLION)
TABLE 72.MIDDLE EAST CIDER, BY TYPE, 2020-2031 ($MILLION)
TABLE 73.MIDDLE EAST CIDER, BY PACKAGING, 2020-2031 ($MILLION)
TABLE 74.MIDDLE EAST CIDER, BY DISTRIBUTION CHANNEL, 2020-2031 ($MILLION)
TABLE 75.AFRICA CIDER, BY TYPE, 2020-2031 ($MILLION)
TABLE 76.AFRICA CIDER, BY PACKAGING, 2020-2031 ($MILLION)
TABLE 77.AFRICA CIDER, BY DISTRIBUTION CHANNEL, 2020-2031 ($MILLION)
TABLE 78.ANHEUSER-BUSCH COMPANIES LLC: KEY EXECUTIVES
TABLE 79.ANHEUSER-BUSCH COMPANIES LLC: COMPANY SNAPSHOT
TABLE 80.ANHEUSER-BUSCH COMPANIES LLC: OPERATING SEGMENTS
TABLE 81.ANHEUSER-BUSCH COMPANIES LLC: PRODUCT PORTFOLIO
TABLE 82.ANHEUSER-BUSCH COMPANIES LLC: KEY STRATEGIC MOVES AND DEVELOPMENTS
TABLE 83.ASAHI PREMIUM BEVERAGES: KEY EXECUTIVES
TABLE 84.ASAHI PREMIUM BEVERAGES: COMPANY SNAPSHOT
TABLE 85.ASAHI PREMIUM BEVERAGES: OPERATING SEGMENTS
TABLE 86.ASAHI PREMIUM BEVERAGES: PRODUCT PORTFOLIO
TABLE 87.ASAHI PREMIUM BEVERAGES: KEY STRATEGIC MOVES AND DEVELOPMENTS
TABLE 88.ASTON MANOR: KEY EXECUTIVES
TABLE 89.ASTON MANOR: COMPANY SNAPSHOT
TABLE 90.ASTON MANOR: OPERATING SEGMENTS
TABLE 91.ASTON MANOR: PRODUCT PORTFOLIO
TABLE 92.ASTON MANOR: KEY STRATEGIC MOVES AND DEVELOPMENTS
TABLE 93.CANDC GROUP PLC: KEY EXECUTIVES
TABLE 94.CANDC GROUP PLC: COMPANY SNAPSHOT
TABLE 95.CANDC GROUP PLC: OPERATING SEGMENTS
TABLE 96.CANDC GROUP PLC: PRODUCT PORTFOLIO
TABLE 97.CANDC GROUP PLC: KEY STRATEGIC MOVES AND DEVELOPMENTS
TABLE 98.CARLSBERG BREWERIES A/S: KEY EXECUTIVES
TABLE 99.CARLSBERG BREWERIES A/S: COMPANY SNAPSHOT
TABLE 100.CARLSBERG BREWERIES A/S: OPERATING SEGMENTS
TABLE 101.CARLSBERG BREWERIES A/S: PRODUCT PORTFOLIO
TABLE 102.CARLSBERG BREWERIES A/S: KEY STRATEGIC MOVES AND DEVELOPMENTS
TABLE 103.CARLTON AND UNITED BREWERIES (CUB): KEY EXECUTIVES
TABLE 104.CARLTON AND UNITED BREWERIES (CUB): COMPANY SNAPSHOT
TABLE 105.CARLTON AND UNITED BREWERIES (CUB): OPERATING SEGMENTS
TABLE 106.CARLTON AND UNITED BREWERIES (CUB): PRODUCT PORTFOLIO
TABLE 107.CARLTON AND UNITED BREWERIES (CUB): KEY STRATEGIC MOVES AND DEVELOPMENTS
TABLE 108.DISTELL: KEY EXECUTIVES
TABLE 109.DISTELL: COMPANY SNAPSHOT
TABLE 110.DISTELL: OPERATING SEGMENTS
TABLE 111.DISTELL: PRODUCT PORTFOLIO
TABLE 112.DISTELL: KEY STRATEGIC MOVES AND DEVELOPMENTS
TABLE 113.HALEWOOD: KEY EXECUTIVES
TABLE 114.HALEWOOD: COMPANY SNAPSHOT
TABLE 115.HALEWOOD: OPERATING SEGMENTS
TABLE 116.HALEWOOD: PRODUCT PORTFOLIO
TABLE 117.HALEWOOD: KEY STRATEGIC MOVES AND DEVELOPMENTS
TABLE 118.HEINEKEN UK LIMITED: KEY EXECUTIVES
TABLE 119.HEINEKEN UK LIMITED: COMPANY SNAPSHOT
TABLE 120.HEINEKEN UK LIMITED: OPERATING SEGMENTS
TABLE 121.HEINEKEN UK LIMITED: PRODUCT PORTFOLIO
TABLE 122.HEINEKEN UK LIMITED: KEY STRATEGIC MOVES AND DEVELOPMENTS
TABLE 123.THE BOSTON BEER COMPANY: KEY EXECUTIVES
TABLE 124.THE BOSTON BEER COMPANY: COMPANY SNAPSHOT
TABLE 125.THE BOSTON BEER COMPANY: OPERATING SEGMENTS
TABLE 126.THE BOSTON BEER COMPANY: PRODUCT PORTFOLIO
TABLE 127.THE BOSTON BEER COMPANY: KEY STRATEGIC MOVES AND DEVELOPMENTS
LIST OF FIGURES
FIGURE 1.GLOBAL CIDER MARKET SEGMENTATION
FIGURE 2.GLOBAL CIDER MARKET
FIGURE 3.SEGMENTATION CIDER MARKET
FIGURE 4.TOP INVESTMENT POCKET IN CIDER MARKET
FIGURE 5.TOP WINNING STRATEGIES, 2019-2021*
FIGURE 6.TOP WINNING STRATEGIES, BY DEVELOPMENT, 2019-2021(%)
FIGURE 7.TOP WINNING STRATEGIES, BY COMPANY, 2019-2021*
FIGURE 8.MODERATE BARGAINING POWER OF BUYERS
FIGURE 9.MODERATE BARGAINING POWER OF SUPPLIERS
FIGURE 10.MODERATE THREAT OF NEW ENTRANTS
FIGURE 11.LOW THREAT OF SUBSTITUTION
FIGURE 12.HIGH COMPETITIVE RIVALRY
FIGURE 13.TOP PLAYER POSITIONING, 2020
FIGURE 14.MARKET SHARE ANALYSIS, 2020
FIGURE 15.RESTRAINTS AND DRIVERS: CIDER MARKET
FIGURE 16.CIDER MARKET SEGMENTATION, BY TYPE
FIGURE 17.CIDER MARKET FOR APPLE FLAVORED, BY COUNTRY, 2020-2031 ($MILLION)
FIGURE 18.CIDER MARKET FOR FRUIT FLAVORED, BY COUNTRY, 2020-2031 ($MILLION)
FIGURE 19.CIDER MARKET FOR PERRY, BY COUNTRY, 2020-2031 ($MILLION)
FIGURE 20.CIDER MARKET SEGMENTATION, BY PACKAGING
FIGURE 21.CIDER MARKET FOR DRAUGHT, BY COUNTRY, 2020-2031 ($MILLION)
FIGURE 22.CIDER MARKET FOR CANS, BY COUNTRY, 2020-2031 ($MILLION)
FIGURE 23.CIDER MARKET FOR GLASS BOTTLE, BY COUNTRY, 2020-2031 ($MILLION)
FIGURE 24.CIDER MARKET FOR PLASTIC BOTTLE, BY COUNTRY, 2020-2031 ($MILLION)
FIGURE 25.CIDER MARKET FOR OTHERS, BY COUNTRY, 2020-2031 ($MILLION)
FIGURE 26.CIDER MARKET SEGMENTATION, BY DISTRIBUTION CHANNEL
FIGURE 27.CIDER MARKET FOR ON-TRADE, BY COUNTRY, 2020-2031 ($MILLION)
FIGURE 28.CIDER MARKET FOR OFF-TRADE, BY COUNTRY, 2020-2031 ($MILLION)
FIGURE 29.ANHEUSER-BUSCH COMPANIES LLC: NET SALES, 2018-2020 ($MILLION)
FIGURE 30.ANHEUSER-BUSCH COMPANIES LLC: REVENUE SHARE, BY SEGMENT, 2020 (%)
FIGURE 31.ANHEUSER-BUSCH COMPANIES LLC: REVENUE SHARE, BY REGION, 2020 (%)
FIGURE 32.ASAHI PREMIUM BEVERAGES: NET SALES, 2018-2020 ($MILLION)
FIGURE 33.ASAHI PREMIUM BEVERAGES: REVENUE SHARE, BY SEGMENT, 2020 (%)
FIGURE 34.ASAHI PREMIUM BEVERAGES: REVENUE SHARE, BY REGION, 2020 (%)
FIGURE 35.ASTON MANOR: NET SALES, 2018-2020 ($MILLION)
FIGURE 36.ASTON MANOR: REVENUE SHARE, BY SEGMENT, 2020 (%)
FIGURE 37.ASTON MANOR: REVENUE SHARE, BY REGION, 2020 (%)
FIGURE 38.CANDC GROUP PLC: NET SALES, 2018-2020 ($MILLION)
FIGURE 39.CANDC GROUP PLC: REVENUE SHARE, BY SEGMENT, 2020 (%)
FIGURE 40.CANDC GROUP PLC: REVENUE SHARE, BY REGION, 2020 (%)
FIGURE 41.CARLSBERG BREWERIES A/S: NET SALES, 2018-2020 ($MILLION)
FIGURE 42.CARLSBERG BREWERIES A/S: REVENUE SHARE, BY SEGMENT, 2020 (%)
FIGURE 43.CARLSBERG BREWERIES A/S: REVENUE SHARE, BY REGION, 2020 (%)
FIGURE 44.CARLTON AND UNITED BREWERIES (CUB): NET SALES, 2018-2020 ($MILLION)
FIGURE 45.CARLTON AND UNITED BREWERIES (CUB): REVENUE SHARE, BY SEGMENT, 2020 (%)
FIGURE 46.CARLTON AND UNITED BREWERIES (CUB): REVENUE SHARE, BY REGION, 2020 (%)
FIGURE 47.DISTELL: NET SALES, 2018-2020 ($MILLION)
FIGURE 48.DISTELL: REVENUE SHARE, BY SEGMENT, 2020 (%)
FIGURE 49.DISTELL: REVENUE SHARE, BY REGION, 2020 (%)
FIGURE 50.HALEWOOD: NET SALES, 2018-2020 ($MILLION)
FIGURE 51.HALEWOOD: REVENUE SHARE, BY SEGMENT, 2020 (%)
FIGURE 52.HALEWOOD: REVENUE SHARE, BY REGION, 2020 (%)
FIGURE 53.HEINEKEN UK LIMITED: NET SALES, 2018-2020 ($MILLION)
FIGURE 54.HEINEKEN UK LIMITED: REVENUE SHARE, BY SEGMENT, 2020 (%)
FIGURE 55.HEINEKEN UK LIMITED: REVENUE SHARE, BY REGION, 2020 (%)
FIGURE 56.THE BOSTON BEER COMPANY: NET SALES, 2018-2020 ($MILLION)
FIGURE 57.THE BOSTON BEER COMPANY: REVENUE SHARE, BY SEGMENT, 2020 (%)
FIGURE 58.THE BOSTON BEER COMPANY: REVENUE SHARE, BY REGION, 2020 (%)
$5899
$7099
$11500
HAVE A QUERY?
OUR CUSTOMER