0
U.S. (TOLL FREE)
+1 (315) 215-3225
Automative

0
U.S. (TOLL FREE)
+1 (315) 215-3225
Logistics Market by Mode of Transport (Railways, Airways, Roadways, and Waterways) and End Use (Healthcare, Manufacturing, Aerospace, Telecommunication, Government & Public Utilities, Banking & Financial Services, Retail, Media & Entertainment, Technology, Trade & Transportation, and Others): Global Opportunity Analysis and Industry Forecast, 2017–2027
Published Date: February 2021
|
Report Code: ALLI-Auto-3T152
Home | Market Reports | Business & Industrial| Transportation & Logistics| Mail & Package Delivery
Logistics Market by Mode of Transport Railways Airways Roadways and Waterways and End Use Healthcare Manufacturing Aerospace Telecommunication Government Public Utilities Banking Financial Services Retail Media Entertainment Technology Trade Transportation and Others Global Opportunity Analysis and Industry Forecast 2017 2027
BUY CHAPTERS

Logistics Market by Mode of Transport (Railways, Airways, Roadways, and Waterways) and End Use (Healthcare, Manufacturing, Aerospace, Telecommunication, Government & Public Utilities, Banking & Financial Services, Retail, Media & Entertainment, Technology, Trade & Transportation, and Others): Global Opportunity Analysis and Industry Forecast, 2017–2027

Code: ALLI-Auto-3T152
Report
February 2021
Pages:310
Allied Market Research
Buy Now with 15% Discount
DESCRIPTION
TABLE OF CONTENT
TABLES & FIGURES

Logistics Market Statistics 2027

The global logistics market size is valued at US$ 7641.20 billion in 2017 and is projected to reach US$ 12975.64 billion by 2027 registering a CAGR of 6.5% from 2020 to 2027. Key drivers of the logistics market include the growing penetration of the ecommerce industry along with rise in reverse logistics operations.

Logistics Market

Further growing trade agreements among nations and increasing globalisation will propel the growth of the market during the forecast period. Moreover with the wide scale adoption of multi modal systems there has been a rapid growth of last mile deliveries, logistics automation, cost cutting and lead time reduction leading to the significant growth of the market. In addition to it other factors driving the growth of the logistics market are increasing automation of various processes and systems, the growing adoption of IoT enabled connected devices and increasing tech driven logistics services.

Trends Influencing the Growth of Global Logistics Market 

Growing ecommerce industry along with reverse logistics

Due to the growing penetration of e-commerce industry, third party logistics service providers are increasingly being used to ship products to consumers. Further various ecommerce companies are using logistics services to manage and oversee the entire supply chain processes of ecommerce companies so that these companies can focus on other business activities and marketing. Thus growing ecommerce trade along with rising reverse logistics operations is expected to fuel the growth of the logistics market during the forecast period.

Increasing trade agreements and rise in globalization

Due to rapidly changing market conditions and increasing global economy there is a continuous rise in globalization. This is creating an increase in trade activities and more trade agreements among nations. Therefore rising trade volume is making the tracking process of manufacturers and retailers more difficult leading to widescale adoption of logistics services . Further the expansion of the overseas market is also expected to boost the growth of the market. Moreover logistics plays a key role in trade activities as price sensitive consumers now want wider choice of high quality products with on time delivery. Thus rising trade volume due to globalization is expected to propel the growth of the logistics market during the forecast period.

Introduciton of last mile deliveries and logistics automation

Last mile delivery plays a key role in the logistics industry as it is the final step pf delivery process from a distribution center to the end user. With the ever increasing ecommerce industry getting a package on the same day of delivery is almost common now. Therefore logistics companies are increasingly putting in the effort to provide efficient last mile deliveries. Moreover with the growing penetration of pharmaceuticals , food and beverage ecommerce industries there is a rising emphasis on last mile delivery options across various logistics industries. In addition to it growing automation in the logistics industry and emergence of newer technologies such as logistics 4.0 will create lucrative opportunities for the growth of the logistics market during the forecast period.

Rapid advancements in technology and growing automation

The rapid advancements in technology, increasing adoption of IoT enabled connected devices, rise in tech driven logistics services along with the growing automation of systems and processes in the logistics industry will drive the market growth in the coming years. Also automated material handling equipment, biometrics, GPS, etc. will help organizations and businesses to work efficiently propelling the growth of the logistics market globally during the forecast period.

Logistics Market Share Anaysis

Based on region, the Asia-pacific segment will provide lucrative opportunities for growth in the logistics market share and is expected to grow at the highest CAGR of 6.90% during the forecast period due to rapid technological integrations, growing intra-Asian trade along with an increase in imports for both manufacturing and consumer products.

Based on end use, healthcare is expected to be one of the most lucrative segments for growth in the logistics market share during the forecast period.

Based on mode of transport, waterways is expected to be one of the most lucrative segments for growth in the logistics market share during the forecast period.

Logistics Market

Key Benefits for Stakeholders

  • This study presents analytical depiction of the global logistics market analysis along with current trends and future estimations to depict imminent investment pockets.
  • The overall logistics market opportunity is determined by understanding profitable trends to gain a stronger foothold.
  • The report presents information related to the key drivers, restraints, and opportunities of the global logistics market with a detailed impact analysis.
  • The current logistics market is quantitatively analyzed from 2017 to 2027 to benchmark the financial competency.
  • Porter’s five forces analysis illustrates the potency of the buyers and suppliers in the industry.

Key Segments

By End Use

    • Healthcare
    • Manufacturing
    • Aerospace
    • Telecommunication
    • Government & Public Utilities
    • Banking & Financial Services
    • Retail
    • Media & Entertainment
    • Technology
    • Trade & Transportation
    • Others

By Mode of Transportation

    • Railways
    • Airways
    • Roadways
    • Waterways

By Region

    • North America
      • U.S.
      • Canada
      • Mexico
    • Europe
      • UK
      • Germany
      • France
      • Spain
      • Italy
      • Rest of Europe
    • Asia-Pacific
      • China
      • Japan
      • India
      • Australia
      • Rest of Asia-Pacific
    • LAMEA
      • Latin America
      • Middle East
      • Africa

By Key Players

  • MOLLER – MAERSK
  • H. Robinson Worldwide, Inc.
  • DB SCHENKER (Deutsche Bahn Group (DB Group))
  • Deutsche Post AG (DHL Group) (DHL Group)
  • DSV (DSV Panalpina)
  • FEDEX
  • GEODIS
  • Kuehne+Nagel
  • Nippon Express
  • United Parcel Service, Inc. (UPS)

Logistics Market Scope

Report Metric Details
Report Name Logistics Market
The market size in 2017 USD 7641.20 Billion
The revenue forecast in 2027 USD 484.38 Billion
Growth Rate Compound Annual Growth Rate (CAGR) of 6.5% from 2020 to 2027
Market size available for years 2020-2027
Forecast units Value (USD)
Segments covered By Mode of Transport Type, End-User, and Region
Report coverage Revenue & volume forecast, company share, competitive landscape, growth factors, and trends
Geographic regions covered North America, Europe, Asia Pacific, Latin America, Middle East & Africa

Frequently Asked Questions About This Report

1.How Big is the Logistics Market?

Ans. The global logistics market size is valued at US$ 7641.20 billion in 2017 and is projected to reach US$ 12975.64 billion by 2027.

2. What is the Logistics Market Growth?

Ans. The global logistics market is expected to grow at a compound annual growth rate of 6.5% from 2020 to 2027.

3. Who are the major key players in Logistics Market?

Ans. MOLLER – MAERSK, H. Robinson Worldwide, Inc., DB SCHENKER (Deutsche Bahn Group (DB Group)), Deutsche Post AG (DHL Group) (DHL Group), DSV (DSV Panalpina), FEDEX, GEODIS, Kuehne+Nagel, Nippon Express, United Parcel Service, Inc. (UPS).

4. What are the major trends of Logistics Market?

Ans. Logistics market expansion is fueled by factors such as the rising e-commerce industry and the rise in reverse logistics activities. In addition, the growing acceptance of IoT-enabled linked devices and the rise of tech-driven logistics services are likely to propel the logistics market forward.

CHAPTER 1:INTRODUCTION
1.1.Report description
1.2.Key benefits for stakeholders
1.3.Key market segments
1.4.Research methodology
1.4.1.Primary research
1.4.2.Secondary research
1.4.3.Analyst tools and models
CHAPTER 2:EXECUTIVE SUMMARY
2.1.CXO perspective
CHAPTER 3:MARKET OVERVIEW
3.1.Market definition and scope
3.2.Key findings
3.2.1.Top impacting factors
3.2.2.Top investment pockets
3.2.3.Top winning strategies
3.3.Porter’s five forces analysis
3.4.Market share analysis, 2019
3.5.Market dynamics
3.5.1.Drivers
3.5.1.1.Growing e-commerce industry coupled with rise in reverse logistics operations
3.5.1.2.Rise in trade related agreements
3.5.1.3.Rise of tech-driven logistics services and growing adoption of IoT enabled connected devices
3.5.2.Restraints
3.5.2.1.Poor infrastructure and higher logistics costs
3.5.2.2.Lack of control of manufacturers on logistics service
3.5.3.Opportunities
3.5.3.1.Emergence of last mile deliveries coupled with logistics automation
3.5.3.2.Cost cutting and lead time reduction due to adoption of multi-modal system
3.6.Impact of COVID-19 on Market
3.6.1.Evolution of Outbreaks
3.6.1.1.COVID-19
3.6.2.Micro Economic Impact Analysis
3.6.2.1.Consumer trends
3.6.2.2.Technology trends
3.6.2.3.Regulatory trends
3.6.3.Macro-Economic Impact Analysis
3.6.3.1.GDP
3.6.3.2.Import/Export Analysis
3.6.3.3.Employment Index
3.6.3.4.Macro-Economic Impact Analysis
3.6.4.Impact on logistic industry analysis
CHAPTER 4:LOGISTICS MARKET, BY MODE OF TRANSPORT
4.1.Overview
4.2.Railways
4.2.1.Key market trends, growth factors, and opportunities
4.2.2.Market size and forecast, by region
4.2.3.Market analysis, by country
4.3.Airways
4.3.1.Key market trends, growth factors, and opportunities
4.3.2.Market size and forecast, by region
4.3.3.Market analysis, by country
4.4.Roadways
4.4.1.Key market trends, growth factors, and opportunities
4.4.2.Market size and forecast, by region
4.4.3.Market analysis, by country
4.5.Waterways
4.5.1.Key market trends, growth factors, and opportunities
4.5.2.Market size and forecast, by region
4.5.3.Market analysis, by country
CHAPTER 5:LOGISTICS MARKET, BY END USE
5.1.Overview
5.2.Healthcare
5.2.1.Key market trends, growth factors, and opportunities
5.2.2.Market size and forecast, by region
5.2.3.Market analysis, by country
5.3.Manufacturing
5.3.1.Key market trends, growth factors, and opportunities
5.3.2.Market size and forecast, by region
5.3.3.Market analysis, by country
5.4.Aerospace
5.4.1.Key market trends, growth factors, and opportunities
5.4.2.Market size and forecast, by region
5.4.3.Market analysis, by country
5.5.Telecommunication
5.5.1.Key market trends, growth factors, and opportunities
5.5.2.Market size and forecast, by region
5.5.3.Market analysis, by country
5.6.Government & public utilities
5.6.1.Key market trends, growth factors, and opportunities
5.6.2.Market size and forecast, by region
5.6.3.Market analysis, by country
5.7.Banking & financial services
5.7.1.Key market trends, growth factors, and opportunities
5.7.2.Market size and forecast, by region
5.7.3.Market analysis, by country
5.8.Retail
5.8.1.Key market trends, growth factors, and opportunities
5.8.2.Market size and forecast, by region
5.8.3.Market analysis, by country
5.9.Media & entertainment
5.9.1.Key market trends, growth factors, and opportunities
5.9.2.Market size and forecast, by region
5.9.3.Market analysis, by country
5.10.Technology
5.10.1.Key market trends, growth factors, and opportunities
5.10.2.Market size and forecast, by region
5.10.3.Market analysis, by country
5.11.Trade & Transportation
5.11.1.Key market trends, growth factors, and opportunities
5.11.2.Market size and forecast, by region
5.11.3.Market analysis, by country
5.12.Others
5.12.1.Key market trends, growth factors, and opportunities
5.12.2.Market size and forecast, by region
5.12.3.Market analysis, by country
CHAPTER 6:LOGISTICS MARKET, BY REGION
6.1.Overview
6.2.North America
6.2.1.Key market trends, growth factors and opportunities
6.2.2.Market size and forecast, by mode of transport
6.2.3.Market size and forecast, by end-use
6.2.4.Market size and forecast, by region
6.2.4.1.U.S.
6.2.4.1.1.Market size and forecast, by mode of transport
6.2.4.1.2.Market size and forecast, by end-use
6.2.4.2.Canada
6.2.4.2.1.Market size and forecast, by mode of transport
6.2.4.2.2.Market size and forecast, by end-use
6.2.4.3.Mexico
6.2.4.3.1.Market size and forecast, by mode of transport
6.2.4.3.2.Market size and forecast, by end-use
6.3.Europe
6.3.1.Key market trends, growth factors and opportunities
6.3.2.Market size and forecast, by mode of transport
6.3.3.Market size and forecast, by end-use
6.3.4.Market size and forecast, by region
6.3.4.1.UK
6.3.4.1.1.Market size and forecast, by mode of transport
6.3.4.1.2.Market size and forecast, by end-use
6.3.4.2.Germany
6.3.4.2.1.Market size and forecast, by mode of transport
6.3.4.2.2.Market size and forecast, by end-use
6.3.4.3.France
6.3.4.3.1.Market size and forecast, by mode of transport
6.3.4.3.2.Market size and forecast, by end-use
6.3.4.4.Spain
6.3.4.4.1.Market size and forecast, by mode of transport
6.3.4.4.2.Market size and forecast, by end-use
6.3.4.5.Italy
6.3.4.5.1.Market size and forecast, by mode of transport
6.3.4.5.2.Market size and forecast, by end-use
6.3.4.6.Rest of Europe
6.3.4.6.1.Market size and forecast, by mode of transport
6.3.4.6.2.Market size and forecast, by end-use
6.4.Asia-Pacific
6.4.1.Key market trends, growth factors and opportunities
6.4.2.Market size and forecast, by mode of transport
6.4.3.Market size and forecast, by end-use
6.4.4.Market size and forecast, by region
6.4.4.1.China
6.4.4.1.1.Market size and forecast, by mode of transport
6.4.4.1.2.Market size and forecast, by end-use
6.4.4.2.Japan
6.4.4.2.1.Market size and forecast, by mode of transport
6.4.4.2.2.Market size and forecast, by end-use
6.4.4.3.India
6.4.4.3.1.Market size and forecast, by mode of transport
6.4.4.3.2.Market size and forecast, by end-use
6.4.4.4.Australia
6.4.4.4.1.Market size and forecast, by mode of transport
6.4.4.4.2.Market size and forecast, by end-use
6.4.4.5.Rest of Asia-Pacific
6.4.4.5.1.Market size and forecast, by mode of transport
6.4.4.5.2.Market size and forecast, by end-use
6.5.LAMEA
6.5.1.Key market trends, growth factors and opportunities
6.5.2.Market size and forecast, by mode of transport
6.5.3.Market size and forecast, by end-use
6.5.4.Market size and forecast, by region
6.5.4.1.Latin America
6.5.4.1.1.Market size and forecast, by mode of transport
6.5.4.1.2.Market size and forecast, by end-use
6.5.4.2.Middle East
6.5.4.2.1.Market size and forecast, by mode of transport
6.5.4.2.2.Market size and forecast, by end-use
6.5.4.3.Africa
6.5.4.3.1.Market size and forecast, by mode of transport
6.5.4.3.2.Market size and forecast, by end-use
CHAPTER 7:COMPANY PROFILES
7.1.A.P. MOLLER – MAERSK
7.1.1.Company overview
7.1.2.Company snapshot
7.1.3.Product portfolio
7.1.4.Operating business segments
7.1.5.Business performance
7.1.6.Key strategic moves and developments
7.2.C.H. Robinson Worldwide, Inc.
7.2.1.Company overview
7.2.2.Company snapshot
7.2.3.Operating business segments
7.2.4.Product portfolio
7.2.5.Business performance
7.2.6.Key strategic moves and developments
7.3.DB SCHENKER (Deutsche Bahn Group (DB Group))
7.3.1.Company overview
7.3.2.Company snapshot
7.3.3.Product portfolio
7.3.4.Operating business segments
7.3.5.Business performance
7.3.6.Key strategic moves and developments
7.4.Deutsche Post AG (DHL Group) (DHL Group)
7.4.1.Company overview
7.4.2.Company snapshot
7.4.3.Operating business segments
7.4.4.Product portfolio
7.4.5.Business performance
7.4.6.Key strategic moves and developments
7.5.DSV (DSV Panalpina)
7.5.1.Company overview
7.5.2.Company snapshot
7.5.3.Operating business segments
7.5.4.Product portfolio
7.5.5.Business performance
7.5.6.DSV: Revenue share by segment, 2019 (%)
7.5.7.Key strategic moves and developments
7.6.FEDEX
7.6.1.Company overview
7.6.2.Company snapshot
7.6.3.Operating business segments
7.6.4.Product portfolio
7.6.5.Business performance
7.6.6.Key strategic moves and developments
7.7.GEODIS
7.7.1.Company overview
7.7.2.Company snapshot
7.7.3.Product portfolio
7.7.4.Business performance
7.7.5.Key strategic moves and developments
7.8.Kuehne+Nagel
7.8.1.Company overview
7.8.2.Company snapshot
7.8.3.Product portfolio
7.8.4.Operating business segments
7.8.5.Business performance
7.8.6.Key strategic moves and developments
7.9.Nippon Express
7.9.1.Company overview
7.9.2.Company snapshot
7.9.3.Operating business segments
7.9.4.Product portfolio
7.9.5.Business performance
7.9.6.Key strategic moves and developments
7.10.United Parcel Service, Inc. (UPS)
7.10.1.Company overview
7.10.2.Company snapshot
7.10.3.Operating business segments
7.10.4.Product portfolio
7.10.5.Business performance
7.10.6.Key strategic moves and development
LIST OF TABLES
 
 
TABLE 01.MACRO-ECONOMIC INDICATORS PROJECTIONS
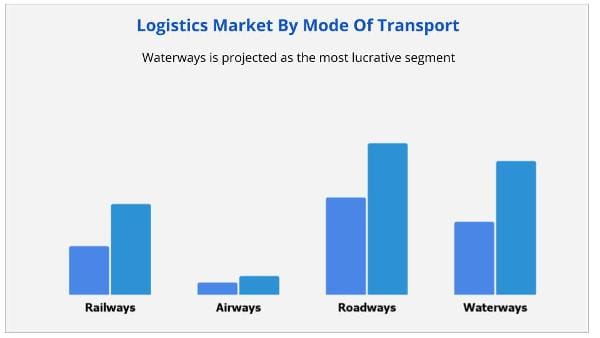
TABLE 02.LOGISTICS MARKET, BY MODE OF TRANSPORT, 2017–2027 ($BILLION)
TABLE 03.LOGISTICS MARKET REVENUE FOR RAILWAYS, BY REGION, 2017–2027 ($BILLION)
TABLE 04.LOGISTICS MARKET REVENUE FOR AIRWAYS, BY REGION, 2017–2027 ($BILLION)
TABLE 05.LOGISTICS MARKET REVENUE FOR ROADWAYS, BY REGION, 2017–2027 ($BILLION)
TABLE 06.LOGISTICS MARKET REVENUE FOR WATERWAYS, BY REGION, 2017–2027 ($BILLION)
TABLE 07.LOGISTICS MARKET, BY END USE, 2017–2027 ($BILLION)
TABLE 08.LOGISTICS MARKET REVENUE FOR HEALTHCARE, BY REGION, 2017–2027 ($BILLION)
TABLE 09.LOGISTICS MARKET REVENUE FOR MANUFACTURING, BY REGION, 2017–2027 ($BILLION)
TABLE 10.LOGISTICS MARKET REVENUE FOR AEROSPACE, BY REGION, 2017–2027 ($BILLION)
TABLE 11.LOGISTICS MARKET REVENUE FOR TELECOMMUNICATION, BY REGION, 2017–2027 ($BILLION)
TABLE 12.LOGISTICS MARKET REVENUE FOR GOVERNMENT & PUBLIC UTILITIES, BY REGION, 2017–2027 ($BILLION)
TABLE 13.LOGISTICS MARKET REVENUE FOR BANKING & FINANCIAL SERVICES, BY REGION, 2017–2027 ($BILLION)
TABLE 14.LOGISTICS MARKET REVENUE FOR RETAIL, BY REGION, 2017–2027 ($BILLION)
TABLE 15.LOGISTICS MARKET REVENUE FOR MEDIA & ENTERTAINMENT, BY REGION, 2017–2027 ($BILLION)
TABLE 16.LOGISTICS MARKET REVENUE FOR TECHNOLOGY, BY REGION, 2017–2027 ($BILLION)
TABLE 17.LOGISTICS MARKET REVENUE FOR TRADE & TRANSPORTATION, BY REGION, 2017–2027 ($BILLION)
TABLE 18.LOGISTICS MARKET REVENUE FOR OTHERS, BY REGION, 2017–2027 ($BILLION)
TABLE 19.LOGISTICS MARKET, BY REGION 2017–2027 ($BILLION)
TABLE 20.NORTH AMERICA LOGISTICS MARKET, BY MODE OF TRANSPORT, 2017–2027 ($BILLION)
TABLE 21.NORTH AMERICA LOGISTICS MARKET, BY END-USE, 2017–2027 ($BILLION)
TABLE 22.U.S. LOGISTICS MARKET, BY MODE OF TRANSPORT, 2017–2027 ($BILLION)
TABLE 23.U.S. LOGISTICS MARKET, BY END-USE, 2017–2027 ($BILLION)
TABLE 24.CANADA LOGISTICS MARKET, BY MODE OF TRANSPORT, 2017–2027 ($BILLION)
TABLE 25.CANADA LOGISTICS MARKET, BY END-USE, 2017–2027 ($BILLION)
TABLE 26.MEXICO LOGISTICS MARKET, BY MODE OF TRANSPORT, 2017–2027 ($BILLION)
TABLE 27.MEXICO LOGISTICS MARKET, BY END-USE, 2017–2027 ($BILLION)
TABLE 28.EUROPE LOGISTICS MARKET, BY MODE OF TRANSPORT, 2017–2027 ($BILLION)
TABLE 29.EUROPE LOGISTICS MARKET, BY END-USE, 2017–2027 ($BILLION)
TABLE 30.UK LOGISTICS MARKET, BY MODE OF TRANSPORT, 2017–2027 ($BILLION)
TABLE 31.UK LOGISTICS MARKET, BY END-USE, 2017–2027 ($BILLION)
TABLE 32.GERMANY LOGISTICS MARKET, BY MODE OF TRANSPORT, 2017–2027 ($BILLION)
TABLE 33.GERMANY LOGISTICS MARKET, BY END-USE, 2017–2027 ($BILLION)
TABLE 34.FRANCE LOGISTICS MARKET, BY MODE OF TRANSPORT, 2017–2027 ($BILLION)
TABLE 35.FRANCE LOGISTICS MARKET, BY END-USE, 2017–2027 ($BILLION)
TABLE 36.SPAIN LOGISTICS MARKET, BY MODE OF TRANSPORT, 2017–2027 ($BILLION)
TABLE 37.FRANCE LOGISTICS MARKET, BY END-USE, 2017–2027 ($BILLION)
TABLE 38.ITALY LOGISTICS MARKET, BY MODE OF TRANSPORT, 2017–2027 ($BILLION)
TABLE 39.ITALY LOGISTICS MARKET, BY END-USE, 2017–2027 ($BILLION)
TABLE 40.REST OF EUROPE LOGISTICS MARKET, BY MODE OF TRANSPORT, 2017–2027 ($BILLION)
TABLE 41.REST OF EUROPE LOGISTICS MARKET, BY END-USE, 2017–2027 ($BILLION)
TABLE 42.ASIA-PACIFIC LOGISTICS MARKET, BY MODE OF TRANSPORT, 2017–2027 ($BILLION)
TABLE 43.ASIA-PACIFIC LOGISTICS MARKET, BY END-USE, 2017–2027 ($BILLION)
TABLE 44.CHINA LOGISTICS MARKET, BY MODE OF TRANSPORT, 2017–2027 ($BILLION)
TABLE 45.CHINA LOGISTICS MARKET, BY END-USE, 2017–2027 ($BILLION)
TABLE 46.JAPAN LOGISTICS MARKET, BY MODE OF TRANSPORT, 2017–2027 ($BILLION)
TABLE 47.JAPAN LOGISTICS MARKET, BY END-USE, 2017–2027 ($BILLION)
TABLE 48.INDIA LOGISTICS MARKET, BY MODE OF TRANSPORT, 2017–2027 ($BILLION)
TABLE 49.INDIA LOGISTICS MARKET, BY END-USE, 2017–2027 ($BILLION)
TABLE 50.AUSTRALIA LOGISTICS MARKET, BY MODE OF TRANSPORT, 2017–2027 ($BILLION)
TABLE 51.AUSTRALIA LOGISTICS MARKET, BY END-USE, 2017–2027 ($BILLION)
TABLE 52.REST OF ASIA-PACIFIC LOGISTICS MARKET, BY MODE OF TRANSPORT, 2017–2027 ($BILLION)
TABLE 53.REST OF ASIA-PACIFIC LOGISTICS MARKET, BY END-USE, 2017–2027 ($BILLION)
TABLE 54.LAMEA LOGISTICS MARKET, BY MODE OF TRANSPORT, 2017–2027 ($BILLION)
TABLE 55.LAMEA LOGISTICS MARKET, BY END-USE, 2017–2027 ($BILLION)
TABLE 56.LOGISTICS MARKET, BY MODE OF TRANSPORT, 2017–2027 ($BILLION)
TABLE 57.LOGISTICS MARKET, BY END-USE, 2017–2027 ($BILLION)
TABLE 58.MIDDLE EAST LOGISTICS MARKET, BY MODE OF TRANSPORT, 2017–2027 ($BILLION)
TABLE 59.MIDDLE EAST LOGISTICS MARKET, BY END-USE, 2017–2027 ($BILLION)
TABLE 60.AFRICA LOGISTICS MARKET, BY MODE OF TRANSPORT, 2017–2027 ($BILLION)
TABLE 61.AFRICA LOGISTICS MARKET, BY END-USE, 2017–2027 ($BILLION)
TABLE 62.A.P. MOLLER – MAERSK: COMPANY SNAPSHOT
TABLE 63.A.P. MOLLER – MAERSK: PRODUCT PORTFOLIO
TABLE 64.A.P. MOLLER – MAERSK: OPERATING SEGMENTS
TABLE 65.A.P. MOLLER – MAERSK: KEY STRATEGIC MOVES AND DEVELOPMENTS
TABLE 66.C.H. ROBINSON WORLDWIDE, INC.: COMPANY SNAPSHOT
TABLE 67.C.H. ROBINSON WORLDWIDE, INC.: OPERATING SEGMENTS
TABLE 68.C.H. ROBINSON WORLDWIDE, INC.: PRODUCT PORTFOLIO
TABLE 69.C.H. ROBINSON WORLDWIDE, INC.: KEY STRATEGIC MOVES AND DEVELOPMENTS
TABLE 70.DB SCHENKER: COMPANY SNAPSHOT
TABLE 71.DB SCHENKER: PRODUCT PORTFOLIO
TABLE 72.DEUTSCHE BAHN GROUP (DB GROUP): OPERATING SEGMENTS
TABLE 73.DB SCHENKER: KEY STRATEGIC MOVES AND DEVELOPMENTS
TABLE 74.DEUTSCHE POST AG (DHL GROUP): COMPANY SNAPSHOT
TABLE 75.DEUTSCHE POST AG (DHL GROUP): OPERATING SEGMENTS
TABLE 76.DEUTSCHE POST AG (DHL GROUP): PRODUCT PORTFOLIO
TABLE 77.DEUTSCHE POST AG (DHL GROUP): KEY STRATEGIC MOVES AND DEVELOPMENTS
TABLE 78.DSV: COMPANY SNAPSHOT
TABLE 79.DSV: OPERATING SEGMENTS
TABLE 80.DSV: PRODUCT PORTFOLIO
TABLE 81.DSV: KEY STRATEGIC MOVES AND DEVELOPMENTS
TABLE 82.FEDEX: COMPANY SNAPSHOT
TABLE 83.FEDEX: OPERATING SEGMENTS
TABLE 84.FEDEX: PRODUCT PORTFOLIO
TABLE 85.FEDEX: KEY STRATEGIC MOVES AND DEVELOPMENTS
TABLE 86.GEODIS: COMPANY SNAPSHOT
TABLE 87.GEODIS: PRODUCT PORTFOLIO
TABLE 88.GEODIS: KEY STRATEGIC MOVES AND DEVELOPMENTS
TABLE 89.KUEHNE+NAGEL: COMPANY SNAPSHOT
TABLE 90.KUEHNE+NAGEL: PRODUCT PORTFOLIO
TABLE 91.KUEHNE+NAGEL: OPERATING SEGMENTS
TABLE 92.KUEHNE+NAGEL: KEY STRATEGIC MOVES AND DEVELOPMENTS
TABLE 93.NIPPON EXPRESS: COMPANY SNAPSHOT
TABLE 94.NIPPON EXPRESS: OPERATING SEGMENTS
TABLE 95.NIPPON EXPRESS: PRODUCT PORTFOLIO
TABLE 96.NIPPON EXPRESS: KEY STRATEGIC MOVES AND DEVELOPMENTS
TABLE 97.UNITED PARCEL SERVICE, INC. (UPS): COMPANY SNAPSHOT
TABLE 98.UNITED PARCEL SERVICE, INC. (UPS): OPERATING SEGMENTS
TABLE 99.UNITED PARCEL SERVICE (UPS): PRODUCT PORTFOLIO
TABLE 100.UNITED PARCEL SERVICE, INC. (UPS): KEY STRATEGIC MOVES AND DEVELOPMENTS LIST OF FIGURES
 
FIGURE 01.KEY MARKET SEGMENTS
FIGURE 02.EXECUTIVE SUMMARY, BY SEGMENT
FIGURE 03.EXECUTIVE SUMMURY, BY COUNTRY: SPANPSHOT
FIGURE 04.TOP IMPACTING FACTORS
FIGURE 05.TOP INVESTMENT POCKETS
FIGURE 06.TOP WINNING STRATEGIES, BY YEAR, 2017–2021*
FIGURE 07.TOP WINNING STRATEGIES, BY YEAR, 2017–2021*
FIGURE 08.TOP WINNING STRATEGIES, BY COMPANY, 2017–2021*
FIGURE 09.MODERATE-TO-HIGH BARGAINING POWER OF SUPPLIERS
FIGURE 10.MODERATE-TO-HIGH THREAT OF NEW ENTRANTS
FIGURE 11.MODERATE THREAT OF SUBSTITUTES
FIGURE 12.HIGH-TO-MODERATE INTENSITY OF RIVALRY
FIGURE 13.HIGH BARGAINING POWER OF BUYERS
FIGURE 14.MARKET SHARE ANALYSIS, 2019
FIGURE 15.LOGISTICS MARKET SHARE, BY MODE OF TRANSPORT, 2017–2027 (%)
FIGURE 16.COMPARATIVE SHARE ANALYSIS OF LOGISTICS MARKET FOR RAILWAYS, BY COUNTRY, 2017 & 2027 ($BILLION)
FIGURE 17.COMPARATIVE SHARE ANALYSIS OF LOGISTICS MARKET FOR AIRWAYS, BY COUNTRY, 2017 & 2027 ($BILLION)
FIGURE 18.COMPARATIVE SHARE ANALYSIS OF LOGISTICS MARKET FOR ROADWAYS, BY COUNTRY, 2017 & 2027 ($BILLION)
FIGURE 19.COMPARATIVE SHARE ANALYSIS OF LOGISTICS MARKET FOR WAYERWAYS, BY COUNTRY, 2017 & 2027 ($BILLION)
FIGURE 20.LOGISTICS MARKET SHARE, BY END USE, 2017–2027 (%)
FIGURE 21.COMPARATIVE SHARE ANALYSIS OF LOGISTICS MARKET FOR HEALTHCARE, BY COUNTRY, 2017 & 2027 ($BILLION)
FIGURE 22.COMPARATIVE SHARE ANALYSIS OF LOGISTICS MARKET FOR MANUFACTURING, BY COUNTRY, 2017 & 2027 ($BILLION)
FIGURE 23.COMPARATIVE SHARE ANALYSIS OF LOGISTICS MARKET FOR AEROSPACE, BY REGION, 2017 & 2027 (%)
FIGURE 24.COMPARATIVE SHARE ANALYSIS OF LOGISTICS MARKET FOR TELECOMMUNICATION, BY COUNTRY, 2017 & 2027 ($BILLION)
FIGURE 25.COMPARATIVE SHARE ANALYSIS OF LOGISTICS MARKET FOR GOVERNMENT & PUBLIC UTILITIES, BY COUNTRY, 2017 & 2027 ($BILLION)
FIGURE 26.COMPARATIVE SHARE ANALYSIS OF LOGISTICS MARKET FOR BANKING & FINANCIAL SERVICES, BY COUNTRY, 2017 & 2027 (%)
FIGURE 27.COMPARATIVE SHARE ANALYSIS OF LOGISTICS MARKET FOR RETAIL, BY COUNTRY, 2017 & 2027 (%)
FIGURE 28.COMPARATIVE SHARE ANALYSIS OF LOGISTICS MARKET FOR MEDIA & ENTERTAINMENT, BY COUNTRY, 2017 & 2027 (%)
FIGURE 29.COMPARATIVE SHARE ANALYSIS OF LOGISTICS MARKET FOR TECHNOLOGY, BY COUNTRY, 2017 & 2027 (%)
FIGURE 30.COMPARATIVE SHARE ANALYSIS OF LOGISTICS MARKET FOR TRADE & TRANSPORTATION, BY COUNTRY, 2017 & 2027 ($BILLION)
FIGURE 31.COMPARATIVE SHARE ANALYSIS OF LOGISTICS MARKET FOR OTHERS, BY COUNTRY, 2017 & 2027 (%)
FIGURE 32.LOGISTICS MARKET, BY REGION, 2019-2027 (%)
FIGURE 33.COMPARATIVE SHARE ANALYSIS OF LOGISTICS MARKET, BY REGION, 2017–2027 (%)
FIGURE 34.U.S. LOGISTICS MARKET, 2017–2027 ($BILLION)
FIGURE 35.CANADA LOGISTICS MARKET, 2017–2027 ($BILLION)
FIGURE 36.MEXICO LOGISTICS MARKET, 2017–2027 ($BILLION)
FIGURE 37.COMPARATIVE SHARE ANALYSIS OF LOGISTICS MARKET, BY REGION, 2017–2027 (%)
FIGURE 38.UK LOGISTICS MARKET, 2017–2027 ($BILLION)
FIGURE 39.GERMANY LOGISTICS MARKET, 2017–2027 ($BILLION)
FIGURE 40.FRANCE LOGISTICS MARKET, 2017–2027 ($BILLION)
FIGURE 41.SPAIN LOGISTICS MARKET, 2017–2027 ($BILLION)
FIGURE 42.ITALY LOGISTICS MARKET, 2017–2027 ($BILLION)
FIGURE 43.REST OF EUROPE LOGISTICS MARKET, 2017–2027 ($BILLION)
FIGURE 44.COMPARATIVE SHARE ANALYSIS OF LOGISTICS MARKET, BY REGION, 2017–2027 (%)
FIGURE 45.CHINA LOGISTICS MARKET, 2017–2027 ($BILLION)
FIGURE 46.JAPAN LOGISTICS MARKET, 2017–2027 ($BILLION)
FIGURE 47.INDIA LOGISTICS MARKET, 2017–2027 ($BILLION)
FIGURE 48.AUSTRALIA LOGISTICS MARKET, 2017–2027 ($BILLION)
FIGURE 49.REST OF ASIA-PACIFIC LOGISTICS MARKET, 2017–2027 ($BILLION)
FIGURE 50.COMPARATIVE SHARE ANALYSIS OF LOGISTICS MARKET, BY REGION, 2017–2027 (%)
FIGURE 51.LOGISTICS MARKET, 2017–2027 ($BILLION)
FIGURE 52.MIDDLE EAST LOGISTICS MARKET, 2017–2027 ($BILLION)
FIGURE 53.AFRICA LOGISTICS MARKET, 2017–2027 ($BILLION)
FIGURE 54.A.P. MOLLER – MAERSK: NET SALES, 2017–2019 ($MILLION)
FIGURE 55.A.P. MOLLER – MAERSK: REVENUE SHARE BY SEGMENT, 2019 (%)
FIGURE 56.A.P. MOLLER – MAERSK: REVENUE SHARE BY REGION, 2019 (%)
FIGURE 57.C.H. ROBINSON WORLDWIDE, INC.: NET SALES, 2017–2019 ($MILLION)
FIGURE 58.C.H. ROBINSON WORLDWIDE, INC.: REVENUE SHARE BY SEGMENT, 2019 (%)
FIGURE 59.C.H. ROBINSON WORLDWIDE, INC.: REVENUE SHARE BY REGION, 2019 (%)
FIGURE 60.DEUTSCHE BAHN GROUP (DB GROUP): NET SALES, 2017–2019 ($MILLION)
FIGURE 61.DEUTSCHE BAHN GROUP (DB GROUP): REVENUE SHARE BY SEGMENT, 2019 (%)
FIGURE 62.DEUTSCHE BAHN GROUP (DB GROUP): REVENUE SHARE BY REGION, 2019 (%)
FIGURE 63.DEUTSCHE POST AG (DHL GROUP): NET SALES, 2017–2019 ($MILLION)
FIGURE 64.DEUTSCHE POST AG (DHL GROUP): REVENUE SHARE BY SEGMENT, 2019 (%)
FIGURE 65.DEUTSCHE POST AG (DHL GROUP): REVENUE SHARE BY REGION, 2019 (%)
FIGURE 66.DSV: NET SALES, 2017–2019 ($MILLION)
FIGURE 67.DSV: REVENUE SHARE BY REGION, 2019 (%)
FIGURE 68.FEDEX: NET SALES, 2018–2020 ($MILLION)
FIGURE 69.FEDEX: REVENUE SHARE BY SEGMENT, 2020 (%)
FIGURE 70.FEDEX: REVENUE SHARE BY REGION, 2020 (%)
FIGURE 71.GEODIS: NET SALES, 2017–2019 ($MILLION)
FIGURE 72.KUEHNE+NAGEL: NET SALES, 2017–2019 ($MILLION)
FIGURE 73.KUEHNE+NAGEL: REVENUE SHARE BY SEGMENT, 2019 (%)
FIGURE 74.KUEHNE+NAGEL: REVENUE SHARE BY REGION, 2019 (%)
FIGURE 75.NIPPON EXPRESS: NET SALES, 2018–2020 ($MILLION)
FIGURE 76.NIPPON EXPRESS: REVENUE SHARE BY SEGMENT, 2020 (%)
FIGURE 77.NIPPON EXPRESS: REVENUE SHARE BY REGION, 2020 (%)
FIGURE 78.UNITED PARCEL SERVICE, INC. (UPS): NET SALES, 2017–2019 ($MILLION)
FIGURE 79.UNITED PARCEL SERVICE, INC. (UPS): REVENUE SHARE BY SEGMENT, 2019 (%)
FIGURE 80.UNITED PARCEL SERVICE, INC. (UPS): REVENUE SHARE BY REGION, 2019 (%
SELECT A FORMAT
Added to Cart
Electronic (PDF)

$5760

This license allows only one user to access the PDF.
Electronic (PDF)

$6450

This license allows 1 - 5 user to access the PDF, license is suitable for small groups of 5 users working together
Electronic (PDF)

$9995

This license allows users/teams in a same Enterprise to use this report, various departments within an enterpise can use this report
Electronic (PDF)

$3840

This license just provides quantitative data in a excel sheet
Add to Cart
Buy Now (15% Discount)

OUR CUSTOMER

SIS Group of Schools