0
U.S. (TOLL FREE)
+1 (315) 215-3225
Automative

0
U.S. (TOLL FREE)
+1 (315) 215-3225
Mineral Turpentine Market By Type (Hydrodesulfurized, Solvent Extracted, Hydrogenated), By Application (Paint Thinner, Extraction Solvent, Cleaning Solvent, Degreasing Solvent, Others): Global Opportunity Analysis and Industry Forecast, 2021-2031
Published Date: October 2022
|
Report Code: ALLI-Auto-3X945
Home | Market Reports | Business & Industrial| Chemicals Industry
Mineral Turpentine Market By Type Hydrodesulfurized Solvent Extracted Hydrogenated By Application Paint Thinner Extraction Solvent Cleaning Solvent Degreasing Solvent Others Global Opportunity Analysis and Industry Forecast 2021 2031
BUY CHAPTERS

Mineral Turpentine Market By Type (Hydrodesulfurized, Solvent Extracted, Hydrogenated), By Application (Paint Thinner, Extraction Solvent, Cleaning Solvent, Degreasing Solvent, Others): Global Opportunity Analysis and Industry Forecast, 2021-2031

Code: ALLI-Auto-3X945
Report
October 2022
Pages:327
Allied Market Research
Buy Now with 15% Discount
DESCRIPTION
TABLE OF CONTENT
TABLES & FIGURES

Mineral Turpentine Market Size

According to a new report published by , titled, “Mineral Turpentine Market," The mineral turpentine market was valued at $6.8 billion in 2021, and is estimated to reach $11.5 billion by 2031, growing at a CAGR of 5.5% from 2022 to 2031.

Mineral Turpentine Market

Mineral Turpentine Market

Mineral turpentine is also known as solvent naphtha and white spirit, is a petroleum-derived colorless and transparent liquid that is commonly used as an organic solvent. Mineral turpentine is widely used in the metal, lubricant, and paint industries.
The growth in demand for mineral turpentine from the paints and coatings sector, the relatively low cost of jet kerosene, and the need for mineral turpentine as a solvent are the main factors driving the global market for mineral turpentine. Additionally, turpentine can also be used as a cleaning & degreasing agent, paint, varnish, and lacquers solvent. Turpentine is prepared by distillation of various pine tree saps such as long-leaf yellow pine, which is toxic in nature. In addition, turpentine oxidizes easily if exposed to daylight or air, resulting in tackiness and yellowing in the painting. Mineral turpentine is widely used as a turpentine substitute owing to its non-deteriorating property while storage aids the growth in demand for global mineral turpentine market.
However, mineral turpentine is an aromatic organic solvent and high level of exposure to mineral turpentine leads to toxic effects such as chemical burns, nausea, and others. In addition, prolonged exposure can cause chronic central nervous system disorder. Surge in health issues and health awareness have shifted consumer’s preference toward non-toxic products. In addition, development in water-based paints, which do not require any organic solvents such as turpentine or mineral turpentine, has gained popularity, significantly in residential & non-residential construction sector. These water-based paints are non-toxic in nature; thus, these are actively substituting the demand for oil-based paints and organic solvents such as turpentine and mineral turpentine that are considerably anticipated to hamper the market growth during the forecast period. 
High exposure of aroma associated with mineral turpentine in enclosed space may have narcotic effects such as drowsiness, dizziness, nausea, and others. This factor restrains the use of aromatic paint solvents and offers an opportunistic market for non-aromatic options such as water-based paints. However, development of low aromatic mineral turpentine (LAWS), which are less toxic in nature and do not have narcotic effects, is anticipated to offer a lucrative opportunity for the mineral turpentine market.
The mineral turpentine market analysis is done on the basis of product type, grade, application, and region. Depending on type, the market is divided into type 0, type 1, type 2, and type 3. Type 1 product type was the largest revenue generator, and is anticipated to grow at a CAGR of 5.6%  during the forecast period. Type 1 mineral turpentine is subjected to hydro-desulfurization process and comprises of hydrocarbon with carbon number ranging between C7-C12. Type 1 mineral turpentine is widely used as extraction solvent and cleaning solvent owing to its high boiling point (90-230°C). In addition, use of type 1 mineral turpentine as an active solvent in aerosol and other wood preservative products drives the demand of the global market.
On the basis of grade, the global mineral turpentine market is divided into low flash point grade mineral turpentine, regular flash point grade mineral turpentine, and high flash point grade mineral turpentine. The regular flash point mineral turpentine grade was the largest revenue generator, and is anticipated to grow at a CAGR of 5.5%  during the forecast period. High flash point grade mineral turpentine has 31 to 54 Centigrade of flash point making them ideal to be used in paints, varnishes, and asphalt products that drives the demand of the global market
The applications covered in the study include paint thinner, solvent extraction, cleaning solvent, degreasing solvent, and others. In 2020, the paint thinner application was the largest revenue generator, and is anticipated to grow at a CAGR of 6.1%  during the forecast period. Mineral turpentine is produced from petroleum distillate making it viable to be used as a solvent in paint thinner, which drives the demand for mineral turpentine in pain thinner application.
Region-wise, the mineral turpentine market is analyzed across North America, Europe, Asia-Pacific, and LAMEA. The Asia-Pacific mineral turpentine market size is projected to grow at the highest CAGR of 5.9%  during the forecast period. Eco-friendly and cost effectiveness of mineral turpentine makes it viable to be used for applications such as paint thinner as it minimizes the paint viscosity and improves paint smoothness. In addition, rise in use of mineral turpentine in construction and automotive end-use industries drive the demand of Asia-Pacific mineral turpentine market.
Key players operating in the global mineral turpentine market include Al Sanea, Alshall International Co., Bharat Petroleum Corporation Limited, DHC Solvent Chemie GmbH, Global Petro, GSB Chemical Co. Pty. Ltd., Hindustan Petroleum Corporation Limited, Indian Oil Corporation Ltd., Powerzone Oil, and Sydney Solvents.
KEY FINDINGS OF THE STUDY
On the basis of type, the type 1 segment emerged as the global leader by acquiring more than 53.1% of the Mineral turpentine market share in 2021, and is anticipated to continue this trend during the forecast period.
On the basis of grade, the high flash point segment emerged as the global leader by acquiring more than 42.9% of the Mineral turpentine market share in 2021, and is anticipated to continue this trend during the forecast period.
On the basis of application, the paint thinner segment accounted for 40.9% of the global Mineral turpentine market share in FY2021 and is anticipated to continue this trend during the forecast period.
On the basis of region, Europe is the major consumer of Mineral turpentine among other regions. It accounted for around 41.1% of the global market share in 2021 and is anticipated to continue this trend during the forecast period.
IMPACT OF COVID-19 ON THE GLOBAL MINERAL TURPENTINE MARKET
Europe is a key supplier of Mineral turpentines, thus restrictions put on European countries to contain and minimize the spread of the virus reduced demand for adhesives and sealants, lubricants and grease, hydraulic fluids, metal working fluids and other Mineral turpentine-based products during the COVID-19 pandemic. From 2021, the operations of various end-use industries have started normally which helped to increase demand for Mineral turpentine from end-use industries such as automotive, construction, and others.

Overview

The global mineral turpentine market was valued at $6.8 billion in 2021, and is projected to reach $11.5 billion by 2031, expanding at a CAGR of 5.5% from 2022 to 2031.
Mineral turpentine is a mixture of saturated aliphatic & alicyclic C7–C12 hydrocarbons that contain 15%–20% aromatic C7–C12 hydrocarbons (by weight) and exhibits a boiling range of 130°C–230°C. There are three different types and grades of mineral turpentines. The classification based on type depends on whether the solvent is subjected to only hydrodesulfurization (type 1), solvent extraction (type 2), or hydrogenation (type 3).
The growth of the global mineral turpentine market is driven by modest jet kerosene prices and rise in demand from the paints & coating end-use industry. As per United Nations, 2018, the current estimation indicates that nearly 83 million people are added to the world’s population every year. Even with the decline in fertility level, the global population is expected to reach 8.6 billion by 2030. This population growth has increased the annual demand in various industries such as construction, manufacturing, and others. Surge in number of applications of paints & coatings in industries such as construction, automobile, manufacturing, and others drive the demand for paints & coating industry. However, the paints & coating products are complimented with their solvents such as mineral turpentine. Extensive application of mineral turpentine as a cleaning & degreasing agent, paint, varnish & lacquers solvent, and others propels the market growth.
However, mineral turpentine is toxic and hazardous in nature. Exposure through inhalation of vapor, dermal, and oral routes can lead to acute poisoning, which may result into central nervous system depression. Moreover, high exposure to mineral turpentine in enclosed spaces may lead to narcotic effects such as drowsiness, dizziness, nausea, and others, and finally unconsciousness of an individual. Moreover, direct contact of skin with mineral turpentine for several hours can cause chemical burns. Thus, the toxic & hazardous property may act as a restraint to the growth of mineral turpentine market.
Turpentine can also be used as cleaning & degreasing agent, paint, varnish, and lacquers solvent. Turpentine is prepared by distillation of various pine tree saps such as long-leaf yellow pine, which is toxic in nature. In addition, turpentine oxidizes easily if exposed to daylight or air, resulting in tackiness and yellowing in the painting. Availability of less harmful products, such as mineral turpentine as a turpentine substitute, and its non-deteriorating property while storage aid the growth in demand for mineral turpentines. This factor is anticipated to offer new growth opportunities during the forecast period.
The global mineral turpentines market analysis is done on the basis of product type, grade, application, and region. Depending on type, the market is divided into type 0, type 1, type 2, and type 3. On the basis of grade, the global mineral turpentines market is divided into low flash point grade mineral turpentines, regular flash point grade mineral turpentines, and high flash point grade mineral turpentines. The applications covered in the study include paint thinner, solvent extraction, cleaning solvent, degreasing solvent, and others. Region-wise, the market is analyzed across North America, Europe, Asia-Pacific, and LAMEA.
Key players engaged in development and production of mineral turpentine include Al Sanea, Alshall International Co., Bharat Petroleum Corporation Limited, DHC Solvent Chemie GmbH, Global Petro, GSB Chemical Co. Pty. Ltd., Hindustan Petroleum Corporation Limited, Indian Oil Corporation Ltd., Powerzone Oil, and Sydney Solvents.
IMPACT OF COVID-19 ON THE GLOBAL MINERAL TURPENTINE MARKET
The temporary shutdown of oil refineries amid the COVID-19 period has led to demand-supply disruptions. For instance, according to a report published by the Indian Ministry of Petroleum & Natural Gas, the central public sector enterprise (CPSE) refineries have produced 7,103.7 thousand metric tons (TMT) of crude oil in April 2020 that is 28.91% lower than the target for the month and 36.93% lower than the production achieved in the corresponding month of 2019. This has severely affected the demand for mineral turpentine market during the COVID-19 situation.

Key Benefits For Stakeholders

●This report provides a quantitative analysis of the market segments, current trends, estimations, and dynamics of the mineral turpentine market analysis from 2021 to 2031 to identify the prevailing mineral turpentine market opportunities.
●The market research is offered along with information related to key drivers, restraints, and opportunities.
●Porter's five forces analysis highlights the potency of buyers and suppliers to enable stakeholders make profit-oriented business decisions and strengthen their supplier-buyer network.
●In-depth analysis of the mineral turpentine market segmentation assists to determine the prevailing market opportunities.
●Major countries in each region are mapped according to their revenue contribution to the global market.
●Market player positioning facilitates benchmarking and provides a clear understanding of the present position of the market players.
●The report includes the analysis of the regional as well as global mineral turpentine market trends, key players, market segments, application areas, and market growth strategies.
Key Market Segments
○ Sydney Solvent

Scope of Mineral Turpentine Market Report

Report Metric Details
Report Name Mineral Turpentine Market
Accounted market size in 2021 $ 6.8 in billion
Forecasted market size in 2031 $ 11.5 billion
CAGR 5.5%
Base Year 2021
Forecasted years 2024 - 2031
By Application ● Paint Thinner
● Extraction Solvent
● Cleaning Solvent
● Degreasing Solvent
● Others
By Type ● Type 1
● Type 2
● Type 3
● Type 0
By Grade ● Low flash point
● Regular flash point
● High flash point
By Region
  • North America (United States, Canada)
  • Europe (Germany, France, UK, Italy, Russia) Rest of Europe
  • Nordic Countries
  • Asia-Pacific (China, Japan, South Korea)
  • Southeast Asia (India, Australia)
  • Rest of Asia
  • Latin America (Mexico, Brazil)
  • Rest of Latin America
  • Middle East & Africa (Turkey, Saudi Arabia, UAE, Rest of MEA)
Forecast units USD million in value
Report coverage Revenue and volume forecast, company share, competitive landscape, growth factors and trends

FAQ for this report

How fast is Mineral Turpentine Market growing?

Ans: The Mineral Turpentine Market witnessing a CAGR of 5.5% during the forecast period 2024-2031.

What is the Mineral Turpentine Market size in 2031?

Ans: The Mineral Turpentine Market size in 2031 will be $ 11.5 billion.

What are the Application segmentation covered in the Mineral Turpentine Market report?

Ans: The Applications covered in the Mineral Turpentine Market report are ● Paint Thinner, ● Extraction Solvent, ● Cleaning Solvent, ● Degreasing Solvent, ● Others

What are the Type segmentation covered in the Mineral Turpentine Market report?

Ans: The Types covered in the Mineral Turpentine Market report are ● Type 1, ● Type 2, ● Type 3, ● Type 0

CHAPTER 1:INTRODUCTION
1.1.Report description
1.2.Key market segments
1.3.Key benefits to the stakeholders
1.4.Research Methodology
1.4.1.Secondary research
1.4.2.Primary research
1.4.3.Analyst tools and models
CHAPTER 2:EXECUTIVE SUMMARY
2.1.Key findings of the study
2.2.CXO Perspective
CHAPTER 3:MARKET OVERVIEW
3.1.Market definition and scope
3.2.Key findings
3.2.1.Top investment pockets
3.3.Porter’s five forces analysis
3.4.Top player positioning
3.5.Market dynamics
3.5.1.Drivers
3.5.2.Restraints
3.5.3.Opportunities
3.6.COVID-19 Impact Analysis on the market
3.7.Pricing Analysis
3.8.Value Chain Analysis
3.9.Key Regulation Analysis
3.10.Patent Landscape
CHAPTER 4: MINERAL TURPENTINE MARKET, BY TYPE
4.1 Overview
4.1.1 Market size and forecast
4.2 Type 1
4.2.1 Key market trends, growth factors and opportunities
4.2.2 Market size and forecast, by region
4.2.3 Market share analysis by country
4.3 Type 2
4.3.1 Key market trends, growth factors and opportunities
4.3.2 Market size and forecast, by region
4.3.3 Market share analysis by country
4.4 Type 3
4.4.1 Key market trends, growth factors and opportunities
4.4.2 Market size and forecast, by region
4.4.3 Market share analysis by country
4.5 Type 0
4.5.1 Key market trends, growth factors and opportunities
4.5.2 Market size and forecast, by region
4.5.3 Market share analysis by country
CHAPTER 5: MINERAL TURPENTINE MARKET, BY GRADE
5.1 Overview
5.1.1 Market size and forecast
5.2 Low flash point
5.2.1 Key market trends, growth factors and opportunities
5.2.2 Market size and forecast, by region
5.2.3 Market share analysis by country
5.3 Regular flash point
5.3.1 Key market trends, growth factors and opportunities
5.3.2 Market size and forecast, by region
5.3.3 Market share analysis by country
5.4 High flash point
5.4.1 Key market trends, growth factors and opportunities
5.4.2 Market size and forecast, by region
5.4.3 Market share analysis by country
CHAPTER 6: MINERAL TURPENTINE MARKET, BY APPLICATION
6.1 Overview
6.1.1 Market size and forecast
6.2 Paint Thinner
6.2.1 Key market trends, growth factors and opportunities
6.2.2 Market size and forecast, by region
6.2.3 Market share analysis by country
6.3 Extraction Solvent
6.3.1 Key market trends, growth factors and opportunities
6.3.2 Market size and forecast, by region
6.3.3 Market share analysis by country
6.4 Cleaning Solvent
6.4.1 Key market trends, growth factors and opportunities
6.4.2 Market size and forecast, by region
6.4.3 Market share analysis by country
6.5 Degreasing Solvent
6.5.1 Key market trends, growth factors and opportunities
6.5.2 Market size and forecast, by region
6.5.3 Market share analysis by country
6.6 Others
6.6.1 Key market trends, growth factors and opportunities
6.6.2 Market size and forecast, by region
6.6.3 Market share analysis by country
CHAPTER 7: MINERAL TURPENTINE MARKET, BY REGION
7.1 Overview
7.1.1 Market size and forecast
7.2 North America
7.2.1 Key trends and opportunities
7.2.2 North America Market size and forecast, by Type
7.2.3 North America Market size and forecast, by Grade
7.2.4 North America Market size and forecast, by Application
7.2.5 North America Market size and forecast, by country
7.2.5.1 U.S.
7.2.5.1.1 Key market trends, growth factors and opportunities
7.2.5.1.2 Market size and forecast, by Type
7.2.5.1.3 Market size and forecast, by Grade
7.2.5.1.4 Market size and forecast, by Application
7.2.5.2 Canada
7.2.5.2.1 Key market trends, growth factors and opportunities
7.2.5.2.2 Market size and forecast, by Type
7.2.5.2.3 Market size and forecast, by Grade
7.2.5.2.4 Market size and forecast, by Application
7.2.5.3 Mexico
7.2.5.3.1 Key market trends, growth factors and opportunities
7.2.5.3.2 Market size and forecast, by Type
7.2.5.3.3 Market size and forecast, by Grade
7.2.5.3.4 Market size and forecast, by Application
7.3 Europe
7.3.1 Key trends and opportunities
7.3.2 Europe Market size and forecast, by Type
7.3.3 Europe Market size and forecast, by Grade
7.3.4 Europe Market size and forecast, by Application
7.3.5 Europe Market size and forecast, by country
7.3.5.1 Germany
7.3.5.1.1 Key market trends, growth factors and opportunities
7.3.5.1.2 Market size and forecast, by Type
7.3.5.1.3 Market size and forecast, by Grade
7.3.5.1.4 Market size and forecast, by Application
7.3.5.2 UK
7.3.5.2.1 Key market trends, growth factors and opportunities
7.3.5.2.2 Market size and forecast, by Type
7.3.5.2.3 Market size and forecast, by Grade
7.3.5.2.4 Market size and forecast, by Application
7.3.5.3 France
7.3.5.3.1 Key market trends, growth factors and opportunities
7.3.5.3.2 Market size and forecast, by Type
7.3.5.3.3 Market size and forecast, by Grade
7.3.5.3.4 Market size and forecast, by Application
7.3.5.4 Spain
7.3.5.4.1 Key market trends, growth factors and opportunities
7.3.5.4.2 Market size and forecast, by Type
7.3.5.4.3 Market size and forecast, by Grade
7.3.5.4.4 Market size and forecast, by Application
7.3.5.5 Italy
7.3.5.5.1 Key market trends, growth factors and opportunities
7.3.5.5.2 Market size and forecast, by Type
7.3.5.5.3 Market size and forecast, by Grade
7.3.5.5.4 Market size and forecast, by Application
7.3.5.6 Rest of Europe
7.3.5.6.1 Key market trends, growth factors and opportunities
7.3.5.6.2 Market size and forecast, by Type
7.3.5.6.3 Market size and forecast, by Grade
7.3.5.6.4 Market size and forecast, by Application
7.4 Asia-Pacific
7.4.1 Key trends and opportunities
7.4.2 Asia-Pacific Market size and forecast, by Type
7.4.3 Asia-Pacific Market size and forecast, by Grade
7.4.4 Asia-Pacific Market size and forecast, by Application
7.4.5 Asia-Pacific Market size and forecast, by country
7.4.5.1 China
7.4.5.1.1 Key market trends, growth factors and opportunities
7.4.5.1.2 Market size and forecast, by Type
7.4.5.1.3 Market size and forecast, by Grade
7.4.5.1.4 Market size and forecast, by Application
7.4.5.2 India
7.4.5.2.1 Key market trends, growth factors and opportunities
7.4.5.2.2 Market size and forecast, by Type
7.4.5.2.3 Market size and forecast, by Grade
7.4.5.2.4 Market size and forecast, by Application
7.4.5.3 Japan
7.4.5.3.1 Key market trends, growth factors and opportunities
7.4.5.3.2 Market size and forecast, by Type
7.4.5.3.3 Market size and forecast, by Grade
7.4.5.3.4 Market size and forecast, by Application
7.4.5.4 South Korea
7.4.5.4.1 Key market trends, growth factors and opportunities
7.4.5.4.2 Market size and forecast, by Type
7.4.5.4.3 Market size and forecast, by Grade
7.4.5.4.4 Market size and forecast, by Application
7.4.5.5 Australia
7.4.5.5.1 Key market trends, growth factors and opportunities
7.4.5.5.2 Market size and forecast, by Type
7.4.5.5.3 Market size and forecast, by Grade
7.4.5.5.4 Market size and forecast, by Application
7.4.5.6 Rest of Asia-Pacific
7.4.5.6.1 Key market trends, growth factors and opportunities
7.4.5.6.2 Market size and forecast, by Type
7.4.5.6.3 Market size and forecast, by Grade
7.4.5.6.4 Market size and forecast, by Application
7.5 LAMEA
7.5.1 Key trends and opportunities
7.5.2 LAMEA Market size and forecast, by Type
7.5.3 LAMEA Market size and forecast, by Grade
7.5.4 LAMEA Market size and forecast, by Application
7.5.5 LAMEA Market size and forecast, by country
7.5.5.1 Brazil
7.5.5.1.1 Key market trends, growth factors and opportunities
7.5.5.1.2 Market size and forecast, by Type
7.5.5.1.3 Market size and forecast, by Grade
7.5.5.1.4 Market size and forecast, by Application
7.5.5.2 Saudi Arabia
7.5.5.2.1 Key market trends, growth factors and opportunities
7.5.5.2.2 Market size and forecast, by Type
7.5.5.2.3 Market size and forecast, by Grade
7.5.5.2.4 Market size and forecast, by Application
7.5.5.3 South Africa
7.5.5.3.1 Key market trends, growth factors and opportunities
7.5.5.3.2 Market size and forecast, by Type
7.5.5.3.3 Market size and forecast, by Grade
7.5.5.3.4 Market size and forecast, by Application
7.5.5.4 Rest of LAMEA
7.5.5.4.1 Key market trends, growth factors and opportunities
7.5.5.4.2 Market size and forecast, by Type
7.5.5.4.3 Market size and forecast, by Grade
7.5.5.4.4 Market size and forecast, by Application
CHAPTER 8: COMPANY LANDSCAPE
8.1. Introduction
8.2. Top winning strategies
8.3. Product Mapping of Top 10 Player
8.4. Competitive Dashboard
8.5. Competitive Heatmap
8.6. Key developments
CHAPTER 9: COMPANY PROFILES
9.1 Sydney Solvents
9.1.1 Company overview
9.1.2 Company snapshot
9.1.3 Operating business segments
9.1.4 Product portfolio
9.1.5 Business performance
9.1.6 Key strategic moves and developments
9.2 Global Petro
9.2.1 Company overview
9.2.2 Company snapshot
9.2.3 Operating business segments
9.2.4 Product portfolio
9.2.5 Business performance
9.2.6 Key strategic moves and developments
9.3 Powerzone Oil
9.3.1 Company overview
9.3.2 Company snapshot
9.3.3 Operating business segments
9.3.4 Product portfolio
9.3.5 Business performance
9.3.6 Key strategic moves and developments
9.4 GSB Chemical Co. Pty. Ltd
9.4.1 Company overview
9.4.2 Company snapshot
9.4.3 Operating business segments
9.4.4 Product portfolio
9.4.5 Business performance
9.4.6 Key strategic moves and developments
9.5 Hindustan Petroleum Corporation Limited
9.5.1 Company overview
9.5.2 Company snapshot
9.5.3 Operating business segments
9.5.4 Product portfolio
9.5.5 Business performance
9.5.6 Key strategic moves and developments
9.6 Bharat Petroleum Corporation Limited
9.6.1 Company overview
9.6.2 Company snapshot
9.6.3 Operating business segments
9.6.4 Product portfolio
9.6.5 Business performance
9.6.6 Key strategic moves and developments
9.7 Al Sanea
9.7.1 Company overview
9.7.2 Company snapshot
9.7.3 Operating business segments
9.7.4 Product portfolio
9.7.5 Business performance
9.7.6 Key strategic moves and developments
9.8 Indian Oil Corporation Ltd
9.8.1 Company overview
9.8.2 Company snapshot
9.8.3 Operating business segments
9.8.4 Product portfolio
9.8.5 Business performance
9.8.6 Key strategic moves and developments
9.9 ALSHALL INTERNATIONAL CO.
9.9.1 Company overview
9.9.2 Company snapshot
9.9.3 Operating business segments
9.9.4 Product portfolio
9.9.5 Business performance
9.9.6 Key strategic moves and developments
9.10 DHC Solvent Chemie GmbH
9.10.1 Company overview
9.10.2 Company snapshot
9.10.3 Operating business segments
9.10.4 Product portfolio
9.10.5 Business performance
9.10.6 Key strategic moves and development
LIST OF TABLES
TABLE 1. GLOBAL MINERAL TURPENTINE MARKET, BY TYPE, 2021-2031 (REVENUE, $MILLION)
TABLE 2. GLOBAL MINERAL TURPENTINE MARKET, BY TYPE, 2021-2031 (VOLUME, KILOTON)
TABLE 3. MINERAL TURPENTINE MARKET FOR TYPE 1, BY REGION, 2021-2031 (REVENUE, $MILLION)
TABLE 4. MINERAL TURPENTINE MARKET FOR TYPE 1, BY REGION, 2021-2031 (VOLUME, KILOTON)
TABLE 5. MINERAL TURPENTINE MARKET FOR TYPE 1, BY COUNTRY, 2021-2031 (REVENUE, $MILLION)
TABLE 6. MINERAL TURPENTINE MARKET FOR TYPE 1, BY COUNTRY, 2021-2031 (VOLUME, KILOTON)
TABLE 7. MINERAL TURPENTINE MARKET FOR TYPE 2, BY REGION, 2021-2031 (REVENUE, $MILLION)
TABLE 8. MINERAL TURPENTINE MARKET FOR TYPE 2, BY REGION, 2021-2031 (VOLUME, KILOTON)
TABLE 9. MINERAL TURPENTINE MARKET FOR TYPE 2, BY COUNTRY, 2021-2031 (REVENUE, $MILLION)
TABLE 10. MINERAL TURPENTINE MARKET FOR TYPE 2, BY COUNTRY, 2021-2031 (VOLUME, KILOTON)
TABLE 11. MINERAL TURPENTINE MARKET FOR TYPE 3, BY REGION, 2021-2031 (REVENUE, $MILLION)
TABLE 12. MINERAL TURPENTINE MARKET FOR TYPE 3, BY REGION, 2021-2031 (VOLUME, KILOTON)
TABLE 13. MINERAL TURPENTINE MARKET FOR TYPE 3, BY COUNTRY, 2021-2031 (REVENUE, $MILLION)
TABLE 14. MINERAL TURPENTINE MARKET FOR TYPE 3, BY COUNTRY, 2021-2031 (VOLUME, KILOTON)
TABLE 15. MINERAL TURPENTINE MARKET FOR TYPE 0, BY REGION, 2021-2031 (REVENUE, $MILLION)
TABLE 16. MINERAL TURPENTINE MARKET FOR TYPE 0, BY REGION, 2021-2031 (VOLUME, KILOTON)
TABLE 17. MINERAL TURPENTINE MARKET FOR TYPE 0, BY COUNTRY, 2021-2031 (REVENUE, $MILLION)
TABLE 18. MINERAL TURPENTINE MARKET FOR TYPE 0, BY COUNTRY, 2021-2031 (VOLUME, KILOTON)
TABLE 19. GLOBAL MINERAL TURPENTINE MARKET, BY GRADE, 2021-2031 (REVENUE, $MILLION)
TABLE 20. GLOBAL MINERAL TURPENTINE MARKET, BY GRADE, 2021-2031 (VOLUME, KILOTON)
TABLE 21. MINERAL TURPENTINE MARKET FOR LOW FLASH POINT, BY REGION, 2021-2031 (REVENUE, $MILLION)
TABLE 22. MINERAL TURPENTINE MARKET FOR LOW FLASH POINT, BY REGION, 2021-2031 (VOLUME, KILOTON)
TABLE 23. MINERAL TURPENTINE MARKET FOR LOW FLASH POINT, BY COUNTRY, 2021-2031 (REVENUE, $MILLION)
TABLE 24. MINERAL TURPENTINE MARKET FOR LOW FLASH POINT, BY COUNTRY, 2021-2031 (VOLUME, KILOTON)
TABLE 25. MINERAL TURPENTINE MARKET FOR REGULAR FLASH POINT, BY REGION, 2021-2031 (REVENUE, $MILLION)
TABLE 26. MINERAL TURPENTINE MARKET FOR REGULAR FLASH POINT, BY REGION, 2021-2031 (VOLUME, KILOTON)
TABLE 27. MINERAL TURPENTINE MARKET FOR REGULAR FLASH POINT, BY COUNTRY, 2021-2031 (REVENUE, $MILLION)
TABLE 28. MINERAL TURPENTINE MARKET FOR REGULAR FLASH POINT, BY COUNTRY, 2021-2031 (VOLUME, KILOTON)
TABLE 29. MINERAL TURPENTINE MARKET FOR HIGH FLASH POINT, BY REGION, 2021-2031 (REVENUE, $MILLION)
TABLE 30. MINERAL TURPENTINE MARKET FOR HIGH FLASH POINT, BY REGION, 2021-2031 (VOLUME, KILOTON)
TABLE 31. MINERAL TURPENTINE MARKET FOR HIGH FLASH POINT, BY COUNTRY, 2021-2031 (REVENUE, $MILLION)
TABLE 32. MINERAL TURPENTINE MARKET FOR HIGH FLASH POINT, BY COUNTRY, 2021-2031 (VOLUME, KILOTON)
TABLE 33. GLOBAL MINERAL TURPENTINE MARKET, BY APPLICATION, 2021-2031 (REVENUE, $MILLION)
TABLE 34. GLOBAL MINERAL TURPENTINE MARKET, BY APPLICATION, 2021-2031 (VOLUME, KILOTON)
TABLE 35. MINERAL TURPENTINE MARKET FOR PAINT THINNER, BY REGION, 2021-2031 (REVENUE, $MILLION)
TABLE 36. MINERAL TURPENTINE MARKET FOR PAINT THINNER, BY REGION, 2021-2031 (VOLUME, KILOTON)
TABLE 37. MINERAL TURPENTINE MARKET FOR PAINT THINNER, BY COUNTRY, 2021-2031 (REVENUE, $MILLION)
TABLE 38. MINERAL TURPENTINE MARKET FOR PAINT THINNER, BY COUNTRY, 2021-2031 (VOLUME, KILOTON)
TABLE 39. MINERAL TURPENTINE MARKET FOR EXTRACTION SOLVENT, BY REGION, 2021-2031 (REVENUE, $MILLION)
TABLE 40. MINERAL TURPENTINE MARKET FOR EXTRACTION SOLVENT, BY REGION, 2021-2031 (VOLUME, KILOTON)
TABLE 41. MINERAL TURPENTINE MARKET FOR EXTRACTION SOLVENT, BY COUNTRY, 2021-2031 (REVENUE, $MILLION)
TABLE 42. MINERAL TURPENTINE MARKET FOR EXTRACTION SOLVENT, BY COUNTRY, 2021-2031 (VOLUME, KILOTON)
TABLE 43. MINERAL TURPENTINE MARKET FOR CLEANING SOLVENT, BY REGION, 2021-2031 (REVENUE, $MILLION)
TABLE 44. MINERAL TURPENTINE MARKET FOR CLEANING SOLVENT, BY REGION, 2021-2031 (VOLUME, KILOTON)
TABLE 45. MINERAL TURPENTINE MARKET FOR CLEANING SOLVENT, BY COUNTRY, 2021-2031 (REVENUE, $MILLION)
TABLE 46. MINERAL TURPENTINE MARKET FOR CLEANING SOLVENT, BY COUNTRY, 2021-2031 (VOLUME, KILOTON)
TABLE 47. MINERAL TURPENTINE MARKET FOR DEGREASING SOLVENT, BY REGION, 2021-2031 (REVENUE, $MILLION)
TABLE 48. MINERAL TURPENTINE MARKET FOR DEGREASING SOLVENT, BY REGION, 2021-2031 (VOLUME, KILOTON)
TABLE 49. MINERAL TURPENTINE MARKET FOR DEGREASING SOLVENT, BY COUNTRY, 2021-2031 (REVENUE, $MILLION)
TABLE 50. MINERAL TURPENTINE MARKET FOR DEGREASING SOLVENT, BY COUNTRY, 2021-2031 (VOLUME, KILOTON)
TABLE 51. MINERAL TURPENTINE MARKET FOR OTHERS, BY REGION, 2021-2031 (REVENUE, $MILLION)
TABLE 52. MINERAL TURPENTINE MARKET FOR OTHERS, BY REGION, 2021-2031 (VOLUME, KILOTON)
TABLE 53. MINERAL TURPENTINE MARKET FOR OTHERS, BY COUNTRY, 2021-2031 (REVENUE, $MILLION)
TABLE 54. MINERAL TURPENTINE MARKET FOR OTHERS, BY COUNTRY, 2021-2031 (VOLUME, KILOTON)
TABLE 55. MINERAL TURPENTINE MARKET, BY REGION, 2021-2031 (REVENUE, $MILLION)
TABLE 56. MINERAL TURPENTINE MARKET, BY REGION, 2021-2031 (VOLUME, KILOTON)
TABLE 57. NORTH AMERICA MINERAL TURPENTINE MARKET, BY TYPE, 2021-2031 (REVENUE, $MILLION)
TABLE 58. NORTH AMERICA MINERAL TURPENTINE MARKET, BY TYPE, 2021-2031 (VOLUME, KILOTON)
TABLE 59. NORTH AMERICA MINERAL TURPENTINE MARKET, BY GRADE, 2021-2031 (REVENUE, $MILLION)
TABLE 60. NORTH AMERICA MINERAL TURPENTINE MARKET, BY GRADE, 2021-2031 (VOLUME, KILOTON)
TABLE 61. NORTH AMERICA MINERAL TURPENTINE MARKET, BY APPLICATION, 2021-2031 (REVENUE, $MILLION)
TABLE 62. NORTH AMERICA MINERAL TURPENTINE MARKET, BY APPLICATION, 2021-2031 (VOLUME, KILOTON)
TABLE 63. NORTH AMERICA MINERAL TURPENTINE MARKET, BY COUNTRY, 2021-2031 (REVENUE, $MILLION)
TABLE 64. NORTH AMERICA MINERAL TURPENTINE MARKET, BY COUNTRY, 2021-2031 (VOLUME, KILOTON)
TABLE 65. U.S. MINERAL TURPENTINE MARKET, BY TYPE, 2021-2031 (REVENUE, $MILLION)
TABLE 66. U.S. MINERAL TURPENTINE MARKET, BY TYPE, 2021-2031 (VOLUME, KILOTON)
TABLE 67. U.S. MINERAL TURPENTINE MARKET, BY GRADE, 2021-2031 (REVENUE, $MILLION)
TABLE 68. U.S. MINERAL TURPENTINE MARKET, BY GRADE, 2021-2031 (VOLUME, KILOTON)
TABLE 69. U.S. MINERAL TURPENTINE MARKET, BY APPLICATION, 2021-2031 (REVENUE, $MILLION)
TABLE 70. U.S. MINERAL TURPENTINE MARKET, BY APPLICATION, 2021-2031 (VOLUME, KILOTON)
TABLE 71. CANADA MINERAL TURPENTINE MARKET, BY TYPE, 2021-2031 (REVENUE, $MILLION)
TABLE 72. CANADA MINERAL TURPENTINE MARKET, BY TYPE, 2021-2031 (VOLUME, KILOTON)
TABLE 73. CANADA MINERAL TURPENTINE MARKET, BY GRADE, 2021-2031 (REVENUE, $MILLION)
TABLE 74. CANADA MINERAL TURPENTINE MARKET, BY GRADE, 2021-2031 (VOLUME, KILOTON)
TABLE 75. CANADA MINERAL TURPENTINE MARKET, BY APPLICATION, 2021-2031 (REVENUE, $MILLION)
TABLE 76. CANADA MINERAL TURPENTINE MARKET, BY APPLICATION, 2021-2031 (VOLUME, KILOTON)
TABLE 77. MEXICO MINERAL TURPENTINE MARKET, BY TYPE, 2021-2031 (REVENUE, $MILLION)
TABLE 78. MEXICO MINERAL TURPENTINE MARKET, BY TYPE, 2021-2031 (VOLUME, KILOTON)
TABLE 79. MEXICO MINERAL TURPENTINE MARKET, BY GRADE, 2021-2031 (REVENUE, $MILLION)
TABLE 80. MEXICO MINERAL TURPENTINE MARKET, BY GRADE, 2021-2031 (VOLUME, KILOTON)
TABLE 81. MEXICO MINERAL TURPENTINE MARKET, BY APPLICATION, 2021-2031 (REVENUE, $MILLION)
TABLE 82. MEXICO MINERAL TURPENTINE MARKET, BY APPLICATION, 2021-2031 (VOLUME, KILOTON)
TABLE 83. EUROPE MINERAL TURPENTINE MARKET, BY TYPE, 2021-2031 (REVENUE, $MILLION)
TABLE 84. EUROPE MINERAL TURPENTINE MARKET, BY TYPE, 2021-2031 (VOLUME, KILOTON)
TABLE 85. EUROPE MINERAL TURPENTINE MARKET, BY GRADE, 2021-2031 (REVENUE, $MILLION)
TABLE 86. EUROPE MINERAL TURPENTINE MARKET, BY GRADE, 2021-2031 (VOLUME, KILOTON)
TABLE 87. EUROPE MINERAL TURPENTINE MARKET, BY APPLICATION, 2021-2031 (REVENUE, $MILLION)
TABLE 88. EUROPE MINERAL TURPENTINE MARKET, BY APPLICATION, 2021-2031 (VOLUME, KILOTON)
TABLE 89. EUROPE MINERAL TURPENTINE MARKET, BY COUNTRY, 2021-2031 (REVENUE, $MILLION)
TABLE 90. EUROPE MINERAL TURPENTINE MARKET, BY COUNTRY, 2021-2031 (VOLUME, KILOTON)
TABLE 91. GERMANY MINERAL TURPENTINE MARKET, BY TYPE, 2021-2031 (REVENUE, $MILLION)
TABLE 92. GERMANY MINERAL TURPENTINE MARKET, BY TYPE, 2021-2031 (VOLUME, KILOTON)
TABLE 93. GERMANY MINERAL TURPENTINE MARKET, BY GRADE, 2021-2031 (REVENUE, $MILLION)
TABLE 94. GERMANY MINERAL TURPENTINE MARKET, BY GRADE, 2021-2031 (VOLUME, KILOTON)
TABLE 95. GERMANY MINERAL TURPENTINE MARKET, BY APPLICATION, 2021-2031 (REVENUE, $MILLION)
TABLE 96. GERMANY MINERAL TURPENTINE MARKET, BY APPLICATION, 2021-2031 (VOLUME, KILOTON)
TABLE 97. UK MINERAL TURPENTINE MARKET, BY TYPE, 2021-2031 (REVENUE, $MILLION)
TABLE 98. UK MINERAL TURPENTINE MARKET, BY TYPE, 2021-2031 (VOLUME, KILOTON)
TABLE 99. UK MINERAL TURPENTINE MARKET, BY GRADE, 2021-2031 (REVENUE, $MILLION)
TABLE 100. UK MINERAL TURPENTINE MARKET, BY GRADE, 2021-2031 (VOLUME, KILOTON)
TABLE 101. UK MINERAL TURPENTINE MARKET, BY APPLICATION, 2021-2031 (REVENUE, $MILLION)
TABLE 102. UK MINERAL TURPENTINE MARKET, BY APPLICATION, 2021-2031 (VOLUME, KILOTON)
TABLE 103. FRANCE MINERAL TURPENTINE MARKET, BY TYPE, 2021-2031 (REVENUE, $MILLION)
TABLE 104. FRANCE MINERAL TURPENTINE MARKET, BY TYPE, 2021-2031 (VOLUME, KILOTON)
TABLE 105. FRANCE MINERAL TURPENTINE MARKET, BY GRADE, 2021-2031 (REVENUE, $MILLION)
TABLE 106. FRANCE MINERAL TURPENTINE MARKET, BY GRADE, 2021-2031 (VOLUME, KILOTON)
TABLE 107. FRANCE MINERAL TURPENTINE MARKET, BY APPLICATION, 2021-2031 (REVENUE, $MILLION)
TABLE 108. FRANCE MINERAL TURPENTINE MARKET, BY APPLICATION, 2021-2031 (VOLUME, KILOTON)
TABLE 109. SPAIN MINERAL TURPENTINE MARKET, BY TYPE, 2021-2031 (REVENUE, $MILLION)
TABLE 110. SPAIN MINERAL TURPENTINE MARKET, BY TYPE, 2021-2031 (VOLUME, KILOTON)
TABLE 111. SPAIN MINERAL TURPENTINE MARKET, BY GRADE, 2021-2031 (REVENUE, $MILLION)
TABLE 112. SPAIN MINERAL TURPENTINE MARKET, BY GRADE, 2021-2031 (VOLUME, KILOTON)
TABLE 113. SPAIN MINERAL TURPENTINE MARKET, BY APPLICATION, 2021-2031 (REVENUE, $MILLION)
TABLE 114. SPAIN MINERAL TURPENTINE MARKET, BY APPLICATION, 2021-2031 (VOLUME, KILOTON)
TABLE 115. ITALY MINERAL TURPENTINE MARKET, BY TYPE, 2021-2031 (REVENUE, $MILLION)
TABLE 116. ITALY MINERAL TURPENTINE MARKET, BY TYPE, 2021-2031 (VOLUME, KILOTON)
TABLE 117. ITALY MINERAL TURPENTINE MARKET, BY GRADE, 2021-2031 (REVENUE, $MILLION)
TABLE 118. ITALY MINERAL TURPENTINE MARKET, BY GRADE, 2021-2031 (VOLUME, KILOTON)
TABLE 119. ITALY MINERAL TURPENTINE MARKET, BY APPLICATION, 2021-2031 (REVENUE, $MILLION)
TABLE 120. ITALY MINERAL TURPENTINE MARKET, BY APPLICATION, 2021-2031 (VOLUME, KILOTON)
TABLE 121. REST OF EUROPE MINERAL TURPENTINE MARKET, BY TYPE, 2021-2031 (REVENUE, $MILLION)
TABLE 122. REST OF EUROPE MINERAL TURPENTINE MARKET, BY TYPE, 2021-2031 (VOLUME, KILOTON)
TABLE 123. REST OF EUROPE MINERAL TURPENTINE MARKET, BY GRADE, 2021-2031 (REVENUE, $MILLION)
TABLE 124. REST OF EUROPE MINERAL TURPENTINE MARKET, BY GRADE, 2021-2031 (VOLUME, KILOTON)
TABLE 125. REST OF EUROPE MINERAL TURPENTINE MARKET, BY APPLICATION, 2021-2031 (REVENUE, $MILLION)
TABLE 126. REST OF EUROPE MINERAL TURPENTINE MARKET, BY APPLICATION, 2021-2031 (VOLUME, KILOTON)
TABLE 127. ASIA-PACIFIC MINERAL TURPENTINE MARKET, BY TYPE, 2021-2031 (REVENUE, $MILLION)
TABLE 128. ASIA-PACIFIC MINERAL TURPENTINE MARKET, BY TYPE, 2021-2031 (VOLUME, KILOTON)
TABLE 129. ASIA-PACIFIC MINERAL TURPENTINE MARKET, BY GRADE, 2021-2031 (REVENUE, $MILLION)
TABLE 130. ASIA-PACIFIC MINERAL TURPENTINE MARKET, BY GRADE, 2021-2031 (VOLUME, KILOTON)
TABLE 131. ASIA-PACIFIC MINERAL TURPENTINE MARKET, BY APPLICATION, 2021-2031 (REVENUE, $MILLION)
TABLE 132. ASIA-PACIFIC MINERAL TURPENTINE MARKET, BY APPLICATION, 2021-2031 (VOLUME, KILOTON)
TABLE 133. ASIA-PACIFIC MINERAL TURPENTINE MARKET, BY COUNTRY, 2021-2031 (REVENUE, $MILLION)
TABLE 134. ASIA-PACIFIC MINERAL TURPENTINE MARKET, BY COUNTRY, 2021-2031 (VOLUME, KILOTON)
TABLE 135. CHINA MINERAL TURPENTINE MARKET, BY TYPE, 2021-2031 (REVENUE, $MILLION)
TABLE 136. CHINA MINERAL TURPENTINE MARKET, BY TYPE, 2021-2031 (VOLUME, KILOTON)
TABLE 137. CHINA MINERAL TURPENTINE MARKET, BY GRADE, 2021-2031 (REVENUE, $MILLION)
TABLE 138. CHINA MINERAL TURPENTINE MARKET, BY GRADE, 2021-2031 (VOLUME, KILOTON)
TABLE 139. CHINA MINERAL TURPENTINE MARKET, BY APPLICATION, 2021-2031 (REVENUE, $MILLION)
TABLE 140. CHINA MINERAL TURPENTINE MARKET, BY APPLICATION, 2021-2031 (VOLUME, KILOTON)
TABLE 141. INDIA MINERAL TURPENTINE MARKET, BY TYPE, 2021-2031 (REVENUE, $MILLION)
TABLE 142. INDIA MINERAL TURPENTINE MARKET, BY TYPE, 2021-2031 (VOLUME, KILOTON)
TABLE 143. INDIA MINERAL TURPENTINE MARKET, BY GRADE, 2021-2031 (REVENUE, $MILLION)
TABLE 144. INDIA MINERAL TURPENTINE MARKET, BY GRADE, 2021-2031 (VOLUME, KILOTON)
TABLE 145. INDIA MINERAL TURPENTINE MARKET, BY APPLICATION, 2021-2031 (REVENUE, $MILLION)
TABLE 146. INDIA MINERAL TURPENTINE MARKET, BY APPLICATION, 2021-2031 (VOLUME, KILOTON)
TABLE 147. JAPAN MINERAL TURPENTINE MARKET, BY TYPE, 2021-2031 (REVENUE, $MILLION)
TABLE 148. JAPAN MINERAL TURPENTINE MARKET, BY TYPE, 2021-2031 (VOLUME, KILOTON)
TABLE 149. JAPAN MINERAL TURPENTINE MARKET, BY GRADE, 2021-2031 (REVENUE, $MILLION)
TABLE 150. JAPAN MINERAL TURPENTINE MARKET, BY GRADE, 2021-2031 (VOLUME, KILOTON)
TABLE 151. JAPAN MINERAL TURPENTINE MARKET, BY APPLICATION, 2021-2031 (REVENUE, $MILLION)
TABLE 152. JAPAN MINERAL TURPENTINE MARKET, BY APPLICATION, 2021-2031 (VOLUME, KILOTON)
TABLE 153. SOUTH KOREA MINERAL TURPENTINE MARKET, BY TYPE, 2021-2031 (REVENUE, $MILLION)
TABLE 154. SOUTH KOREA MINERAL TURPENTINE MARKET, BY TYPE, 2021-2031 (VOLUME, KILOTON)
TABLE 155. SOUTH KOREA MINERAL TURPENTINE MARKET, BY GRADE, 2021-2031 (REVENUE, $MILLION)
TABLE 156. SOUTH KOREA MINERAL TURPENTINE MARKET, BY GRADE, 2021-2031 (VOLUME, KILOTON)
TABLE 157. SOUTH KOREA MINERAL TURPENTINE MARKET, BY APPLICATION, 2021-2031 (REVENUE, $MILLION)
TABLE 158. SOUTH KOREA MINERAL TURPENTINE MARKET, BY APPLICATION, 2021-2031 (VOLUME, KILOTON)
TABLE 159. AUSTRALIA MINERAL TURPENTINE MARKET, BY TYPE, 2021-2031 (REVENUE, $MILLION)
TABLE 160. AUSTRALIA MINERAL TURPENTINE MARKET, BY TYPE, 2021-2031 (VOLUME, KILOTON)
TABLE 161. AUSTRALIA MINERAL TURPENTINE MARKET, BY GRADE, 2021-2031 (REVENUE, $MILLION)
TABLE 162. AUSTRALIA MINERAL TURPENTINE MARKET, BY GRADE, 2021-2031 (VOLUME, KILOTON)
TABLE 163. AUSTRALIA MINERAL TURPENTINE MARKET, BY APPLICATION, 2021-2031 (REVENUE, $MILLION)
TABLE 164. AUSTRALIA MINERAL TURPENTINE MARKET, BY APPLICATION, 2021-2031 (VOLUME, KILOTON)
TABLE 165. REST OF ASIA-PACIFIC MINERAL TURPENTINE MARKET, BY TYPE, 2021-2031 (REVENUE, $MILLION)
TABLE 166. REST OF ASIA-PACIFIC MINERAL TURPENTINE MARKET, BY TYPE, 2021-2031 (VOLUME, KILOTON)
TABLE 167. REST OF ASIA-PACIFIC MINERAL TURPENTINE MARKET, BY GRADE, 2021-2031 (REVENUE, $MILLION)
TABLE 168. REST OF ASIA-PACIFIC MINERAL TURPENTINE MARKET, BY GRADE, 2021-2031 (VOLUME, KILOTON)
TABLE 169. REST OF ASIA-PACIFIC MINERAL TURPENTINE MARKET, BY APPLICATION, 2021-2031 (REVENUE, $MILLION)
TABLE 170. REST OF ASIA-PACIFIC MINERAL TURPENTINE MARKET, BY APPLICATION, 2021-2031 (VOLUME, KILOTON)
TABLE 171. LAMEA MINERAL TURPENTINE MARKET, BY TYPE, 2021-2031 (REVENUE, $MILLION)
TABLE 172. LAMEA MINERAL TURPENTINE MARKET, BY TYPE, 2021-2031 (VOLUME, KILOTON)
TABLE 173. LAMEA MINERAL TURPENTINE MARKET, BY GRADE, 2021-2031 (REVENUE, $MILLION)
TABLE 174. LAMEA MINERAL TURPENTINE MARKET, BY GRADE, 2021-2031 (VOLUME, KILOTON)
TABLE 175. LAMEA MINERAL TURPENTINE MARKET, BY APPLICATION, 2021-2031 (REVENUE, $MILLION)
TABLE 176. LAMEA MINERAL TURPENTINE MARKET, BY APPLICATION, 2021-2031 (VOLUME, KILOTON)
TABLE 177. LAMEA MINERAL TURPENTINE MARKET, BY COUNTRY, 2021-2031 (REVENUE, $MILLION)
TABLE 178. LAMEA MINERAL TURPENTINE MARKET, BY COUNTRY, 2021-2031 (VOLUME, KILOTON)
TABLE 179. BRAZIL MINERAL TURPENTINE MARKET, BY TYPE, 2021-2031 (REVENUE, $MILLION)
TABLE 180. BRAZIL MINERAL TURPENTINE MARKET, BY TYPE, 2021-2031 (VOLUME, KILOTON)
TABLE 181. BRAZIL MINERAL TURPENTINE MARKET, BY GRADE, 2021-2031 (REVENUE, $MILLION)
TABLE 182. BRAZIL MINERAL TURPENTINE MARKET, BY GRADE, 2021-2031 (VOLUME, KILOTON)
TABLE 183. BRAZIL MINERAL TURPENTINE MARKET, BY APPLICATION, 2021-2031 (REVENUE, $MILLION)
TABLE 184. BRAZIL MINERAL TURPENTINE MARKET, BY APPLICATION, 2021-2031 (VOLUME, KILOTON)
TABLE 185. SAUDI ARABIA MINERAL TURPENTINE MARKET, BY TYPE, 2021-2031 (REVENUE, $MILLION)
TABLE 186. SAUDI ARABIA MINERAL TURPENTINE MARKET, BY TYPE, 2021-2031 (VOLUME, KILOTON)
TABLE 187. SAUDI ARABIA MINERAL TURPENTINE MARKET, BY GRADE, 2021-2031 (REVENUE, $MILLION)
TABLE 188. SAUDI ARABIA MINERAL TURPENTINE MARKET, BY GRADE, 2021-2031 (VOLUME, KILOTON)
TABLE 189. SAUDI ARABIA MINERAL TURPENTINE MARKET, BY APPLICATION, 2021-2031 (REVENUE, $MILLION)
TABLE 190. SAUDI ARABIA MINERAL TURPENTINE MARKET, BY APPLICATION, 2021-2031 (VOLUME, KILOTON)
TABLE 191. SOUTH AFRICA MINERAL TURPENTINE MARKET, BY TYPE, 2021-2031 (REVENUE, $MILLION)
TABLE 192. SOUTH AFRICA MINERAL TURPENTINE MARKET, BY TYPE, 2021-2031 (VOLUME, KILOTON)
TABLE 193. SOUTH AFRICA MINERAL TURPENTINE MARKET, BY GRADE, 2021-2031 (REVENUE, $MILLION)
TABLE 194. SOUTH AFRICA MINERAL TURPENTINE MARKET, BY GRADE, 2021-2031 (VOLUME, KILOTON)
TABLE 195. SOUTH AFRICA MINERAL TURPENTINE MARKET, BY APPLICATION, 2021-2031 (REVENUE, $MILLION)
TABLE 196. SOUTH AFRICA MINERAL TURPENTINE MARKET, BY APPLICATION, 2021-2031 (VOLUME, KILOTON)
TABLE 197. REST OF LAMEA MINERAL TURPENTINE MARKET, BY TYPE, 2021-2031 (REVENUE, $MILLION)
TABLE 198. REST OF LAMEA MINERAL TURPENTINE MARKET, BY TYPE, 2021-2031 (VOLUME, KILOTON)
TABLE 199. REST OF LAMEA MINERAL TURPENTINE MARKET, BY GRADE, 2021-2031 (REVENUE, $MILLION)
TABLE 200. REST OF LAMEA MINERAL TURPENTINE MARKET, BY GRADE, 2021-2031 (VOLUME, KILOTON)
TABLE 201. REST OF LAMEA MINERAL TURPENTINE MARKET, BY APPLICATION, 2021-2031 (REVENUE, $MILLION)
TABLE 202. REST OF LAMEA MINERAL TURPENTINE MARKET, BY APPLICATION, 2021-2031 (VOLUME, KILOTON)
TABLE 203.SYDNEY SOLVENTS: COMPANY SNAPSHOT
TABLE 204.SYDNEY SOLVENTS: OPERATING SEGMENTS
TABLE 205.SYDNEY SOLVENTS: PRODUCT PORTFOLIO
TABLE 206.SYDNEY SOLVENTS: NET SALES
TABLE 207.SYDNEY SOLVENTS: KEY STRATERGIES
TABLE 208.GLOBAL PETRO: COMPANY SNAPSHOT
TABLE 209.GLOBAL PETRO: OPERATING SEGMENTS
TABLE 210.GLOBAL PETRO: PRODUCT PORTFOLIO
TABLE 211.GLOBAL PETRO: NET SALES
TABLE 212.GLOBAL PETRO: KEY STRATERGIES
TABLE 213.POWERZONE OIL: COMPANY SNAPSHOT
TABLE 214.POWERZONE OIL: OPERATING SEGMENTS
TABLE 215.POWERZONE OIL: PRODUCT PORTFOLIO
TABLE 216.POWERZONE OIL: NET SALES
TABLE 217.POWERZONE OIL: KEY STRATERGIES
TABLE 218.GSB CHEMICAL CO. PTY. LTD: COMPANY SNAPSHOT
TABLE 219.GSB CHEMICAL CO. PTY. LTD: OPERATING SEGMENTS
TABLE 220.GSB CHEMICAL CO. PTY. LTD: PRODUCT PORTFOLIO
TABLE 221.GSB CHEMICAL CO. PTY. LTD: NET SALES
TABLE 222.GSB CHEMICAL CO. PTY. LTD: KEY STRATERGIES
TABLE 223.HINDUSTAN PETROLEUM CORPORATION LIMITED: COMPANY SNAPSHOT
TABLE 224.HINDUSTAN PETROLEUM CORPORATION LIMITED: OPERATING SEGMENTS
TABLE 225.HINDUSTAN PETROLEUM CORPORATION LIMITED: PRODUCT PORTFOLIO
TABLE 226.HINDUSTAN PETROLEUM CORPORATION LIMITED: NET SALES
TABLE 227.HINDUSTAN PETROLEUM CORPORATION LIMITED: KEY STRATERGIES
TABLE 228.BHARAT PETROLEUM CORPORATION LIMITED: COMPANY SNAPSHOT
TABLE 229.BHARAT PETROLEUM CORPORATION LIMITED: OPERATING SEGMENTS
TABLE 230.BHARAT PETROLEUM CORPORATION LIMITED: PRODUCT PORTFOLIO
TABLE 231.BHARAT PETROLEUM CORPORATION LIMITED: NET SALES
TABLE 232.BHARAT PETROLEUM CORPORATION LIMITED: KEY STRATERGIES
TABLE 233.AL SANEA: COMPANY SNAPSHOT
TABLE 234.AL SANEA: OPERATING SEGMENTS
TABLE 235.AL SANEA: PRODUCT PORTFOLIO
TABLE 236.AL SANEA: NET SALES
TABLE 237.AL SANEA: KEY STRATERGIES
TABLE 238.INDIAN OIL CORPORATION LTD: COMPANY SNAPSHOT
TABLE 239.INDIAN OIL CORPORATION LTD: OPERATING SEGMENTS
TABLE 240.INDIAN OIL CORPORATION LTD: PRODUCT PORTFOLIO
TABLE 241.INDIAN OIL CORPORATION LTD: NET SALES
TABLE 242.INDIAN OIL CORPORATION LTD: KEY STRATERGIES
TABLE 243.ALSHALL INTERNATIONAL CO.: COMPANY SNAPSHOT
TABLE 244.ALSHALL INTERNATIONAL CO.: OPERATING SEGMENTS
TABLE 245.ALSHALL INTERNATIONAL CO.: PRODUCT PORTFOLIO
TABLE 246.ALSHALL INTERNATIONAL CO.: NET SALES
TABLE 247.ALSHALL INTERNATIONAL CO.: KEY STRATERGIES
TABLE 248.DHC SOLVENT CHEMIE GMBH: COMPANY SNAPSHOT
TABLE 249.DHC SOLVENT CHEMIE GMBH: OPERATING SEGMENTS
TABLE 250.DHC SOLVENT CHEMIE GMBH: PRODUCT PORTFOLIO
TABLE 251.DHC SOLVENT CHEMIE GMBH: NET SALES
TABLE 252.DHC SOLVENT CHEMIE GMBH: KEY STRATERGIES LIST OF FIGURES
FIGURE 1.MINERAL TURPENTINE MARKET SEGMENTATION
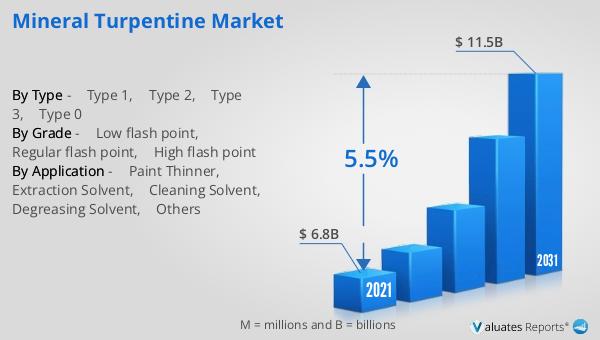
FIGURE 2.MINERAL TURPENTINE MARKET,2021-2031
FIGURE 3.MINERAL TURPENTINE MARKET,2021-2031
FIGURE 4. TOP INVESTMENT POCKETS, BY REGION
FIGURE 5.PORTER FIVE-1
FIGURE 6.PORTER FIVE-2
FIGURE 7.PORTER FIVE-3
FIGURE 8.PORTER FIVE-4
FIGURE 9.PORTER FIVE-5
FIGURE 10.TOP PLAYER POSITIONING
FIGURE 11.MINERAL TURPENTINE MARKET:DRIVERS, RESTRAINTS AND OPPORTUNITIES
FIGURE 12.PRICING ANALYSIS
FIGURE 13.VALUE CHAIN ANALYSIS
FIGURE 14.KEY REGULATION ANALYSIS
FIGURE 15.PATENT ANALYSIS BY COMPANY
FIGURE 16.PATENT ANALYSIS BY COUNTRY
FIGURE 17.MINERAL TURPENTINE MARKET,BY TYPE,2021(%)
FIGURE 18.COMPARATIVE SHARE ANALYSIS OF TYPE 1 MINERAL TURPENTINE MARKET,2021-2031(%)
FIGURE 19.COMPARATIVE SHARE ANALYSIS OF TYPE 2 MINERAL TURPENTINE MARKET,2021-2031(%)
FIGURE 20.COMPARATIVE SHARE ANALYSIS OF TYPE 3 MINERAL TURPENTINE MARKET,2021-2031(%)
FIGURE 21.COMPARATIVE SHARE ANALYSIS OF TYPE 0 MINERAL TURPENTINE MARKET,2021-2031(%)
FIGURE 22.MINERAL TURPENTINE MARKET,BY GRADE,2021(%)
FIGURE 23.COMPARATIVE SHARE ANALYSIS OF LOW FLASH POINT MINERAL TURPENTINE MARKET,2021-2031(%)
FIGURE 24.COMPARATIVE SHARE ANALYSIS OF REGULAR FLASH POINT MINERAL TURPENTINE MARKET,2021-2031(%)
FIGURE 25.COMPARATIVE SHARE ANALYSIS OF HIGH FLASH POINT MINERAL TURPENTINE MARKET,2021-2031(%)
FIGURE 26.MINERAL TURPENTINE MARKET,BY APPLICATION,2021(%)
FIGURE 27.COMPARATIVE SHARE ANALYSIS OF PAINT THINNER MINERAL TURPENTINE MARKET,2021-2031(%)
FIGURE 28.COMPARATIVE SHARE ANALYSIS OF EXTRACTION SOLVENT MINERAL TURPENTINE MARKET,2021-2031(%)
FIGURE 29.COMPARATIVE SHARE ANALYSIS OF CLEANING SOLVENT MINERAL TURPENTINE MARKET,2021-2031(%)
FIGURE 30.COMPARATIVE SHARE ANALYSIS OF DEGREASING SOLVENT MINERAL TURPENTINE MARKET,2021-2031(%)
FIGURE 31.COMPARATIVE SHARE ANALYSIS OF OTHERS MINERAL TURPENTINE MARKET,2021-2031(%)
FIGURE 32.MINERAL TURPENTINE MARKET BY REGION,2021
FIGURE 33.U.S. MINERAL TURPENTINE MARKET,2021-2031($MILLION)
FIGURE 34.CANADA MINERAL TURPENTINE MARKET,2021-2031($MILLION)
FIGURE 35.MEXICO MINERAL TURPENTINE MARKET,2021-2031($MILLION)
FIGURE 36.GERMANY MINERAL TURPENTINE MARKET,2021-2031($MILLION)
FIGURE 37.UK MINERAL TURPENTINE MARKET,2021-2031($MILLION)
FIGURE 38.FRANCE MINERAL TURPENTINE MARKET,2021-2031($MILLION)
FIGURE 39.SPAIN MINERAL TURPENTINE MARKET,2021-2031($MILLION)
FIGURE 40.ITALY MINERAL TURPENTINE MARKET,2021-2031($MILLION)
FIGURE 41.REST OF EUROPE MINERAL TURPENTINE MARKET,2021-2031($MILLION)
FIGURE 42.CHINA MINERAL TURPENTINE MARKET,2021-2031($MILLION)
FIGURE 43.INDIA MINERAL TURPENTINE MARKET,2021-2031($MILLION)
FIGURE 44.JAPAN MINERAL TURPENTINE MARKET,2021-2031($MILLION)
FIGURE 45.SOUTH KOREA MINERAL TURPENTINE MARKET,2021-2031($MILLION)
FIGURE 46.AUSTRALIA MINERAL TURPENTINE MARKET,2021-2031($MILLION)
FIGURE 47.REST OF ASIA-PACIFIC MINERAL TURPENTINE MARKET,2021-2031($MILLION)
FIGURE 48.BRAZIL MINERAL TURPENTINE MARKET,2021-2031($MILLION)
FIGURE 49.SAUDI ARABIA MINERAL TURPENTINE MARKET,2021-2031($MILLION)
FIGURE 50.SOUTH AFRICA MINERAL TURPENTINE MARKET,2021-2031($MILLION)
FIGURE 51.REST OF LAMEA MINERAL TURPENTINE MARKET,2021-2031($MILLION)
FIGURE 52. TOP WINNING STRATEGIES, BY YEAR
FIGURE 53. TOP WINNING STRATEGIES, BY DEVELOPMENT
FIGURE 54. TOP WINNING STRATEGIES, BY COMPANY
FIGURE 55.PRODUCT MAPPING OF TOP 10 PLAYERS
FIGURE 56.COMPETITIVE DASHBOARD
FIGURE 57.COMPETITIVE HEATMAP OF TOP 10 KEY PLAYERS
FIGURE 58.SYDNEY SOLVENTS.: NET SALES ($MILLION)
FIGURE 59.GLOBAL PETRO.: NET SALES ($MILLION)
FIGURE 60.POWERZONE OIL.: NET SALES ($MILLION)
FIGURE 61.GSB CHEMICAL CO. PTY. LTD.: NET SALES ($MILLION)
FIGURE 62.HINDUSTAN PETROLEUM CORPORATION LIMITED.: NET SALES ($MILLION)
FIGURE 63.BHARAT PETROLEUM CORPORATION LIMITED.: NET SALES ($MILLION)
FIGURE 64.AL SANEA.: NET SALES ($MILLION)
FIGURE 65.INDIAN OIL CORPORATION LTD.: NET SALES ($MILLION)
FIGURE 66.ALSHALL INTERNATIONAL CO..: NET SALES ($MILLION)
FIGURE 67.DHC SOLVENT CHEMIE GMBH.: NET SALES ($MILLION
SELECT A FORMAT
Added to Cart
Electronic (PDF)

$5730

This license allows only one user to access the PDF.
Electronic (PDF)

$6450

This license allows 1 - 5 user to access the PDF, license is suitable for small groups of 5 users working together
Electronic (PDF)

$9600

This license allows users/teams in a same Enterprise to use this report, various departments within an enterpise can use this report
Electronic (PDF)

$3840

This license just provides quantitative data in a excel sheet
Add to Cart
Buy Now (15% Discount)

OUR CUSTOMER

SIS Group of Schools

SIMILAR REPORTS


RELATED REPORTS

Global Resorcinol Formaldehyde Adhesive Resin Market Research Report 2025

120 Pages
Type: Report
Code: QYRE-Auto-19T20220
Wed Dec 03 00:00:00 UTC 2025

Add to Cart

Global Low-Sludge Phosphating Solution Market Research Report 2025

120 Pages
Type: Report
Code: QYRE-Auto-33H20007
Wed Dec 03 00:00:00 UTC 2025

Add to Cart

Global Linear Alpha-Olefin Market Research Report 2025

120 Pages
Type: Report
Code: QYRE-Auto-5Y6896
Wed Dec 03 00:00:00 UTC 2025

Add to Cart

Global Nodulizer Cored Wire Market Research Report 2025

120 Pages
Type: Report
Code: QYRE-Auto-10G20315
Wed Dec 03 00:00:00 UTC 2025

Add to Cart