0
U.S. (TOLL FREE)
+1 (315) 215-3225
Automative

0
U.S. (TOLL FREE)
+1 (315) 215-3225
Free Space Optic Communication Market By Platform (Space, Airborne, Ground), By Component (Transmitter, Transceiver, Receiver, Others), By Application (Mobile Backhaul, Disaster Recovery, Enterprise Connectivity, Defense, Satellite, Others): Global Opportunity Analysis and Industry Forecast, 2021-2031
Published Date: March 2023
|
Report Code: ALLI-Auto-3Y772
Home | Market Reports | Internet & Telecom| Communications Equipment
Free Space Optic Communication Market By Platform Space Airborne Ground By Component Transmitter Transceiver Receiver Others By Application Mobile Backhaul Disaster Recovery Enterprise Connectivity Defense Satellite Others Global Opportunity Analysis and Industry Forecast 2021 2031
BUY CHAPTERS

Free Space Optic Communication Market By Platform (Space, Airborne, Ground), By Component (Transmitter, Transceiver, Receiver, Others), By Application (Mobile Backhaul, Disaster Recovery, Enterprise Connectivity, Defense, Satellite, Others): Global Opportunity Analysis and Industry Forecast, 2021-2031

Code: ALLI-Auto-3Y772
Report
March 2023
Pages:235
Allied Market Research
Buy Now with 15% Discount
DESCRIPTION
TABLE OF CONTENT
TABLES & FIGURES

Free Space Optic Communication Market Size

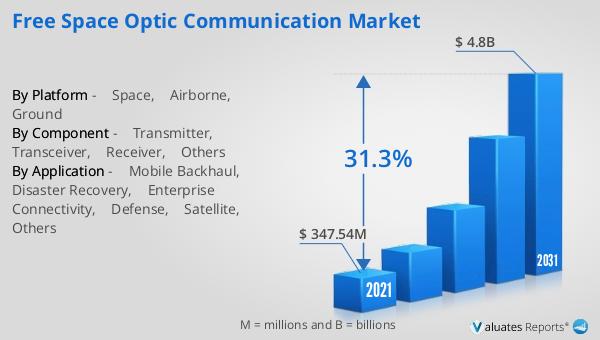
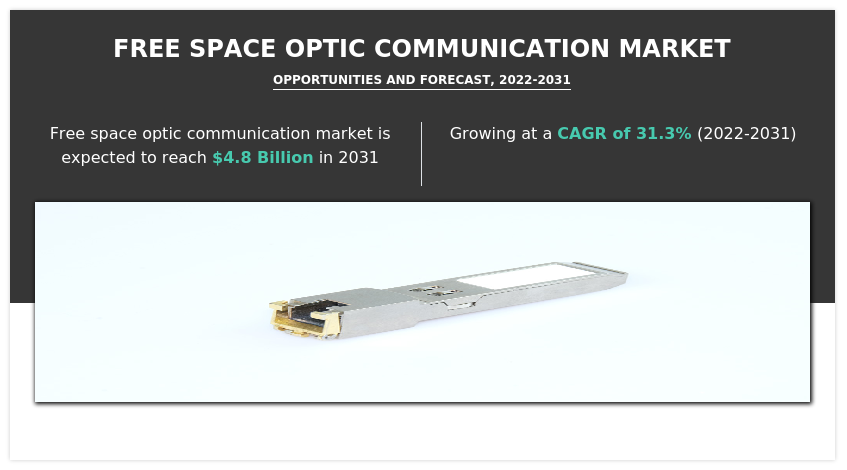
According to a new report published by , titled, “Free Space Optic Communication Market," The free space optic communication market was valued at $347.54 million in 2021, and is estimated to reach $4.8 billion by 2031, growing at a CAGR of 31.3% from 2022 to 2031.

Free Space Optic Communication Market

Free Space Optic Communication Market

The free space optic communication uses beams of light to transmit data wirelessly through the atmosphere. FSO communication technology provides a secure, high-speed, and cost-effective alternative to traditional wired or wireless communication methods, making it an attractive solution for various applications. FSO communication technology provides several advantages over traditional wired or wireless communication methods, such as high bandwidth, low latency, and secure transmission. FSO communication systems can achieve data rates of up to several gigabits per second, making them suitable for high-speed data transmission applications, such as mobile backhaul, enterprise connectivity, defense, and security.
The free space optic communication market is driven by the increase in demand for high-speed data transmission, need for secure communication channels, and rise in adoption of 5G technology. FSO communication systems can achieve data rates of up to several gigabits per second, making them suitable for applications such as mobile backhaul, enterprise connectivity, healthcare, defense, and security. The free space optic communication market is expected to grow at a significant pace during the forecast period owing to the surge in need for reliable and quick wireless communication as well as increase in demand for widespread digital connectivity.
A primary opportunity in the free space optic communication market stems from its superior data transmission security. The wireless communication system is currently available at a premium, and optical fiber systems are often expensive and difficult to install, while free-space optical communication (FSOC) systems are an attractive alternative for point-to-point telecommunications. This is driving the IT and telecommunication segment of the free space optics communication market. Increase in development of private LTE networks, as well as the necessity for secured and high-speed optical communications, are projected to fuel market growth throughout the forecast period. Moreover, rise in requirements for last-mile connection and continued growth for alternatives to RF technology for outdoor connectivity are projected to propel the market growth.
The free space optic communication market is segmented on the basis of platform, component, application, and region. On the basis of platform, it is segmented into ground, space, and airborne. In terms of market segmentation by platform, the market was dominated by ground segment in 2021, whereas the space segment is expected to witness a higher growth rate during the forecast period. On the basis of component, the market is segmented into transmitter, transceiver, receiver, and others. In terms of market segmentation by component, the market was dominated by the transceiver segment in 2021, whereas the receiver segment is expected to witness a higher growth rate during the forecast period. In terms of application, the market is segmented into mobile backhaul, disaster recovery, enterprise connectivity, defense, satellite, and others. In terms of market segmentation by application, the market was dominated by mobile backhaul segment in 2021, whereas the defense segment is expected to witness a higher growth rate during the forecast period. In terms of region, the market is divided into North America (the U.S., Canada, and Mexico), Europe (the UK, Germany, France, and rest of Europe), Asia-Pacific (China, Japan, India, South Korea, and rest of Asia-Pacific), and LAMEA (Latin America, Middle East, and Africa). In terms of region, the market was dominated by North America in 2021, which is also expected to grow at a faster rate during the forecast period.
Key Market Insights
In 2021, the ground segment in the platform segmentation accounted for highest revenue and is expected to reach $2,211.29 million by 2031 at a CAGR of 31.87%, while the space segment is projected to expand at a faster CAGR of 32.49% during the forecast period.
In 2021, the transceiver segment in the component segmentation accounted for maximum revenue and is likely to touch $2,379.36 million at 32.05% CAGR by 2031, while the receiver segment is estimated to grow at a faster 32.52% CAGR during the forecast period.
In 2021, the mobile backhaul segment in the application segmentation garnered the largest market share and is estimated to be at $1482.36 million by 2031 at 31.79% CAGR, while the defense segment is likely to witness the higher expansion rate of 33.01% during the forecast period.
In 2021, North America contributed for a significant share of the free space optic communication market and is expected to touch $2126.33 million at 32.86% CAGR, and it is also expected to expand at the fastest rate during the forecast years.
The free space optic communication market players profiled in the report include EC System, FSONA Networks Corp., Axiom Optics, Wireless Excellence Limited, QinetiQ, ViaSat, Inc., Mostcom JSC, Mynaric, Collinear and Plaintree Systems Inc. Various strategies such as collaborations & partnerships, product launches, and acquisitions have been adopted by market players to expand their foothold in the digital multimeters market. For instance, in March 2022, Mynaric signed an agreement with Northrop Grumman for delivery of optical communication terminals in the framework of a U.S. government space program led by the Space Development Agency.

Overview

The free space optic communication market size was valued at $347.54 million in 2021, and is projected to reach $4,787.96 million by 2031, registering a CAGR of 31.26%. Free space optic (FSO) communication is the wireless transmission of data via a modulated optical beam directed through free space, without fiber optics or other optical systems guiding the light. These types of communication systems are uniquely valuable in enabling fast and secure connectivity, both in terrestrial and non-terrestrial networks. The general idea of free-space optics relies on the transmission of invisible, eye-safe light beams. They are transmitted by a laser with light focused onto a highly sensitive photon detector, which serves as a receiver, equipped with a telescopic lens. FSO links have quite a simple construction, typically consisting of two identical heads enabling duplex data transmission. These heads are connected via interfaces directly to computers or with a telecommunications network.
The scope of the report discusses the potential opportunities for the key players to enter the free space optic communication market. Furthermore, it provides an in-depth analysis of the market, outlining current trends, key driving factors, and key areas of investment. The report includes Porter’s five forces analysis to understand the competitive scenario of the industry and role of each stakeholder in the value chain. Moreover, it features the strategies adopted by key market players to maintain their foothold in the market.
The free space optic communication market is segmented on the basis of platform, component, application, and region. On the basis of platform, it is segmented into ground, space, and airborne. On the basis of component, the market is segmented into transmitter, transceiver, receiver, and others. In terms of application, the market is segmented into mobile backhaul, disaster recovery, enterprise connectivity, defense, satellite, and others. In terms of region, the market is divided into North America, Europe, Asia-Pacific, and LAMEA.
The free space optic communication market is driven by the increase in demand for high-speed data transmission, need for secure communication channels, and rise in adoption of 5G technology. FSO communication systems can achieve data rates of up to several gigabits per second, making them suitable for applications such as mobile backhaul, enterprise connectivity, healthcare, defense, and security. The free space optic communication market is expected to grow at a significant pace during the forecast period owing to the surge in need for reliable and quick wireless communication as well as increase in demand for widespread digital connectivity.
The free space optic communication market players profiled in the report include EC System, FSONA Networks Corp., Axiom Optics, Wireless Excellence Limited, QinetiQ, ViaSat, Inc., Mostcom JSC, Mynaric, Collinear and Plaintree Systems Inc. These key players adopt several strategies such as new product launch and development, acquisition, partnership and collaboration and business expansion to increase their market share in the global digital multimeter market during the forecast period.

Key Benefits For Stakeholders

●This report provides a quantitative analysis of the market segments, current trends, estimations, and dynamics of the free space optic communication market analysis from 2021 to 2031 to identify the prevailing free space optic communication market opportunities.
●The market research is offered along with information related to key drivers, restraints, and opportunities.
●Porter's five forces analysis highlights the potency of buyers and suppliers to enable stakeholders make profit-oriented business decisions and strengthen their supplier-buyer network.
●In-depth analysis of the free space optic communication market segmentation assists to determine the prevailing market opportunities.
●Major countries in each region are mapped according to their revenue contribution to the global market.
●Market player positioning facilitates benchmarking and provides a clear understanding of the present position of the market players.
●The report includes the analysis of the regional as well as global free space optic communication market trends, key players, market segments, application areas, and market growth strategies.
Key Market Segments
○ EC Syste

Scope of Free Space Optic Communication Market Report

Report Metric Details
Report Name Free Space Optic Communication Market
Accounted market size in 2021 $ 347.54 million
Forecasted market size in 2031 $ 4.8 billion
CAGR 31.3%
Base Year 2021
Forecasted years 2024 - 2031
By Platform ● Space
● Airborne
● Ground
By Component ● Transmitter
● Transceiver
● Receiver
● Others
By Application ● Mobile Backhaul
● Disaster Recovery
● Enterprise Connectivity
● Defense
● Satellite
● Others
By Region
  • North America (United States, Canada)
  • Europe (Germany, France, UK, Italy, Russia) Rest of Europe
  • Nordic Countries
  • Asia-Pacific (China, Japan, South Korea)
  • Southeast Asia (India, Australia)
  • Rest of Asia
  • Latin America (Mexico, Brazil)
  • Rest of Latin America
  • Middle East & Africa (Turkey, Saudi Arabia, UAE, Rest of MEA)
Forecast units USD million in value
Report coverage Revenue and volume forecast, company share, competitive landscape, growth factors and trends

FAQ for this report

How fast is Free Space Optic Communication Market growing?

Ans: The Free Space Optic Communication Market witnessing a CAGR of 31.3% during the forecast period 2024-2031.

What is the Free Space Optic Communication Market size in 2031?

Ans: The Free Space Optic Communication Market size in 2031 will be $ 4.8 billion.

What are the Application segmentation covered in the Free Space Optic Communication Market report?

Ans: The Applications covered in the Free Space Optic Communication Market report are ● Mobile Backhaul, ● Disaster Recovery, ● Enterprise Connectivity, ● Defense, ● Satellite, ● Others

CHAPTER 1: INTRODUCTION
1.1. Report description
1.2. Key market segments
1.3. Key benefits to the stakeholders
1.4. Research Methodology
1.4.1. Primary research
1.4.2. Secondary research
1.4.3. Analyst tools and models
CHAPTER 2: EXECUTIVE SUMMARY
2.1. CXO Perspective
CHAPTER 3: MARKET OVERVIEW
3.1. Market definition and scope
3.2. Key findings
3.2.1. Top impacting factors
3.2.2. Top investment pockets
3.3. Porter’s five forces analysis
3.3.1. Bargaining power of suppliers
3.3.2. Bargaining power of buyers
3.3.3. Threat of substitutes
3.3.4. Threat of new entrants
3.3.5. Intensity of rivalry
3.4. Market dynamics
3.4.1. Drivers
3.4.1.1. Increase in adoption of free space optic communication technology in military applications to fuel market
3.4.1.2. Increase in adoption of free space optic communication system for data transmission
3.4.2. Restraints
3.4.2.1. Atmospheric loss due to carbon dioxide and water molecules
3.4.3. Opportunities
3.4.3.1. Superior data transmission security boosts adoption of FSO communication in it and telecommunication industry
3.5. COVID-19 Impact Analysis on the market
CHAPTER 4: FREE SPACE OPTIC COMMUNICATION MARKET, BY PLATFORM
4.1. Overview
4.1.1. Market size and forecast
4.2. Space
4.2.1. Key market trends, growth factors and opportunities
4.2.2. Market size and forecast, by region
4.2.3. Market share analysis by country
4.3. Airborne
4.3.1. Key market trends, growth factors and opportunities
4.3.2. Market size and forecast, by region
4.3.3. Market share analysis by country
4.4. Ground
4.4.1. Key market trends, growth factors and opportunities
4.4.2. Market size and forecast, by region
4.4.3. Market share analysis by country
CHAPTER 5: FREE SPACE OPTIC COMMUNICATION MARKET, BY COMPONENT
5.1. Overview
5.1.1. Market size and forecast
5.2. Transmitter
5.2.1. Key market trends, growth factors and opportunities
5.2.2. Market size and forecast, by region
5.2.3. Market share analysis by country
5.3. Transceiver
5.3.1. Key market trends, growth factors and opportunities
5.3.2. Market size and forecast, by region
5.3.3. Market share analysis by country
5.4. Receiver
5.4.1. Key market trends, growth factors and opportunities
5.4.2. Market size and forecast, by region
5.4.3. Market share analysis by country
5.5. Others
5.5.1. Key market trends, growth factors and opportunities
5.5.2. Market size and forecast, by region
5.5.3. Market share analysis by country
CHAPTER 6: FREE SPACE OPTIC COMMUNICATION MARKET, BY APPLICATION
6.1. Overview
6.1.1. Market size and forecast
6.2. Mobile Backhaul
6.2.1. Key market trends, growth factors and opportunities
6.2.2. Market size and forecast, by region
6.2.3. Market share analysis by country
6.3. Disaster Recovery
6.3.1. Key market trends, growth factors and opportunities
6.3.2. Market size and forecast, by region
6.3.3. Market share analysis by country
6.4. Enterprise Connectivity
6.4.1. Key market trends, growth factors and opportunities
6.4.2. Market size and forecast, by region
6.4.3. Market share analysis by country
6.5. Defense
6.5.1. Key market trends, growth factors and opportunities
6.5.2. Market size and forecast, by region
6.5.3. Market share analysis by country
6.6. Satellite
6.6.1. Key market trends, growth factors and opportunities
6.6.2. Market size and forecast, by region
6.6.3. Market share analysis by country
6.7. Others
6.7.1. Key market trends, growth factors and opportunities
6.7.2. Market size and forecast, by region
6.7.3. Market share analysis by country
CHAPTER 7: FREE SPACE OPTIC COMMUNICATION MARKET, BY REGION
7.1. Overview
7.1.1. Market size and forecast By Region
7.2. North America
7.2.1. Key trends and opportunities
7.2.2. Market size and forecast, by Platform
7.2.3. Market size and forecast, by Component
7.2.4. Market size and forecast, by Application
7.2.5. Market size and forecast, by country
7.2.5.1. U.S.
7.2.5.1.1. Key market trends, growth factors and opportunities
7.2.5.1.2. Market size and forecast, by Platform
7.2.5.1.3. Market size and forecast, by Component
7.2.5.1.4. Market size and forecast, by Application
7.2.5.2. Canada
7.2.5.2.1. Key market trends, growth factors and opportunities
7.2.5.2.2. Market size and forecast, by Platform
7.2.5.2.3. Market size and forecast, by Component
7.2.5.2.4. Market size and forecast, by Application
7.2.5.3. Mexico
7.2.5.3.1. Key market trends, growth factors and opportunities
7.2.5.3.2. Market size and forecast, by Platform
7.2.5.3.3. Market size and forecast, by Component
7.2.5.3.4. Market size and forecast, by Application
7.3. Europe
7.3.1. Key trends and opportunities
7.3.2. Market size and forecast, by Platform
7.3.3. Market size and forecast, by Component
7.3.4. Market size and forecast, by Application
7.3.5. Market size and forecast, by country
7.3.5.1. UK
7.3.5.1.1. Key market trends, growth factors and opportunities
7.3.5.1.2. Market size and forecast, by Platform
7.3.5.1.3. Market size and forecast, by Component
7.3.5.1.4. Market size and forecast, by Application
7.3.5.2. Germany
7.3.5.2.1. Key market trends, growth factors and opportunities
7.3.5.2.2. Market size and forecast, by Platform
7.3.5.2.3. Market size and forecast, by Component
7.3.5.2.4. Market size and forecast, by Application
7.3.5.3. France
7.3.5.3.1. Key market trends, growth factors and opportunities
7.3.5.3.2. Market size and forecast, by Platform
7.3.5.3.3. Market size and forecast, by Component
7.3.5.3.4. Market size and forecast, by Application
7.3.5.4. Rest of Europe
7.3.5.4.1. Key market trends, growth factors and opportunities
7.3.5.4.2. Market size and forecast, by Platform
7.3.5.4.3. Market size and forecast, by Component
7.3.5.4.4. Market size and forecast, by Application
7.4. Asia-Pacific
7.4.1. Key trends and opportunities
7.4.2. Market size and forecast, by Platform
7.4.3. Market size and forecast, by Component
7.4.4. Market size and forecast, by Application
7.4.5. Market size and forecast, by country
7.4.5.1. China
7.4.5.1.1. Key market trends, growth factors and opportunities
7.4.5.1.2. Market size and forecast, by Platform
7.4.5.1.3. Market size and forecast, by Component
7.4.5.1.4. Market size and forecast, by Application
7.4.5.2. Japan
7.4.5.2.1. Key market trends, growth factors and opportunities
7.4.5.2.2. Market size and forecast, by Platform
7.4.5.2.3. Market size and forecast, by Component
7.4.5.2.4. Market size and forecast, by Application
7.4.5.3. India
7.4.5.3.1. Key market trends, growth factors and opportunities
7.4.5.3.2. Market size and forecast, by Platform
7.4.5.3.3. Market size and forecast, by Component
7.4.5.3.4. Market size and forecast, by Application
7.4.5.4. South Korea
7.4.5.4.1. Key market trends, growth factors and opportunities
7.4.5.4.2. Market size and forecast, by Platform
7.4.5.4.3. Market size and forecast, by Component
7.4.5.4.4. Market size and forecast, by Application
7.4.5.5. Rest of Asia-Pacific
7.4.5.5.1. Key market trends, growth factors and opportunities
7.4.5.5.2. Market size and forecast, by Platform
7.4.5.5.3. Market size and forecast, by Component
7.4.5.5.4. Market size and forecast, by Application
7.5. LAMEA
7.5.1. Key trends and opportunities
7.5.2. Market size and forecast, by Platform
7.5.3. Market size and forecast, by Component
7.5.4. Market size and forecast, by Application
7.5.5. Market size and forecast, by country
7.5.5.1. Latin America
7.5.5.1.1. Key market trends, growth factors and opportunities
7.5.5.1.2. Market size and forecast, by Platform
7.5.5.1.3. Market size and forecast, by Component
7.5.5.1.4. Market size and forecast, by Application
7.5.5.2. Middle East
7.5.5.2.1. Key market trends, growth factors and opportunities
7.5.5.2.2. Market size and forecast, by Platform
7.5.5.2.3. Market size and forecast, by Component
7.5.5.2.4. Market size and forecast, by Application
7.5.5.3. Africa
7.5.5.3.1. Key market trends, growth factors and opportunities
7.5.5.3.2. Market size and forecast, by Platform
7.5.5.3.3. Market size and forecast, by Component
7.5.5.3.4. Market size and forecast, by Application
CHAPTER 8: COMPETITIVE LANDSCAPE
8.1. Introduction
8.2. Top winning strategies
8.3. Product Mapping of Top 10 Player
8.4. Competitive Dashboard
8.5. Competitive Heatmap
8.6. Top player positioning, 2021
CHAPTER 9: COMPANY PROFILES
9.1. EC System
9.1.1. Company overview
9.1.2. Key Executives
9.1.3. Company snapshot
9.1.4. Operating business segments
9.1.5. Product portfolio
9.2. FSONA Networks Corporation
9.2.1. Company overview
9.2.2. Key Executives
9.2.3. Company snapshot
9.2.4. Operating business segments
9.2.5. Product portfolio
9.3. Axiom Optics
9.3.1. Company overview
9.3.2. Key Executives
9.3.3. Company snapshot
9.3.4. Operating business segments
9.3.5. Product portfolio
9.4. Wireless Excellence Limited
9.4.1. Company overview
9.4.2. Key Executives
9.4.3. Company snapshot
9.4.4. Operating business segments
9.4.5. Product portfolio
9.5. QinetiQ Group plc
9.5.1. Company overview
9.5.2. Key Executives
9.5.3. Company snapshot
9.5.4. Operating business segments
9.5.5. Product portfolio
9.5.6. Business performance
9.5.7. Key strategic moves and developments
9.6. ViaSat, Inc.
9.6.1. Company overview
9.6.2. Key Executives
9.6.3. Company snapshot
9.6.4. Operating business segments
9.6.5. Product portfolio
9.6.6. Business performance
9.7. Mostcom JSC
9.7.1. Company overview
9.7.2. Key Executives
9.7.3. Company snapshot
9.7.4. Operating business segments
9.7.5. Product portfolio
9.8. mynaric
9.8.1. Company overview
9.8.2. Key Executives
9.8.3. Company snapshot
9.8.4. Operating business segments
9.8.5. Product portfolio
9.8.6. Business performance
9.8.7. Key strategic moves and developments
9.9. Collinear
9.9.1. Company overview
9.9.2. Key Executives
9.9.3. Company snapshot
9.9.4. Operating business segments
9.9.5. Product portfolio
9.9.6. Business performance
9.10. Plaintree Systems Inc.
9.10.1. Company overview
9.10.2. Key Executives
9.10.3. Company snapshot
9.10.4. Operating business segments
9.10.5. Product portfolio
9.10.6. Business performanc
LIST OF TABLES
TABLE 01. GLOBAL FREE SPACE OPTIC COMMUNICATION MARKET, BY PLATFORM, 2021-2031 ($MILLION)
TABLE 02. FREE SPACE OPTIC COMMUNICATION MARKET FOR SPACE, BY REGION, 2021-2031 ($MILLION)
TABLE 03. FREE SPACE OPTIC COMMUNICATION MARKET FOR AIRBORNE, BY REGION, 2021-2031 ($MILLION)
TABLE 04. FREE SPACE OPTIC COMMUNICATION MARKET FOR GROUND, BY REGION, 2021-2031 ($MILLION)
TABLE 05. GLOBAL FREE SPACE OPTIC COMMUNICATION MARKET, BY COMPONENT, 2021-2031 ($MILLION)
TABLE 06. FREE SPACE OPTIC COMMUNICATION MARKET FOR TRANSMITTER, BY REGION, 2021-2031 ($MILLION)
TABLE 07. FREE SPACE OPTIC COMMUNICATION MARKET FOR TRANSCEIVER, BY REGION, 2021-2031 ($MILLION)
TABLE 08. FREE SPACE OPTIC COMMUNICATION MARKET FOR RECEIVER, BY REGION, 2021-2031 ($MILLION)
TABLE 09. FREE SPACE OPTIC COMMUNICATION MARKET FOR OTHERS, BY REGION, 2021-2031 ($MILLION)
TABLE 10. GLOBAL FREE SPACE OPTIC COMMUNICATION MARKET, BY APPLICATION, 2021-2031 ($MILLION)
TABLE 11. FREE SPACE OPTIC COMMUNICATION MARKET FOR MOBILE BACKHAUL, BY REGION, 2021-2031 ($MILLION)
TABLE 12. FREE SPACE OPTIC COMMUNICATION MARKET FOR DISASTER RECOVERY, BY REGION, 2021-2031 ($MILLION)
TABLE 13. FREE SPACE OPTIC COMMUNICATION MARKET FOR ENTERPRISE CONNECTIVITY, BY REGION, 2021-2031 ($MILLION)
TABLE 14. FREE SPACE OPTIC COMMUNICATION MARKET FOR DEFENSE, BY REGION, 2021-2031 ($MILLION)
TABLE 15. FREE SPACE OPTIC COMMUNICATION MARKET FOR SATELLITE, BY REGION, 2021-2031 ($MILLION)
TABLE 16. FREE SPACE OPTIC COMMUNICATION MARKET FOR OTHERS, BY REGION, 2021-2031 ($MILLION)
TABLE 17. FREE SPACE OPTIC COMMUNICATION MARKET, BY REGION, 2021-2031 ($MILLION)
TABLE 18. NORTH AMERICA FREE SPACE OPTIC COMMUNICATION MARKET, BY PLATFORM, 2021-2031 ($MILLION)
TABLE 19. NORTH AMERICA FREE SPACE OPTIC COMMUNICATION MARKET, BY COMPONENT, 2021-2031 ($MILLION)
TABLE 20. NORTH AMERICA FREE SPACE OPTIC COMMUNICATION MARKET, BY APPLICATION, 2021-2031 ($MILLION)
TABLE 21. NORTH AMERICA FREE SPACE OPTIC COMMUNICATION MARKET, BY COUNTRY, 2021-2031 ($MILLION)
TABLE 22. U.S. FREE SPACE OPTIC COMMUNICATION MARKET, BY PLATFORM, 2021-2031 ($MILLION)
TABLE 23. U.S. FREE SPACE OPTIC COMMUNICATION MARKET, BY COMPONENT, 2021-2031 ($MILLION)
TABLE 24. U.S. FREE SPACE OPTIC COMMUNICATION MARKET, BY APPLICATION, 2021-2031 ($MILLION)
TABLE 25. CANADA FREE SPACE OPTIC COMMUNICATION MARKET, BY PLATFORM, 2021-2031 ($MILLION)
TABLE 26. CANADA FREE SPACE OPTIC COMMUNICATION MARKET, BY COMPONENT, 2021-2031 ($MILLION)
TABLE 27. CANADA FREE SPACE OPTIC COMMUNICATION MARKET, BY APPLICATION, 2021-2031 ($MILLION)
TABLE 28. MEXICO FREE SPACE OPTIC COMMUNICATION MARKET, BY PLATFORM, 2021-2031 ($MILLION)
TABLE 29. MEXICO FREE SPACE OPTIC COMMUNICATION MARKET, BY COMPONENT, 2021-2031 ($MILLION)
TABLE 30. MEXICO FREE SPACE OPTIC COMMUNICATION MARKET, BY APPLICATION, 2021-2031 ($MILLION)
TABLE 31. EUROPE FREE SPACE OPTIC COMMUNICATION MARKET, BY PLATFORM, 2021-2031 ($MILLION)
TABLE 32. EUROPE FREE SPACE OPTIC COMMUNICATION MARKET, BY COMPONENT, 2021-2031 ($MILLION)
TABLE 33. EUROPE FREE SPACE OPTIC COMMUNICATION MARKET, BY APPLICATION, 2021-2031 ($MILLION)
TABLE 34. EUROPE FREE SPACE OPTIC COMMUNICATION MARKET, BY COUNTRY, 2021-2031 ($MILLION)
TABLE 35. UK FREE SPACE OPTIC COMMUNICATION MARKET, BY PLATFORM, 2021-2031 ($MILLION)
TABLE 36. UK FREE SPACE OPTIC COMMUNICATION MARKET, BY COMPONENT, 2021-2031 ($MILLION)
TABLE 37. UK FREE SPACE OPTIC COMMUNICATION MARKET, BY APPLICATION, 2021-2031 ($MILLION)
TABLE 38. GERMANY FREE SPACE OPTIC COMMUNICATION MARKET, BY PLATFORM, 2021-2031 ($MILLION)
TABLE 39. GERMANY FREE SPACE OPTIC COMMUNICATION MARKET, BY COMPONENT, 2021-2031 ($MILLION)
TABLE 40. GERMANY FREE SPACE OPTIC COMMUNICATION MARKET, BY APPLICATION, 2021-2031 ($MILLION)
TABLE 41. FRANCE FREE SPACE OPTIC COMMUNICATION MARKET, BY PLATFORM, 2021-2031 ($MILLION)
TABLE 42. FRANCE FREE SPACE OPTIC COMMUNICATION MARKET, BY COMPONENT, 2021-2031 ($MILLION)
TABLE 43. FRANCE FREE SPACE OPTIC COMMUNICATION MARKET, BY APPLICATION, 2021-2031 ($MILLION)
TABLE 44. REST OF EUROPE FREE SPACE OPTIC COMMUNICATION MARKET, BY PLATFORM, 2021-2031 ($MILLION)
TABLE 45. REST OF EUROPE FREE SPACE OPTIC COMMUNICATION MARKET, BY COMPONENT, 2021-2031 ($MILLION)
TABLE 46. REST OF EUROPE FREE SPACE OPTIC COMMUNICATION MARKET, BY APPLICATION, 2021-2031 ($MILLION)
TABLE 47. ASIA-PACIFIC FREE SPACE OPTIC COMMUNICATION MARKET, BY PLATFORM, 2021-2031 ($MILLION)
TABLE 48. ASIA-PACIFIC FREE SPACE OPTIC COMMUNICATION MARKET, BY COMPONENT, 2021-2031 ($MILLION)
TABLE 49. ASIA-PACIFIC FREE SPACE OPTIC COMMUNICATION MARKET, BY APPLICATION, 2021-2031 ($MILLION)
TABLE 50. ASIA-PACIFIC FREE SPACE OPTIC COMMUNICATION MARKET, BY COUNTRY, 2021-2031 ($MILLION)
TABLE 51. CHINA FREE SPACE OPTIC COMMUNICATION MARKET, BY PLATFORM, 2021-2031 ($MILLION)
TABLE 52. CHINA FREE SPACE OPTIC COMMUNICATION MARKET, BY COMPONENT, 2021-2031 ($MILLION)
TABLE 53. CHINA FREE SPACE OPTIC COMMUNICATION MARKET, BY APPLICATION, 2021-2031 ($MILLION)
TABLE 54. JAPAN FREE SPACE OPTIC COMMUNICATION MARKET, BY PLATFORM, 2021-2031 ($MILLION)
TABLE 55. JAPAN FREE SPACE OPTIC COMMUNICATION MARKET, BY COMPONENT, 2021-2031 ($MILLION)
TABLE 56. JAPAN FREE SPACE OPTIC COMMUNICATION MARKET, BY APPLICATION, 2021-2031 ($MILLION)
TABLE 57. INDIA FREE SPACE OPTIC COMMUNICATION MARKET, BY PLATFORM, 2021-2031 ($MILLION)
TABLE 58. INDIA FREE SPACE OPTIC COMMUNICATION MARKET, BY COMPONENT, 2021-2031 ($MILLION)
TABLE 59. INDIA FREE SPACE OPTIC COMMUNICATION MARKET, BY APPLICATION, 2021-2031 ($MILLION)
TABLE 60. SOUTH KOREA FREE SPACE OPTIC COMMUNICATION MARKET, BY PLATFORM, 2021-2031 ($MILLION)
TABLE 61. SOUTH KOREA FREE SPACE OPTIC COMMUNICATION MARKET, BY COMPONENT, 2021-2031 ($MILLION)
TABLE 62. SOUTH KOREA FREE SPACE OPTIC COMMUNICATION MARKET, BY APPLICATION, 2021-2031 ($MILLION)
TABLE 63. REST OF ASIA-PACIFIC FREE SPACE OPTIC COMMUNICATION MARKET, BY PLATFORM, 2021-2031 ($MILLION)
TABLE 64. REST OF ASIA-PACIFIC FREE SPACE OPTIC COMMUNICATION MARKET, BY COMPONENT, 2021-2031 ($MILLION)
TABLE 65. REST OF ASIA-PACIFIC FREE SPACE OPTIC COMMUNICATION MARKET, BY APPLICATION, 2021-2031 ($MILLION)
TABLE 66. LAMEA FREE SPACE OPTIC COMMUNICATION MARKET, BY PLATFORM, 2021-2031 ($MILLION)
TABLE 67. LAMEA FREE SPACE OPTIC COMMUNICATION MARKET, BY COMPONENT, 2021-2031 ($MILLION)
TABLE 68. LAMEA FREE SPACE OPTIC COMMUNICATION MARKET, BY APPLICATION, 2021-2031 ($MILLION)
TABLE 69. LAMEA FREE SPACE OPTIC COMMUNICATION MARKET, BY COUNTRY, 2021-2031 ($MILLION)
TABLE 70. LATIN AMERICA FREE SPACE OPTIC COMMUNICATION MARKET, BY PLATFORM, 2021-2031 ($MILLION)
TABLE 71. LATIN AMERICA FREE SPACE OPTIC COMMUNICATION MARKET, BY COMPONENT, 2021-2031 ($MILLION)
TABLE 72. LATIN AMERICA FREE SPACE OPTIC COMMUNICATION MARKET, BY APPLICATION, 2021-2031 ($MILLION)
TABLE 73. MIDDLE EAST FREE SPACE OPTIC COMMUNICATION MARKET, BY PLATFORM, 2021-2031 ($MILLION)
TABLE 74. MIDDLE EAST FREE SPACE OPTIC COMMUNICATION MARKET, BY COMPONENT, 2021-2031 ($MILLION)
TABLE 75. MIDDLE EAST FREE SPACE OPTIC COMMUNICATION MARKET, BY APPLICATION, 2021-2031 ($MILLION)
TABLE 76. AFRICA FREE SPACE OPTIC COMMUNICATION MARKET, BY PLATFORM, 2021-2031 ($MILLION)
TABLE 77. AFRICA FREE SPACE OPTIC COMMUNICATION MARKET, BY COMPONENT, 2021-2031 ($MILLION)
TABLE 78. AFRICA FREE SPACE OPTIC COMMUNICATION MARKET, BY APPLICATION, 2021-2031 ($MILLION)
TABLE 79. EC SYSTEM: KEY EXECUTIVES
TABLE 80. EC SYSTEM: COMPANY SNAPSHOT
TABLE 81. EC SYSTEM: PRODUCT SEGMENTS
TABLE 82. EC SYSTEM: PRODUCT PORTFOLIO
TABLE 83. FSONA NETWORKS CORPORATION: KEY EXECUTIVES
TABLE 84. FSONA NETWORKS CORPORATION: COMPANY SNAPSHOT
TABLE 85. FSONA NETWORKS CORPORATION: PRODUCT SEGMENTS
TABLE 86. FSONA NETWORKS CORPORATION: PRODUCT PORTFOLIO
TABLE 87. AXIOM OPTICS: KEY EXECUTIVES
TABLE 88. AXIOM OPTICS: COMPANY SNAPSHOT
TABLE 89. AXIOM OPTICS: PRODUCT SEGMENTS
TABLE 90. AXIOM OPTICS: PRODUCT PORTFOLIO
TABLE 91. WIRELESS EXCELLENCE LIMITED: KEY EXECUTIVES
TABLE 92. WIRELESS EXCELLENCE LIMITED: COMPANY SNAPSHOT
TABLE 93. WIRELESS EXCELLENCE LIMITED: PRODUCT SEGMENTS
TABLE 94. WIRELESS EXCELLENCE LIMITED: PRODUCT PORTFOLIO
TABLE 95. QINETIQ GROUP PLC: KEY EXECUTIVES
TABLE 96. QINETIQ GROUP PLC: COMPANY SNAPSHOT
TABLE 97. QINETIQ GROUP PLC: PRODUCT SEGMENTS
TABLE 98. QINETIQ GROUP PLC: PRODUCT PORTFOLIO
TABLE 99. QINETIQ GROUP PLC: KEY STRATERGIES
TABLE 100. VIASAT, INC.: KEY EXECUTIVES
TABLE 101. VIASAT, INC.: COMPANY SNAPSHOT
TABLE 102. VIASAT, INC.: SERVICE SEGMENTS
TABLE 103. VIASAT, INC.: PRODUCT PORTFOLIO
TABLE 104. MOSTCOM JSC: KEY EXECUTIVES
TABLE 105. MOSTCOM JSC: COMPANY SNAPSHOT
TABLE 106. MOSTCOM JSC: SERVICE SEGMENTS
TABLE 107. MOSTCOM JSC: PRODUCT PORTFOLIO
TABLE 108. MYNARIC: KEY EXECUTIVES
TABLE 109. MYNARIC: COMPANY SNAPSHOT
TABLE 110. MYNARIC: PRODUCT SEGMENTS
TABLE 111. MYNARIC: PRODUCT PORTFOLIO
TABLE 112. MYNARIC: KEY STRATERGIES
TABLE 113. COLLINEAR: KEY EXECUTIVES
TABLE 114. COLLINEAR: COMPANY SNAPSHOT
TABLE 115. COLLINEAR: PRODUCT SEGMENTS
TABLE 116. COLLINEAR: PRODUCT PORTFOLIO
TABLE 117. PLAINTREE SYSTEMS INC.: KEY EXECUTIVES
TABLE 118. PLAINTREE SYSTEMS INC.: COMPANY SNAPSHOT
TABLE 119. PLAINTREE SYSTEMS INC.: PRODUCT SEGMENTS
TABLE 120. PLAINTREE SYSTEMS INC.: PRODUCT PORTFOLIO LIST OF FIGURES
FIGURE 01. FREE SPACE OPTIC COMMUNICATION MARKET, 2021-2031
FIGURE 02. SEGMENTATION OF FREE SPACE OPTIC COMMUNICATION MARKET, 2021-2031
FIGURE 03. TOP INVESTMENT POCKETS IN FREE SPACE OPTIC COMMUNICATION MARKET (2022-2031)
FIGURE 04. MODERATE BARGAINING POWER OF SUPPLIERS
FIGURE 05. MODERATE BARGAINING POWER OF BUYERS
FIGURE 06. MODERATE THREAT OF SUBSTITUTES
FIGURE 07. MODERATE THREAT OF NEW ENTRANTS
FIGURE 08. HIGH INTENSITY OF RIVALRY
FIGURE 09. DRIVERS, RESTRAINTS AND OPPORTUNITIES: GLOBALFREE SPACE OPTIC COMMUNICATION MARKET
FIGURE 10. FREE SPACE OPTIC COMMUNICATION MARKET, BY PLATFORM, 2021(%)
FIGURE 11. COMPARATIVE SHARE ANALYSIS OF FREE SPACE OPTIC COMMUNICATION MARKET FOR SPACE, BY COUNTRY 2021 AND 2031(%)
FIGURE 12. COMPARATIVE SHARE ANALYSIS OF FREE SPACE OPTIC COMMUNICATION MARKET FOR AIRBORNE, BY COUNTRY 2021 AND 2031(%)
FIGURE 13. COMPARATIVE SHARE ANALYSIS OF FREE SPACE OPTIC COMMUNICATION MARKET FOR GROUND, BY COUNTRY 2021 AND 2031(%)
FIGURE 14. FREE SPACE OPTIC COMMUNICATION MARKET, BY COMPONENT, 2021(%)
FIGURE 15. COMPARATIVE SHARE ANALYSIS OF FREE SPACE OPTIC COMMUNICATION MARKET FOR TRANSMITTER, BY COUNTRY 2021 AND 2031(%)
FIGURE 16. COMPARATIVE SHARE ANALYSIS OF FREE SPACE OPTIC COMMUNICATION MARKET FOR TRANSCEIVER, BY COUNTRY 2021 AND 2031(%)
FIGURE 17. COMPARATIVE SHARE ANALYSIS OF FREE SPACE OPTIC COMMUNICATION MARKET FOR RECEIVER, BY COUNTRY 2021 AND 2031(%)
FIGURE 18. COMPARATIVE SHARE ANALYSIS OF FREE SPACE OPTIC COMMUNICATION MARKET FOR OTHERS, BY COUNTRY 2021 AND 2031(%)
FIGURE 19. FREE SPACE OPTIC COMMUNICATION MARKET, BY APPLICATION, 2021(%)
FIGURE 20. COMPARATIVE SHARE ANALYSIS OF FREE SPACE OPTIC COMMUNICATION MARKET FOR MOBILE BACKHAUL, BY COUNTRY 2021 AND 2031(%)
FIGURE 21. COMPARATIVE SHARE ANALYSIS OF FREE SPACE OPTIC COMMUNICATION MARKET FOR DISASTER RECOVERY, BY COUNTRY 2021 AND 2031(%)
FIGURE 22. COMPARATIVE SHARE ANALYSIS OF FREE SPACE OPTIC COMMUNICATION MARKET FOR ENTERPRISE CONNECTIVITY, BY COUNTRY 2021 AND 2031(%)
FIGURE 23. COMPARATIVE SHARE ANALYSIS OF FREE SPACE OPTIC COMMUNICATION MARKET FOR DEFENSE, BY COUNTRY 2021 AND 2031(%)
FIGURE 24. COMPARATIVE SHARE ANALYSIS OF FREE SPACE OPTIC COMMUNICATION MARKET FOR SATELLITE, BY COUNTRY 2021 AND 2031(%)
FIGURE 25. COMPARATIVE SHARE ANALYSIS OF FREE SPACE OPTIC COMMUNICATION MARKET FOR OTHERS, BY COUNTRY 2021 AND 2031(%)
FIGURE 26. FREE SPACE OPTIC COMMUNICATION MARKET BY REGION, 2021
FIGURE 27. U.S. FREE SPACE OPTIC COMMUNICATION MARKET, 2021-2031 ($MILLION)
FIGURE 28. CANADA FREE SPACE OPTIC COMMUNICATION MARKET, 2021-2031 ($MILLION)
FIGURE 29. MEXICO FREE SPACE OPTIC COMMUNICATION MARKET, 2021-2031 ($MILLION)
FIGURE 30. UK FREE SPACE OPTIC COMMUNICATION MARKET, 2021-2031 ($MILLION)
FIGURE 31. GERMANY FREE SPACE OPTIC COMMUNICATION MARKET, 2021-2031 ($MILLION)
FIGURE 32. FRANCE FREE SPACE OPTIC COMMUNICATION MARKET, 2021-2031 ($MILLION)
FIGURE 33. REST OF EUROPE FREE SPACE OPTIC COMMUNICATION MARKET, 2021-2031 ($MILLION)
FIGURE 34. CHINA FREE SPACE OPTIC COMMUNICATION MARKET, 2021-2031 ($MILLION)
FIGURE 35. JAPAN FREE SPACE OPTIC COMMUNICATION MARKET, 2021-2031 ($MILLION)
FIGURE 36. INDIA FREE SPACE OPTIC COMMUNICATION MARKET, 2021-2031 ($MILLION)
FIGURE 37. SOUTH KOREA FREE SPACE OPTIC COMMUNICATION MARKET, 2021-2031 ($MILLION)
FIGURE 38. REST OF ASIA-PACIFIC FREE SPACE OPTIC COMMUNICATION MARKET, 2021-2031 ($MILLION)
FIGURE 39. LATIN AMERICA FREE SPACE OPTIC COMMUNICATION MARKET, 2021-2031 ($MILLION)
FIGURE 40. MIDDLE EAST FREE SPACE OPTIC COMMUNICATION MARKET, 2021-2031 ($MILLION)
FIGURE 41. AFRICA FREE SPACE OPTIC COMMUNICATION MARKET, 2021-2031 ($MILLION)
FIGURE 42. TOP WINNING STRATEGIES, BY YEAR
FIGURE 43. TOP WINNING STRATEGIES, BY DEVELOPMENT
FIGURE 44. TOP WINNING STRATEGIES, BY COMPANY
FIGURE 45. PRODUCT MAPPING OF TOP 10 PLAYERS
FIGURE 46. COMPETITIVE DASHBOARD
FIGURE 47. COMPETITIVE HEATMAP: FREE SPACE OPTIC COMMUNICATION MARKET
FIGURE 48. TOP PLAYER POSITIONING, 2021
FIGURE 49. QINETIQ GROUP PLC: NET REVENUE, 2019-2021 ($MILLION)
FIGURE 50. QINETIQ GROUP PLC: REVENUE SHARE BY REGION, 2021 (%)
FIGURE 51. QINETIQ GROUP PLC: REVENUE SHARE BY SEGMENT, 2021 (%)
FIGURE 52. VIASAT, INC.: NET REVENUE, 2020-2022 ($MILLION)
FIGURE 53. VIASAT, INC.: REVENUE SHARE BY SEGMENT, 2022 (%)
FIGURE 54. MYNARIC: NET REVENUE, 2019-2021 ($MILLION)
FIGURE 55. COLLINEAR: NET REVENUE, 2019-2021 ($MILLION)
FIGURE 56. COLLINEAR: REVENUE SHARE BY SEGMENT, 2021 (%)
FIGURE 57. COLLINEAR: REVENUE SHARE BY REGION, 2021 (%)
FIGURE 58. PLAINTREE SYSTEMS INC.: NET REVENUE, 2020-2022 ($MILLION)
FIGURE 59. PLAINTREE SYSTEMS INC.: RESEARCH & DEVELOPMENT EXPENDITURE, 2020-2022 ($MILLION)
FIGURE 60. PLAINTREE SYSTEMS INC.: REVENUE SHARE BY SEGMENT, 2022 (%
SELECT A FORMAT
Added to Cart
Electronic (PDF)

$5730

This license allows only one user to access the PDF.
Electronic (PDF)

$6450

This license allows 1 - 5 user to access the PDF, license is suitable for small groups of 5 users working together
Electronic (PDF)

$9600

This license allows users/teams in a same Enterprise to use this report, various departments within an enterpise can use this report
Electronic (PDF)

$3840

This license just provides quantitative data in a excel sheet
Add to Cart
Buy Now (15% Discount)

OUR CUSTOMER

Novocure

SIMILAR REPORTS


RELATED REPORTS

Global Marine Communication Radios Market Research Report 2024

120 Pages
Type: Report
Code: QYRE-Auto-10K6013
Sat May 11 00:00:00 UTC 2024

Add to Cart

Global 5G Radio Frequency Front End Module Market Research Report 2024

120 Pages
Type: Report
Code: QYRE-Auto-2N12602
Wed May 08 00:00:00 UTC 2024

Add to Cart

Global Cellular Base Station Antenna for Telecommunications Industry Market Research Report 2024

120 Pages
Type: Report
Code: QYRE-Auto-5S12116
Mon May 06 00:00:00 UTC 2024

Add to Cart

Global Radio Propagation Software Market Research Report 2024

120 Pages
Type: Report
Code: QYRE-Auto-13G5975
Mon Apr 29 00:00:00 UTC 2024

Add to Cart