0
U.S. (TOLL FREE)
+1 (315) 215-3225
Automative

0
U.S. (TOLL FREE)
+1 (315) 215-3225
Reverse Osmosis Membrane Market by Membrane Type (Cellulose-based and Thin Film Composite), Filter-module (Plate & Frame, Tubular-shaped, Spiral-wound, and Hollow-fiber), and End-user (Desalination System and RO Purification System) - Global Opportunity Analysis and Industry Forecast, 2018-2025
Published Date: November 2019
|
Report Code: ALLI-Auto-4G287
Home | Market Reports | Home & Garden| Home Appliances
 Reverse Osmosis Membrane Market by Membrane Type Cellulose based and Thin Film Composite Filter module Plate Frame Tubular shaped Spiral wound and Hollow fiber and End user Desalination System and RO Purification System Global Opportunity Analysis and Industry Forecast 2018 2025
BUY CHAPTERS

Reverse Osmosis Membrane Market by Membrane Type (Cellulose-based and Thin Film Composite), Filter-module (Plate & Frame, Tubular-shaped, Spiral-wound, and Hollow-fiber), and End-user (Desalination System and RO Purification System) - Global Opportunity Analysis and Industry Forecast, 2018-2025

Code: ALLI-Auto-4G287
Report
November 2019
Pages:256
Allied Market Research
Buy Now with 15% Discount
DESCRIPTION
TABLE OF CONTENT
TABLES & FIGURES

Reverse Osmosis Membrane Market  

The global reverse osmosis membrane market size was valued at $6.9 billion in 2017, and is estimated to reach $13.5 billion by 2025, registering a CAGR of 8.7% from 2018 to 2025.
 
Reverse Osmosis Membrane Market
 
The reverse osmosis (RO) membrane is a material with tiny pores, which excludes dissolved salts and molecules from sea or brackish water. RO is the most economical and practical way for purification & treatment of water. The RO membrane is delicate and expensive, hence needs protection. Since its discovery, there has been progressive improvement in the membranes and development of means for packaging them. As a result, present-day RO plants are compact & simple to operate, and there is no phase change required.
 
Reverse osmosis (RO) membranes are used for various purposes including desalination of seawater, waste water recovery, brackish water for drinking purposes, industrial process water, and others. They adequately eliminate almost all inorganic contaminants from water. They remove pesticides, radium, cysts, bacteria, and viruses.
 
The Asia-Pacific region is the fastest-growing market for RO membranes. The Asia-Pacific RO market is expected to register substantial growth during the forecast period, attributed to huge population in developing economies of the region. Other factors that drive the market are high-growth application areas such as seawater desalination systems and RO purification systems along with stringent regulations, owing to increased concerns over safe drinking water. Rapid industrialization and continuous rise in infrastructure have contributed immensely towards water pollution, which will drive the need for water purification and hence indirectly create an opportunity for the market players. However, factors, such as high cost of membrane, may restrict the market growth during the forecast period.
 
The global reverse osmosis membrane market is segmented by material type, filter module, application, and region. On the basis of material type, the market is segmented into cellulose-based and thin film composite. According to the filter module, the market is classified into the plate & frame, tubular-shaped, spiral-wound, and hollow-fiber. By application, the market is divided into desalination system and RO purification system. Regional breakdown and deep analysis of each of the previously mentioned segments is included for North America, Europe, Asia-Pacific, and LAMEA.
 
The global reverse osmosis membrane industry is highly competitive, owing to the presence of several well-established manufacturers and vendors. The market has been undergoing significant consolidation over the last few years, and this trend is expected to continue further, owing to increase in adaptation of reverse osmosis membranes in new water treatment projects.

Key Companies

The major players analyzed in this report are Toray Industries, Inc., LG Chem., Hydranautics (A Nitto Group Company), Toyobo Co., Ltd., Lanxess AG, The Dow Chemical Company, Koch Membrane System, Microdyn-Nadir GmbH, Membranium (JSC RM Nanotech), and Axeon Water Technologies.
 
Other key players operating in the global reverse osmosis membrane market include MECO Incorporated, Pure Aqua, Inc., Rochem Marine, Ampac USA, Veolia Water Technologies, Aspen Water, Inc., Wananchi UK, Lifestream Watersystems, Inc., Global Enviro Science, TerraGroup Corporation, Parker Hannifin Ltd. (Village Marine), Global Water Group, Inc., Applied Membranes, Inc., Bionics Advanced Filtration Systems (P) Ltd., B&P Water Technologies s.r.l., and others.

By Application

  • Desalination system
  • RO purification system
  • Medical Devices & Diagnostics

By Material Type

  • CELLULOSE-BASED
  • THIN FILM COMPOSITE

By Region

  • North America
    • U.S
    • Canada
    • Mexico
  • Europe
    • Germany
    • Spain
    • UK
    • Italy
    • France
    • Rest of Europe
  • Asia-Pacific
    • China
    • India
    • Japan
    • Australia
    • South Korea
    • Rest of Asia-Pacific
  • LAMEA
    • Brazil
    • Argentina
    • South Africa
    • UAE
    • Qatar
    • Saudi Arabia
    • Rest of LAMEA

By Filter Module

  • Plate & Frame
  • Tubular-Shaped
  • Spiral-Wound
  • Hollow-Fiber


By Companies

  • Toray Industries, Inc.
  • LG Chem
  • Hydranautics (A Nitto Group Company)
  • Toyobo Co., Ltd
  • LANXESS AG
  • THE DOW CHEMICAL COMPANY
  • Koch Membrane System, Inc
  • Microdyn-Nadir GmbH
  • Membranium (JSC RM Nanotech)
  • AXEON WATER TECHNOLOGIES.

Scope of Reverse Osmosis Membrane Market Report

Report Metric

Details

Report Name

Reverse Osmosis Membrane Market

Market size value in 2017

$6.9 billion

Revenue forecast in 2025

$13.5 billion

Growth Rate

CAGR of 8.7%

Base year considered

2017

Forecast Period

2018-2025

By Material Type

Cellulose-Based and Thin Film Composite

By Filter Module

Plate & Frame, Tubular-Shaped, Spiral-Wound, And Hollow-Fiber

Report Coverage

Revenue & volume forecast, company share, competitive landscape, growth factors, and trends

Segments Covered

By Type, Application, and Region

Geographic Regions Covered

North America, Europe, Asia Pacific, Latin America, Middle East & Africa

Frequently Asked Questions About This Report 

1. Do you provide chapter wise report data? 

Ans. Yes, we do provide the option to buy chapters in a report. We also can customize the report based on your specific requirements.

2. How big is the Reverse Osmosis Membrane Market?

Ans. The global air taxi market size is expected to be USD 817.50 Million by 2021, and is projected to reach USD 6.63 Billion by 2030, registering a CAGR of 26.2% from 2021 to 2030.

3. Does the report provides covid-19 impact analysis?

Ans. Yes, the report includes a COVID-19 impact analysis. Also, it is further extended into every individual segment of the report.

Table of Content
 
 
CHAPTER 1: INTRODUCTION
1.1. REPORT DESCRIPTION
1.2. KEY MARKET BENEFITS FOR STAKEHOLDERS
1.3. KEY MARKET SEGMENTS
1.4. RESEARCH METHODOLOGY
1.4.1. Secondary research
1.4.2. Primary research
1.4.3. Analyst tools and models
CHAPTER 2: EXECUTIVE SUMMARY
2.1. SNAPSHOT
2.2. CXO PERSPECTIVE
CHAPTER 3: MARKET OVERVIEW
3.1. MARKET DEFINITION AND SCOPE
3.2. KEY FINDINGS
3.2.1. Top investment pockets
3.2.2. Top winning strategies
3.3. PORTER'S FIVE FORCE ANALYSIS
3.4. MARKET PLAYER POSITIONING, 2017
3.5. MARKET DYNAMICS
3.5.1. Drivers
3.5.1.1. Rising awareness of water scarcity
3.5.1.2. Stringent government regulations
3.5.1.3. Rise in expenditure of water treatment
3.5.2. Restraints
3.5.2.1. Loss of essential mineralization from water
3.5.3. Opportunities
3.5.3.1. Growing demand for water treatment in emerging economies
3.5.3.2. Development of advanced membrane technology
3.6. Importance of controlling the feedwater temperature to optimize the process
3.7. List of companies providing/offering their RO systems to the military use/application
3.8. The effect of temperature variation on various types of RO membranes
3.9. List of companies that design RO SKIDS
CHAPTER 4: REVERSE OSMOSIS MEMBRANE MARKET, BY MATERIAL TYPE
4.1. OVERVIEW
4.1.1. Market size and forecast
4.2. Cellulose-based
4.2.1. Key market trends, growth factors, and opportunities
4.2.2. Cellulose acetate (CA) membrane
4.2.3. Nitrocellulose membrane
4.2.4. Others
4.2.5. Market size and forecast, by region
4.2.6. Market analysis, by country
4.3. Thin Film Composite
4.3.1. Key market trends, growth factors, and opportunities
4.3.2. Polyamide (PA) composite membrane
4.3.3. Graphene oxide-based (GO) Polyacrylonitrile (PAN) composite membrane
4.3.4. Market size and forecast, by region
4.3.5. Market analysis, by country
CHAPTER 5: REVERSE OSMOSIS MEMBRANE MARKET, BY FILTER MODULE
5.1. OVERVIEW
5.1.1. Market size and forecast
5.2. Plate & Frame
5.2.1. Key market trends, growth factors, and opportunities
5.2.2. Spiral membrane
5.2.3. Pillow-shaped membrane
5.2.4. Market size and forecast, by region
5.2.5. Market analysis, by country
5.3. Tubular-Shaped
5.3.1. Key market trends, growth factors, and opportunities
5.3.2. Capillary membrane
5.3.3. Market size and forecast, by region
5.3.4. Market analysis, by country
5.4. Spiral-Wound
5.4.1. Key market trends, growth factors, and opportunities
5.4.2. Market size and forecast, by region
5.4.3. Market analysis, by country
5.5. Hollow-Fiber
5.5.1. Key market trends, growth factors, and opportunities
5.5.2. Market size and forecast, by region
5.5.3. Market analysis, by country
CHAPTER 6: REVERSE OSMOSIS MEMBRANE MARKET, BY APPLICATION
6.1. OVERVIEW
6.1.1. Market size and forecast
6.2. Desalination System
6.2.1. Key market trends, growth factors, and opportunities
6.2.2. Seawater
6.2.3. Brackish Water
6.2.4. Market size and forecast, by region
6.2.5. Market analysis, by country
6.3. RO Purification System
6.3.1. Key market trends, growth factors, and opportunities
6.3.2. Residential and Commercial
6.3.3. Municipal
6.3.4. Industrial
6.3.5. Medical Diagnostics
6.3.6. Dialysis Equipment
6.3.7. Market size and forecast, by region
6.3.8. Market analysis, by country
CHAPTER 7: REVERSE OSMOSIS MEMBRANE MARKET, BY REGION
7.1. Overview
7.1.1. Market size and forecast
7.2. North America
7.2.1. Key market trends, growth factors, and opportunities
7.2.2. Market size and forecast, by material type
7.2.3. Market size and forecast, by filter module
7.2.4. Market size and forecast, by application
7.2.5. Market size and forecast, by country
7.2.6. U.S.
7.2.6.1. Market size and forecast, by material type
7.2.6.2. Market size and forecast, by filter module
7.2.6.3. Market size and forecast, by application
7.2.7. Canada
7.2.7.1. Market size and forecast, by material type
7.2.7.2. Market size and forecast, by filter module
7.2.7.3. Market size and forecast, by application
7.2.8. Mexico
7.2.8.1. Market size and forecast, by material type
7.2.8.2. Market size and forecast, by filter module
7.2.8.3. Market size and forecast, by application
7.3. Europe
7.3.1. Key market trends, growth factors, and opportunities
7.3.2. Market size and forecast, by material type
7.3.3. Market size and forecast, by filter module
7.3.4. Market size and forecast, by application
7.3.5. Market size and forecast, by country
7.3.6. Germany
7.3.6.1. Market size and forecast, by material type
7.3.6.2. Market size and forecast, by filter module
7.3.6.3. Market size and forecast, by application
7.3.7. Spain
7.3.7.1. Market size and forecast, by material type
7.3.7.2. Market size and forecast, by filter module
7.3.7.3. Market size and forecast, by application
7.3.8. UK
7.3.8.1. Market size and forecast, by material type
7.3.8.2. Market size and forecast, by filter module
7.3.8.3. Market size and forecast, by application
7.3.9. Italy
7.3.9.1. Market size and forecast, by material type
7.3.9.2. Market size and forecast, by filter module
7.3.9.3. Market size and forecast, by application
7.3.10. France
7.3.10.1. Market size and forecast, by material type
7.3.10.2. Market size and forecast, by filter module
7.3.10.3. Market size and forecast, by application
7.3.11. Rest of Europe
7.3.11.1. Market size and forecast, by material type
7.3.11.2. Market size and forecast, by filter module
7.3.11.3. Market size and forecast, by application
7.4. Asia-Pacific
7.4.1. Key market trends, growth factors, and opportunities
7.4.2. Market size and forecast, by material type
7.4.3. Market size and forecast, by filter module
7.4.4. Market size and forecast, by application
7.4.5. Market size and forecast, by country
7.4.6. China
7.4.6.1. Market size and forecast, by material type
7.4.6.2. Market size and forecast, by filter module
7.4.6.3. Market size and forecast, by application
7.4.7. India
7.4.7.1. Market size and forecast, by material type
7.4.7.2. Market size and forecast, by filter module
7.4.7.3. Market size and forecast, by application
7.4.8. Japan
7.4.8.1. Market size and forecast, by material type
7.4.8.2. Market size and forecast, by filter module
7.4.8.3. Market size and forecast, by application
7.4.9. Australia
7.4.9.1. Market size and forecast, by material type
7.4.9.2. Market size and forecast, by filter module
7.4.9.3. Market size and forecast, by application
7.4.10. South Korea
7.4.10.1. Market size and forecast, by material type
7.4.10.2. Market size and forecast, by filter module
7.4.10.3. Market size and forecast, by application
7.4.11. Rest of Asia-Pacific
7.4.11.1. Market size and forecast, by material type
7.4.11.2. Market size and forecast, by filter module
7.4.11.3. Market size and forecast, by application
7.5. LAMEA
7.5.1. Key market trends, growth factors, and opportunities
7.5.2. Market size and forecast, by material type
7.5.3. Market size and forecast, by filter module
7.5.4. Market size and forecast, by application
7.5.5. Market size and forecast, by country
7.5.6. Brazil
7.5.6.1. Market size and forecast, by material type
7.5.6.2. Market size and forecast, by filter module
7.5.6.3. Market size and forecast, by application
7.5.7. Argentina
7.5.7.1. Market size and forecast, by material type
7.5.7.2. Market size and forecast, by filter module
7.5.7.3. Market size and forecast, by application
7.5.8. South Africa
7.5.8.1. Market size and forecast, by material type
7.5.8.2. Market size and forecast, by filter module
7.5.8.3. Market size and forecast, by application
7.5.9. UAE
7.5.9.1. Market size and forecast, by material type
7.5.9.2. Market size and forecast, by filter module
7.5.9.3. Market size and forecast, by application
7.5.10. Rest of LAMEA
7.5.10.1. Market size and forecast, by material type
7.5.10.2. Market size and forecast, by filter module
7.5.10.3. Market size and forecast, by application
CHAPTER 8: COMPANY PROFILES
8.1. Toray Industries, Inc.
8.1.1. Company overview
8.1.2. Company snapshot
8.1.3. Operating business segments
8.1.4. Product portfolio
8.1.5. Business performance
8.1.6. Key strategic moves and developments
8.2. LG Chem.
8.2.1. Company overview
8.2.2. Company snapshot
8.2.3. Operating business segments
8.2.4. Product portfolio
8.2.5. Business performance
8.2.6. Key strategic moves and developments
8.3. Hydranautics (A Nitto Group Company)
8.3.1. Company overview
8.3.2. Company snapshot
8.3.3. Operating business segments
8.3.4. Product portfolio
8.3.5. Business performance
8.3.6. Key strategic moves and developments
8.4. Toyobo Co., Ltd.
8.4.1. Company overview
8.4.2. Company snapshot
8.4.3. Operating business segments
8.4.4. Product portfolio
8.4.5. Business performance
8.5. LANXESS AG
8.5.1. Company overview
8.5.2. Company snapshot
8.5.3. Operating business segments
8.5.4. Product portfolio
8.5.5. Business performance
8.5.6. Key strategic moves and developments
8.6. THE DOW CHEMICAL COMPANY
8.6.1. Company overview
8.6.2. Company snapshot
8.6.3. Operating business segments
8.6.4. Product portfolio
8.6.5. Business performance
8.6.6. Key strategic moves and developments
8.7. Koch Membrane System, Inc.
8.7.1. Company overview
8.7.2. Company snapshot
8.7.3. Product portfolio
8.7.4. Key strategic moves and developments
8.8. Microdyn-Nadir GmbH
8.8.1. Company overview
8.8.2. Company snapshot
8.8.3. Product portfolio
8.8.4. Key strategic moves and developments
8.9. Membranium (JSC RM Nanotech)
8.9.1. Company overview
8.9.2. Company snapshot
8.9.3. Product portfolio
8.10. AXEON WATER TECHNOLOGIES
8.10.1. Company overview
8.10.2. Company snapshot
8.10.3. Product portfoli
TABLE 01. EXPECTED INCREASE IN FLUX DUE TO TEMPERATURE RISE
TABLE 02. GLOBAL REVERSE OSMOSIS MEMBRANE MARKET, BY MATERIAL TYPE, 2017-2025 ($MILLION)
TABLE 03. CELLULOSE-BASED REVERSE OSMOSIS MEMBRANE MARKET, BY REGION, 2017-2025 ($MILLION)
TABLE 04. GLOBAL THIN FILM COMPOSITE REVERSE OSMOSIS MEMBRANE MARKET, BY REGION, 2017-2025 ($MILLION)
TABLE 05. GLOBAL REVERSE OSMOSIS MEMBRANE MARKET, BY FILTER MODULE, 2017-2025 ($MILLION)
TABLE 06. GLOBAL PLATE & FRAME REVERSE OSMOSIS MEMBRANE MARKET, BY REGION, 2017-2025 ($MILLION)
TABLE 07. GLOBAL TUBULAR-SHAPED REVERSE OSMOSIS MEMBRANE MARKET, BY REGION, 2017-2025 ($MILLION)
TABLE 08. GLOBAL SPIRAL-WOUND REVERSE OSMOSIS MEMBRANE MARKET, BY REGION, 2017-2025 ($MILLION)
TABLE 09. GLOBAL HOLLOW-FIBER REVERSE OSMOSIS MEMBRANE MARKET, BY REGION, 2017-2025 ($MILLION)
TABLE 10. GLOBAL REVERSE OSMOSIS MEMBRANE MARKET, BY APPLICATION, 2017-2025 ($MILLION)
TABLE 11. GLOBAL REVERSE OSMOSIS MEMBRANE MARKET FOR DESALINATION SYSTEM, BY REGION, 2017-2025 ($MILLION)
TABLE 12. GLOBAL REVERSE OSMOSIS MEMBRANE MARKET FOR RO PURIFICATION SYSTEM, BY REGION, 2017-2025 ($MILLION)
TABLE 13. REVERSE OSMOSIS MEMBRANE MARKET, BY REGION, 2017-2025 ($MILLION)
TABLE 14. NORTH AMERICA REVERSE OSMOSIS MEMBRANE MARKET, BY MATERIAL TYPE, 2017-2025 ($MILLION)
TABLE 15. NORTH AMERICA REVERSE OSMOSIS MEMBRANE MARKET, BY FILTER MODULE, 2017-2025 ($MILLION)
TABLE 16. NORTH AMERICA REVERSE OSMOSIS MEMBRANE MARKET, BY APPLICATION, 2017-2025 ($MILLION)
TABLE 17. NORTH AMERICA REVERSE OSMOSIS MEMBRANE MARKET, BY COUNTRY, 2017-2025 ($MILLION)
TABLE 18. U.S. REVERSE OSMOSIS MEMBRANE MARKET, BY MATERIAL TYPE, 2017-2025 ($MILLION)
TABLE 19. U.S. REVERSE OSMOSIS MEMBRANE MARKET, BY FILTER MODULE, 2017-2025 ($MILLION)
TABLE 20. U.S. REVERSE OSMOSIS MEMBRANE MARKET, BY APPLICATION, 2017-2025 ($MILLION)
TABLE 21. CANADA REVERSE OSMOSIS MEMBRANE MARKET, BY MATERIAL TYPE, 2017-2025 ($MILLION)
TABLE 22. CANADA REVERSE OSMOSIS MEMBRANE MARKET, BY FILTER MODULE, 2017-2025 ($MILLION)
TABLE 23. CANADA REVERSE OSMOSIS MEMBRANE MARKET, BY APPLICATION, 2017-2025 ($MILLION)
TABLE 24. MEXICO REVERSE OSMOSIS MEMBRANE MARKET, BY MATERIAL TYPE, 2017-2025 ($MILLION)
TABLE 25. MEXICO REVERSE OSMOSIS MEMBRANE MARKET, BY FILTER MODULE, 2017-2025 ($MILLION)
TABLE 26. MEXICO REVERSE OSMOSIS MEMBRANE MARKET, BY APPLICATION, 2017-2025 ($MILLION)
TABLE 27. EUROPE REVERSE OSMOSIS MEMBRANE MARKET, BY MATERIAL TYPE, 2017-2025 ($MILLION)
TABLE 28. EUROPE REVERSE OSMOSIS MEMBRANE MARKET, BY FILTER MODULE, 2017-2025 ($MILLION)
TABLE 29. EUROPE REVERSE OSMOSIS MEMBRANE MARKET, BY APPLICATION, 2017-2025 ($MILLION)
TABLE 30. EUROPE REVERSE OSMOSIS MEMBRANE MARKET, BY COUNTRY, 2017-2025 ($MILLION)
TABLE 31. GERMANY REVERSE OSMOSIS MEMBRANE MARKET, BY MATERIAL TYPE, 2017-2025 ($MILLION)
TABLE 32. GERMANY REVERSE OSMOSIS MEMBRANE MARKET, BY FILTER MODULE, 2017-2025 ($MILLION)
TABLE 33. GERMANY REVERSE OSMOSIS MEMBRANE MARKET, BY APPLICATION, 2017-2025 ($MILLION)
TABLE 34. SPAIN REVERSE OSMOSIS MEMBRANE MARKET, BY MATERIAL TYPE, 2017-2025 ($MILLION)
TABLE 35. SPAIN REVERSE OSMOSIS MEMBRANE MARKET, BY FILTER MODULE, 2017-2025 ($MILLION)
TABLE 36. SPAIN REVERSE OSMOSIS MEMBRANE MARKET, BY APPLICATION, 2017-2025 ($MILLION)
TABLE 37. UK REVERSE OSMOSIS MEMBRANE MARKET, BY MATERIAL TYPE, 2017-2025 ($MILLION)
TABLE 38. UK REVERSE OSMOSIS MEMBRANE MARKET, BY FILTER MODULE, 2017-2025 ($MILLION)
TABLE 39. UK REVERSE OSMOSIS MEMBRANE MARKET, BY APPLICATION, 2017-2025 ($MILLION)
TABLE 40. ITALY REVERSE OSMOSIS MEMBRANE MARKET, BY MATERIAL TYPE, 2017-2025 ($MILLION)
TABLE 41. ITALY REVERSE OSMOSIS MEMBRANE MARKET, BY FILTER MODULE, 2017-2025 ($MILLION)
TABLE 42. ITALY REVERSE OSMOSIS MEMBRANE MARKET, BY APPLICATION, 2017-2025 ($MILLION)
TABLE 43. FRANCE REVERSE OSMOSIS MEMBRANE MARKET, BY MATERIAL TYPE, 2017-2025 ($MILLION)
TABLE 44. FRANCE REVERSE OSMOSIS MEMBRANE MARKET, BY FILTER MODULE, 2017-2025 ($MILLION)
TABLE 45. FRANCE REVERSE OSMOSIS MEMBRANE MARKET, BY APPLICATION, 2017-2025 ($MILLION)
TABLE 46. REST OF EUROPE REVERSE OSMOSIS MEMBRANE MARKET, BY MATERIAL TYPE, 2017-2025 ($MILLION)
TABLE 47. REST OF EUROPE REVERSE OSMOSIS MEMBRANE MARKET, BY FILTER MODULE, 2017-2025 ($MILLION)
TABLE 48. REST OF EUROPE REVERSE OSMOSIS MEMBRANE MARKET, BY APPLICATION, 2017-2025 ($MILLION)
TABLE 49. AISA-PACIFIC REVERSE OSMOSIS MEMBRANE MARKET, BY MATERIAL TYPE, 2017-2025 ($MILLION)
TABLE 50. ASIA-PACIFIC REVERSE OSMOSIS MEMBRANE MARKET, BY FILTER MODULE, 2017-2025 ($MILLION)
TABLE 51. AISA-PACIFIC REVERSE OSMOSIS MEMBRANE MARKET, BY APPLICATION, 2017-2025 ($MILLION)
TABLE 52. ASIA-PACIFIC REVERSE OSMOSIS MEMBRANE MARKET, BY COUNTRY, 2017-2025 ($MILLION)
TABLE 53. CHINA REVERSE OSMOSIS MEMBRANE MARKET, BY MATERIAL TYPE, 2017-2025 ($MILLION)
TABLE 54. CHINA REVERSE OSMOSIS MEMBRANE MARKET, BY FILTER MODULE, 2017-2025 ($MILLION)
TABLE 55. CHINA REVERSE OSMOSIS MEMBRANE MARKET, BY APPLICATION, 2017-2025 ($MILLION)
TABLE 56. INDIA REVERSE OSMOSIS MEMBRANE MARKET, BY MATERIAL TYPE, 2017-2025 ($MILLION)
TABLE 57. INDIA REVERSE OSMOSIS MEMBRANE MARKET, BY FILTER MODULE, 2017-2025 ($MILLION)
TABLE 58. INDIA REVERSE OSMOSIS MEMBRANE MARKET, BY APPLICATION, 2017-2025 ($MILLION)
TABLE 59. JAPAN REVERSE OSMOSIS MEMBRANE MARKET, BY MATERIAL TYPE, 2017-2025 ($MILLION)
TABLE 60. JAPAN REVERSE OSMOSIS MEMBRANE MARKET, BY FILTER MODULE, 2017-2025 ($MILLION)
TABLE 61. JAPAN REVERSE OSMOSIS MEMBRANE MARKET, BY APPLICATION, 2017-2025 ($MILLION)
TABLE 62. AUSTRALIA REVERSE OSMOSIS MEMBRANE MARKET, BY MATERIAL TYPE, 2017-2025 ($MILLION)
TABLE 63. AUSTRALIA REVERSE OSMOSIS MEMBRANE MARKET, BY FILTER MODULE, 2017-2025 ($MILLION)
TABLE 64. AUSTRALIA REVERSE OSMOSIS MEMBRANE MARKET, BY APPLICATION, 2017-2025 ($MILLION)
TABLE 65. SOUTH KOREA REVERSE OSMOSIS MEMBRANE MARKET, BY MATERIAL TYPE, 2017-2025 ($MILLION)
TABLE 66. SOUTH KOREA REVERSE OSMOSIS MEMBRANE MARKET, BY FILTER MODULE, 2017-2025 ($MILLION)
TABLE 67. SOUTH KOREA REVERSE OSMOSIS MEMBRANE MARKET, BY APPLICATION, 2017-2025 ($MILLION)
TABLE 68. REST OF ASIA-PACIFIC REVERSE OSMOSIS MEMBRANE MARKET, BY MATERIAL TYPE, 2017-2025 ($MILLION)
TABLE 69. REST OF ASIA-PACIFIC REVERSE OSMOSIS MEMBRANE MARKET, BY FILTER MODULE, 2017-2025 ($MILLION)
TABLE 70. REST OF ASIA-PACIFIC REVERSE OSMOSIS MEMBRANE MARKET, BY APPLICATION, 2017-2025 ($MILLION)
TABLE 71. LAMEA REVERSE OSMOSIS MEMBRANE MARKET, BY MATERIAL TYPE, 2017-2025 ($MILLION)
TABLE 72. LAMEA REVERSE OSMOSIS MEMBRANE MARKET, BY FILTER MODULE, 2017-2025 ($MILLION)
TABLE 73. LAMEA REVERSE OSMOSIS MEMBRANE MARKET, BY APPLICATION, 2017-2025 ($MILLION)
TABLE 74. LAMEA REVERSE OSMOSIS MEMBRANE MARKET, BY COUNTRY, 2017-2025 ($MILLION)
TABLE 75. BRAZIL REVERSE OSMOSIS MEMBRANE MARKET, BY MATERIAL TYPE, 2017-2025 ($MILLION)
TABLE 76. BRAZIL REVERSE OSMOSIS MEMBRANE MARKET, BY FILTER MODULE, 2017-2025 ($MILLION)
TABLE 77. BRAZIL REVERSE OSMOSIS MEMBRANE MARKET, BY APPLICATION, 2017-2025 ($MILLION)
TABLE 78. ARGENTINA REVERSE OSMOSIS MEMBRANE MARKET, BY MATERIAL TYPE, 2017-2025 ($MILLION)
TABLE 79. ARGENTINA REVERSE OSMOSIS MEMBRANE MARKET, BY FILTER MODULE, 2017-2025 ($MILLION)
TABLE 80. ARGENTINA REVERSE OSMOSIS MEMBRANE MARKET, BY APPLICATION, 2017-2025 ($MILLION)
TABLE 81. SOUTH AFRICA REVERSE OSMOSIS MEMBRANE MARKET, BY MATERIAL TYPE, 2017-2025 ($MILLION)
TABLE 82. SOUTH AFRICA REVERSE OSMOSIS MEMBRANE MARKET, BY FILTER MODULE, 2017-2025 ($MILLION)
TABLE 83. SOUTH AFRICA REVERSE OSMOSIS MEMBRANE MARKET, BY APPLICATION, 2017-2025 ($MILLION)
TABLE 84. UAE REVERSE OSMOSIS MEMBRANE MARKET, BY MATERIAL TYPE, 2017-2025 ($MILLION)
TABLE 85. UAE REVERSE OSMOSIS MEMBRANE MARKET, BY FILTER MODULE, 2017-2025 ($MILLION)
TABLE 86. UAE REVERSE OSMOSIS MEMBRANE MARKET, BY APPLICATION, 2017-2025 ($MILLION)
TABLE 87. REST OF LAMEA REVERSE OSMOSIS MEMBRANE MARKET, BY MATERIAL TYPE, 2017-2025 ($MILLION)
TABLE 88. REST OF LAMEA REVERSE OSMOSIS MEMBRANE MARKET, BY FILTER MODULE, 2017-2025 ($MILLION)
TABLE 89. REST OF LAMEA REVERSE OSMOSIS MEMBRANE MARKET, BY APPLICATION, 2017-2025 ($MILLION)
TABLE 90. TORAY INDUSTRIES, INC.: COMPANY SNAPSHOT
TABLE 91. TORAY INDUSTRIES, INC.: OPERATING SEGMENTS
TABLE 92. TORAY INDUSTRIES, INC.: PRODUCT PORTFOLIO
TABLE 93. TORAY INDUSTRIES, INC.: KEY STRATEGIC MOVES AND DEVELOPMENTS
TABLE 94. LG CHEM.: COMPANY SNAPSHOT
TABLE 95. LG CHEM.: OPERATING SEGMENTS
TABLE 96. LG CHEM.: PRODUCT PORTFOLIO
TABLE 97. LG CHEM.: KEY STRATEGIC MOVES AND DEVELOPMENTS
TABLE 98. HYDRANAUTICS (A NITTO GROUP COMPANY): COMPANY SNAPSHOT
TABLE 99. HYDRANAUTICS (NITTO GROUP COMPANY): OPERATING SEGMENTS
TABLE 100. HYDRANAUTICS (NITTO GROUP COMPANY): PRODUCT PORTFOLIO
TABLE 101. HYDRANAUTICS (A NITTO GROUP COMPANY): KEY STRATEGIC MOVES AND DEVELOPMENTS
TABLE 102. TOYOBO CO., LTD.: COMPANY SNAPSHOT
TABLE 103. TOYOBO CO., LTD.: OPERATING SEGMENTS
TABLE 104. TOYOBO CO., LTD.: PRODUCT PORTFOLIO
TABLE 105. LANXESS AG: COMPANY SNAPSHOT
TABLE 106. LANXESS AG: OPERATING SEGMENTS
TABLE 107. LANXESS AG: PRODUCT PORTFOLIO
TABLE 108. LANXESS AG: KEY STRATEGIC MOVES AND DEVELOPMENTS
TABLE 109. THE DOW CHEMICAL COMPANY: COMPANY SNAPSHOT
TABLE 110. THE DOW CHEMICAL COMPANY: OPERATING SEGMENTS
TABLE 111. THE DOW CHEMICAL COMPANY: PRODUCT PORTFOLIO
TABLE 112. THE DOW CHEMICAL COMPANY: KEY STRATEGIC MOVES AND DEVELOPMENTS
TABLE 113. KOCH MEMBRANE SYSTEM, INC.: COMPANY SNAPSHOT
TABLE 114. KOCH MEMBRANE SYSTEM, INC.: PRODUCT PORTFOLIO
TABLE 115. KOCH MEMBRANE SYSTEM, INC.: KEY STRATEGIC MOVES AND DEVELOPMENTS
TABLE 116. MICRODYN-NADIR GMBH: COMPANY SNAPSHOT
TABLE 117. MICRODYN-NADIR GMBH: PRODUCT PORTFOLIO
TABLE 118. MICRODYN-NADIR GMBH: KEY STRATEGIC MOVES AND DEVELOPMENTS
TABLE 119. MEMBRANIUM (JSC RM NANOTECH): COMPANY SNAPSHOT
TABLE 120. MEMBRANIUM (JSC RM NANOTECH): PRODUCT PORTFOLIO
TABLE 121. AXEON WATER TECHNOLOGIES: COMPANY SNAPSHOT
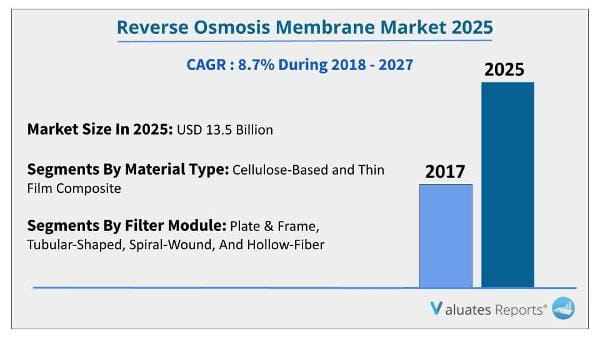
TABLE 122. AXEON WATER TECHNOLOGIES: PRODUCT PORTFOLIO FIGURE 01. REVERSE OSMOSIS MEMBRANE MARKET SNAPSHOT
FIGURE 02. REVERSE OSMOSIS MEMBRANE MARKET SEGMENTATION
FIGURE 03. TOP INVESTMENT POCKETS, 2017-2025
FIGURE 04. TOP WINNING STRATEGIES, BY YEAR, 2015-2018*
FIGURE 05. TOP WINNING STRATEGIES, BY DEVELOPMENT, 2015-2018* (%)
FIGURE 06. TOP WINNING STRATEGIES, BY COMPANY, 2015-2018*
FIGURE 07. MODERATE BARGAINING POWER OF SUPPLIERS
FIGURE 08. HIGH BARGAINING POWER OF BUYERS
FIGURE 09. MODERATE-HIGH THREAT OF NEW ENTRANTS
FIGURE 10. MODERATE THREAT OF SUBSTITUTION
FIGURE 11. HIGH INTENSITY OF COMPETITIVE RIVALRY
FIGURE 12. MARKET PLAYER POSITIONING, 2017
FIGURE 13. REVERSE OSMOSIS MEMBRANE MARKET: DRIVERS, RESTRAINTS, AND OPPORTUNITIES, 2018-2025
FIGURE 14. ENERGY REQUIRED FOR DESALINATION, BY TECHNOLOGY (KWH/M3)
FIGURE 15. REVERSE OSMOSIS MEMBRANE MARKET, BY MATERIAL TYPE, 2017 (%)
FIGURE 16. COMPARATIVE SHARE ANALYSIS OF CELLULOSE-BASED REVERSE OSMOSIS MEMBRANE MARKET, BY COUNTRY, 2017 & 2025 (%)
FIGURE 17. COMPARATIVE SHARE ANALYSIS OF THIN FILM COMPOSITE REVERSE OSMOSIS MEMBRANE MARKET, BY COUNTRY, 2017 & 2025 (%)
FIGURE 18. REVERSE OSMOSIS MEMBRANE MARKET, BY FILTER MODULE, 2017 (%)
FIGURE 19. COMPARATIVE SHARE ANALYSIS OF PLATE & FRAME REVERSE OSMOSIS MEMBRANE MARKET, BY COUNTRY, 2017 & 2025 (%)
FIGURE 20. COMPARATIVE SHARE ANALYSIS OF TUBULAR-SHAPED REVERSE OSMOSIS MEMBRANE MARKET, BY COUNTRY, 2017 & 2025 (%)
FIGURE 21. COMPARATIVE SHARE ANALYSIS OF SPIRAL-WOUND REVERSE OSMOSIS MEMBRANE MARKET, BY COUNTRY, 2017 & 2025 (%)
FIGURE 22. COMPARATIVE SHARE ANALYSIS OF HOLLOW-FIBER REVERSE OSMOSIS MEMBRANE MARKET, BY COUNTRY, 2017 & 2025 (%)
FIGURE 23. REVERSE OSMOSIS MEMBRANE MARKET, BY APPLICATION, 2017 (%)
FIGURE 24. COMPARATIVE SHARE ANALYSIS OF REVERSE OSMOSIS MEMBRANE MARKET FOR DESALINATION SYSTEM, BY COUNTRY, 2017 & 2025 (%)
FIGURE 25. COMPARATIVE SHARE ANALYSIS OF REVERSE OSMOSIS MEMBRANE MARKET FOR RO PURIFICATION SYSTEM, BY COUNTRY, 2017 & 2025 (%)
FIGURE 26. REVERSE OSMOSIS MEMBRANE MARKET, BY REGION, 2017 (%)
FIGURE 27. U.S. REVERSE OSMOSIS MEMBRANE MARKET, 2017-2025 ($MILLION)
FIGURE 28. CANADA REVERSE OSMOSIS MEMBRANE MARKET, 2017-2025 ($MILLION)
FIGURE 29. MEXICO REVERSE OSMOSIS MEMBRANE MARKET, 2017-2025 ($MILLION)
FIGURE 30. GERMANY REVERSE OSMOSIS MEMBRANE MARKET, 2017-2025 ($MILLION)
FIGURE 31. SPAIN REVERSE OSMOSIS MEMBRANE MARKET, 2017-2025 ($MILLION)
FIGURE 32. UK REVERSE OSMOSIS MEMBRANE MARKET, 2017-2025 ($MILLION)
FIGURE 33. ITALY REVERSE OSMOSIS MEMBRANE MARKET, 2017-2025 ($MILLION)
FIGURE 34. FRANCE REVERSE OSMOSIS MEMBRANE MARKET, 2017-2025 ($MILLION)
FIGURE 35. REST OF EUROPE REVERSE OSMOSIS MEMBRANE MARKET, 2017-2025 ($MILLION)
FIGURE 36. CHINA REVERSE OSMOSIS MEMBRANE MARKET, 2017-2025 ($MILLION)
FIGURE 37. INDIA REVERSE OSMOSIS MEMBRANE MARKET, 2017-2025 ($MILLION)
FIGURE 38. JAPAN REVERSE OSMOSIS MEMBRANE MARKET, 2017-2025 ($MILLION)
FIGURE 39. AUSTRALIA REVERSE OSMOSIS MEMBRANE MARKET, 2017-2025 ($MILLION)
FIGURE 40. SOUTH KOREA REVERSE OSMOSIS MEMBRANE MARKET, 2017-2025 ($MILLION)
FIGURE 41. REST OF ASIA-PACIFIC REVERSE OSMOSIS MEMBRANE MARKET, 2017-2025 ($MILLION)
FIGURE 42. BRAZIL REVERSE OSMOSIS MEMBRANE MARKET, 2017-2025 ($MILLION)
FIGURE 43. ARGENTINA REVERSE OSMOSIS MEMBRANE MARKET, 2017-2025 ($MILLION)
FIGURE 44. SOUTH AFRICA REVERSE OSMOSIS MEMBRANE MARKET, 2017-2025 ($MILLION)
FIGURE 45. UAE REVERSE OSMOSIS MEMBRANE MARKET, 2017-2025 ($MILLION)
FIGURE 46. REST OF LAMEA REVERSE OSMOSIS MEMBRANE MARKET, 2017-2025 ($MILLION)
FIGURE 47. TORAY INDUSTRIES, INC.: REVENUE, 2015-2017 ($MILLION)
FIGURE 48. TORAY INDUSTRIES, INC.: REVENUE SHARE, BY SEGMENT, 2017 (%)
FIGURE 49. TORAY INDUSTRIES, INC.: REVENUE SHARE, BY GEOGRAPHY, 2017 (%)
FIGURE 50. LG CHEM.: REVENUE, 2015-2017 ($MILLION)
FIGURE 51. LG CHEM.: REVENUE SHARE, BY SEGMENT, 2017 (%)
FIGURE 52. LG CHEM.: REVENUE SHARE, BY GEOGRAPHY, 2017 (%)
FIGURE 53. HYDRANAUTICS (A NITTO GROUP COMPANY): REVENUE, 2015-2017 ($MILLION)
FIGURE 54. HYDRANAUTICS (A NITTO GROUP COMPANY): REVENUE SHARE, BY SEGMENT, 2017 (%)
FIGURE 55. HYDRANAUTICS (A NITTO GROUP COMPANY): REVENUE SHARE, BY GEOGRAPHY, 2017 (%)
FIGURE 56. TOYOBO CO., LTD.: REVENUE, 2015-2017 ($MILLION)
FIGURE 57. TOYOBO CO., LTD.: REVENUE SHARE, BY SEGMENT, 2017 (%)
FIGURE 58. TOYOBO CO., LTD.: REVENUE SHARE, BY GEOGRAPHY, 2017 (%)
FIGURE 59. LANXESS AG: REVENUE, 2015-2017 ($MILLION)
FIGURE 60. LANXESS AG: REVENUE SHARE, BY SEGMENT, 2017 (%)
FIGURE 61. LANXESS AG: REVENUE SHARE, BY GEOGRAPHY, 2017 (%)
FIGURE 62. THE DOW CHEMICAL COMPANY: REVENUE, 2015-2017 ($MILLION)
FIGURE 63. THE DOW CHEMICAL COMPANY: REVENUE SHARE, BY SEGMENT, 2017 (%)
FIGURE 64. THE DOW CHEMICAL COMPANY: REVENUE SHARE, BY GEOGRAPHY, 2017 (%
SELECT A FORMAT
Added to Cart
Electronic (PDF)

$5370

This license allows only one user to access the PDF.
Electronic (PDF)

$6450

This license allows 1 - 5 user to access the PDF, license is suitable for small groups of 5 users working together
Electronic (PDF)

$8995

This license allows users/teams in a same Enterprise to use this report, various departments within an enterpise can use this report
Add to Cart
Buy Now (15% Discount)

OUR CUSTOMER

Bioinformatics Barcelona

SIMILAR REPORTS