0
  • Category
  • Region
U.S. (TOLL FREE)
+1 (315) 215-3225
0
U.S. (TOLL FREE)
+1 (315) 215-3225
Recycled Plastic Market By Type (Polyethylene Terephthalate (PET) , High Density Polyethylene (HDPE), Polypropylene (PP), Others), By End-use Industry (Agriculture, Farming and Gardening, Building and Construction, Packaging, Automotive, Electrical and Electronics, Others): Global Opportunity Analysis and Industry Forecast, 2023-2032
Published Date: September 2023
|
Report Code: ALLI-Auto-4L623
Home | Market Reports | Business & Industrial| Chemicals Industry| Plastics & Polymers
Recycled Plastic Market By Type Polyethylene Terephthalate PET High Density Polyethylene HDPE Polypropylene PP Others By End use Industry Agriculture Farming and Gardening Building and Construction Packaging Automotive Electrical and Electronics Others Global Opportunity Analysis and Industry Forecast 2023 2032
BUY CHAPTERS

Recycled Plastic Market By Type (Polyethylene Terephthalate (PET) , High Density Polyethylene (HDPE), Polypropylene (PP), Others), By End-use Industry (Agriculture, Farming and Gardening, Building and Construction, Packaging, Automotive, Electrical and Electronics, Others): Global Opportunity Analysis and Industry Forecast, 2023-2032

Code: ALLI-Auto-4L623
Report
September 2023
Pages:294
Allied Market Research
Buy Now with 15% Discount
DESCRIPTION
TABLE OF CONTENT
TABLES & FIGURES

Recycled Plastic Market Size

According to a new report published by , titled, “Recycled Plastic Market," The recycled plastic market was valued at $66.7 billion in 2022, and is estimated to reach $141.9 billion by 2032, growing at a CAGR of 7.9% from 2023 to 2032.

Recycled Plastic Market

Recycled Plastic Market

Recycled plastics refer to plastics that have undergone a process of recycling, which involves collecting used or discarded plastic products, breaking them down into their raw material form, and then using these materials to create new plastic products. The goal of recycling plastics is to reduce the environmental impact of plastic waste by reusing the material rather than disposing it in landfills or incinerating it.
Recycled plastics can offer unique properties and appearances that differ from virgin plastics. This opens up opportunities for innovative product designs that utilize these distinctive characteristics. Industries are leveraging these possibilities to create aesthetically pleasing and functional products. Furthermore, using recycled plastics can often be more cost-effective than using virgin plastics, especially when considering the rising costs of raw materials and waste disposal. Industries that adopt recycled plastics can benefit from reduced material costs and potential tax incentives or subsidies for environmentally-friendly practices. Moreover, many regions are implementing regulations aimed at reducing plastic waste and promoting recycling. Industries are encouraged to incorporate recycled content into their products to comply with these regulations. Additionally, businesses are recognizing the importance of Environmental, Social, and Governance (ESG) initiatives, and using recycled plastics aligns with their sustainability goals. Businesses are using the integration of recycled plastics as a way to differentiate themselves in competitive markets. Products that highlight their use of recycled materials can stand out and appeal to a wider customer base.
However, the viability of the recycled plastics market depends on the availability of a robust recycling infrastructure. When petroleum prices are low, the financial incentive to invest in and expand recycling facilities may decrease, potentially slowing down the growth of the recycled plastics market. This can lead to a lack of capacity to process and supply recycled plastics, limiting their availability even when demand is present. Moreover, manufacturers and recyclers in the plastics industry often work with thin profit margins. Fluctuations in petroleum prices can directly impact their profitability. When petroleum prices rise, the cost of producing virgin plastics can increase, potentially making recycled plastics more competitive. Conversely, when petroleum prices are low, manufacturers may opt for virgin plastics over recycled ones, affecting the demand for recycled materials.
Recycled plastics offer opportunities for developing innovative products with unique properties. The unique properties of recycled plastics can enable the creation of entirely new product designs that were previously not possible with conventional materials. For instance, lightweight yet robust structures could be developed for applications in industries such as automotive, aerospace, and construction. Developing innovative products using recycled plastics aligns with the principles of the circular economy. This approach aims to minimize waste and extend the lifecycle of materials by reusing and recycling them. Companies that adopt circular economy practices can benefit from positive public perception and regulatory support. Developing innovative products using recycled plastics can establish a company as a leader in sustainability and innovation within its industry. This can lead to positive media coverage, brand recognition, and increased market share. As governments and regulatory bodies implement stricter rules on plastic usage and waste management, companies that proactively adopt recycled plastics in their products can position themselves for compliance and avoid potential penalties. These factors are anticipated to boost the market expansion in the upcoming years.
The recycled plastics market share is segmented on the basis of type, end-use industry, and region. By type, it is classified into polyethylene terephthalate (PET), high density polyethylene (HDPE), polypropylene (PP), and others. By end-use industry, it is classified into agriculture, farming & gardening, building & construction, packaging, automotive, electrical & electronics and others. By region, the market is analyzed across North America, Europe, Asia-Pacific, and LAMEA.
The key players profiled in the recycled plastics market report include KW Plastics, Veolia, Green Line Polymers, Custom Polymers, Clear Path Recycling, B. Schoenberg & Co., Jayplas, Plastipak Holdings, Ultra Poly Corporation, and Joes Plastics Inc. 
The report offers a comprehensive analysis of the global recycled plastics market trends by thoroughly studying different aspects of the market including major segments, market statistics, market dynamics, regional market outlook, investment opportunities, and top players working towards the growth of the market. The report also highlights the present scenario and upcoming trends & developments that are contributing toward the growth of the market. Moreover, restraints and challenges that hold power to obstruct the market growth are also profiled in the report along with the Porter’s five forces analysis of the market to elucidate factors such as competitive landscape, bargaining power of buyers and suppliers, threats of new players, and emergence of substitutes in the market.
Impact of COVID-19 on the Global Recycled Plastics Industry
The COVID-19 pandemic disrupted supply chains globally, affecting the collection, processing, and transportation of recyclable materials, including plastics. Lockdowns, restrictions on movement, and reduced workforce availability led to challenges in maintaining the recycling infrastructure.
Many industries that use recycled plastics, such as automotive and construction, experienced reduced demand due to economic uncertainties and lockdown measures. This resulted in decreased demand for recycled plastic materials. The price of virgin plastic is closely tied to the price of oil, and the dramatic fluctuations in oil prices in the early months of the pandemic had an impact on the cost competitiveness of recycled plastics compared to their virgin counterparts.
The pandemic led to changes in consumer behavior, with an increase in online shopping and takeaway food orders. This resulted in a higher demand for single-use plastic packaging, partially offsetting the push for sustainable alternatives and potentially affecting the demand for recycled plastics.
Despite the challenges posed by the pandemic, the sustainability agenda has not been abandoned. Many governments, industries, and consumers continue to prioritize reducing plastic waste and promoting recycling efforts as part of broader environmental goals.
Key Findings of the Study
Based on type, the polyethylene terephthalate (PET) sub-segment emerged as the global leader in 2022 and is anticipated to be the fastest growing during the forecast period.
Based on end-use industry, the agriculture, farming & gardening sub-segment emerged as the global leader in 2022 and is predicted to show the fastest growth in the upcoming years.
Based on region, Asia-Pacific registered the highest market share in 2022 and LAMEA is projected to be the fastest growing during the forecast period.

Overview

The global recycled plastics market is anticipated to reach $141.9 billion by 2032, growing from $66.7 billion in 2022 at a CAGR of 7.9% from 2023 to 2032.
Recycled plastics refer to plastics that have undergone a process of recycling, which involves converting used or discarded plastic materials into new products. Plastics are widely used in various industries and everyday products, but their persistence in the environment and potential harm to ecosystems have raised concerns about their disposal.
The extended producer responsibility (EPR) schemes make producers responsible for the end-of-life management of their products including the proper disposal and recycling. This incentivizes producers to design products that are more easily recyclable and to use recycled materials in their production. There is a direct connection between EPR policies and the demand for recycled plastics. Moreover, government-imposed bans on single-use plastics or specific types of plastic products can drive the demand for recycled plastics. When certain plastic items are banned, businesses and consumers look for alternatives which often include products made from recycled plastics. This creates a market demand for recycled plastic materials and encourages manufacturers to incorporate them into their production processes. Governments that promote the transition to a circular economy focus on reducing waste and maximizing the value of materials throughout their lifecycle. This often involves policies that encourage recycling, resource efficiency, and the use of recycled materials. Such initiatives create a favorable environment for the recycled plastics market to thrive. Regulations related to waste management, including collection, sorting, and recycling infrastructure, can significantly influence the recycled plastics market. Adequate waste management infrastructure is essential for the effective processing and utilization of recycled plastics.
The hurdles posed by limited infrastructure are indeed significant challenges for the growth of the recycled plastics market. Effective recycling starts with proper collection and sorting of plastic waste. Without adequate infrastructure for collection, it becomes difficult to gather plastic waste from various sources, such as households, industries, and commercial establishments. Similarly, sorting facilities are necessary to separate different types of plastics based on their resin types, colors, and other characteristics. Without proper sorting, the quality of recycled plastic output can be compromised. Moreover, transportation is a crucial aspect of recycling. Plastic waste needs to be transported from collection points to recycling facilities. In regions with limited infrastructure, poor transportation networks can lead to increased costs and delays. Additionally, long transportation distances can negate some of the environmental benefits of recycling due to increased carbon emissions from transport.
Recycled plastics offer opportunities for developing innovative products with unique properties. Recycled plastics can be tailored to have specific properties such as enhanced strength, flexibility, heat resistance, or UV stability. This allows for the creation of products that perform better than traditional virgin plastic counterparts in particular applications. For instance, recycled plastics with improved UV resistance could be used for outdoor products that need to withstand prolonged sun exposure. Furthermore, innovative products made from recycled plastics contribute to sustainability by reducing the demand for virgin plastics, which require more energy and resources to produce. This aligns with growing consumer and regulatory preferences for environmentally friendly products. Utilizing recycled plastics promotes a circular economy model where materials are reused and reprocessed, reducing the amount of plastic waste in landfills and oceans. This can lead to improved resource efficiency and decreased environmental impact. Consumers are increasingly seeking products that have a lower environmental footprint. Innovative products made from recycled plastics can tap into this market demand, potentially leading to higher consumer interest and loyalty.
The COVID-19 pandemic has had significant impacts on the market for recycled plastics. The global lockdowns and restrictions imposed to curb the spread of COVID-19 initially disrupted supply chains across industries, including the recycled plastics market. This was due to disruptions in transportation, reduced workforce availability, and the closure of recycling facilities. Many industries that are key consumers of recycled plastics, such as automotive and construction, faced significant slowdowns in production, leading to reduced demand for recycled plastics. The uncertainty caused by the pandemic led to price volatility in the recycled plastics market. Fluctuations in oil prices also impacted the cost competitiveness of recycled plastics relative to virgin plastics. Moreover, the pandemic led to an increased demand for single-use plastics such as packaging for medical supplies and personal protective equipment (PPE). This raised concerns about the potential setback to efforts to reduce plastic waste and promote recycling. The shift to remote work and online shopping influenced waste generation patterns. Increased e-commerce activity led to more packaging waste, raising the importance of sustainable packaging solutions, including those made from recycled plastics.
The key players profiled in this report include KW Plastics, Veolia, Green Line Polymers, Custom Polymers, Clear Path Recycling, B. Schoenberg & Co., Jayplas, Plastipak Holdings, Ultra Poly Corporation, and Joes Plastics Inc. The market players are continuously striving to achieve a dominant position in this competitive market using strategies such as collaborations and acquisitions.

Key Benefits For Stakeholders

●This report provides a quantitative analysis of the market segments, current trends, estimations, and dynamics of the recycled plastic market analysis from 2022 to 2032 to identify the prevailing recycled plastic market opportunities.
●The market research is offered along with information related to key drivers, restraints, and opportunities.
●Porter's five forces analysis highlights the potency of buyers and suppliers to enable stakeholders make profit-oriented business decisions and strengthen their supplier-buyer network.
●In-depth analysis of the recycled plastic market segmentation assists to determine the prevailing market opportunities.
●Major countries in each region are mapped according to their revenue contribution to the global market.
●Market player positioning facilitates benchmarking and provides a clear understanding of the present position of the market players.
●The report includes the analysis of the regional as well as global recycled plastic market trends, key players, market segments, application areas, and market growth strategies.

Additional benefits you will get with this purchase are:

● Quarterly Update and* (only available with a corporate license, on listed price)
● 5 additional Company Profile of client Choice pre- or Post-purchase, as a free update.
● Free Upcoming Version on the Purchase of Five and Enterprise User License.
● 16 analyst hours of support* (post-purchase, if you find additional data requirements upon review of the report, you may receive support amounting to 16 analyst hours to solve questions, and post-sale queries)
● 15% Free Customization* (in case the scope or segment of the report does not match your requirements, 15% is equivalent to 3 working days of free work, applicable once)
● Free data Pack on the Five and Enterprise User License. (Excel version of the report)
● Free Updated report if the report is 6-12 months old or older.
● 24-hour priority response*
● Free Industry updates and white papers.
Possible Customization with this report (with additional cost and timeline, please talk to the sales executive to know more)
● Investment Opportunities
● Supply Chain Analysis & Vendor Margins
● Technology Trend Analysis
○ Joes Plastics Inc

Scope of Recycled Plastic Market Report

Report Metric Details
Report Name Recycled Plastic Market
Accounted market size in 2022 $ 66.7 in billion
Forecasted market size in 2032 $ 141.9 billion
CAGR 7.9%
Base Year 2022
Forecasted years 2024 - 2032
By Type ● Polyethylene Terephthalate (PET) 
● High Density Polyethylene (HDPE)
● Polypropylene (PP)
● Others
By End-use Industry ● Agriculture, Farming and Gardening
● Building and Construction
● Packaging
● Automotive
● Electrical and Electronics
● Others
By Region
  • North America (United States, Canada)
  • Europe (Germany, France, UK, Italy, Russia) Rest of Europe
  • Nordic Countries
  • Asia-Pacific (China, Japan, South Korea)
  • Southeast Asia (India, Australia)
  • Rest of Asia
  • Latin America (Mexico, Brazil)
  • Rest of Latin America
  • Middle East & Africa (Turkey, Saudi Arabia, UAE, Rest of MEA)
● New Product Development/ Product Matrix of Key Players ● Regulatory Guidelines, ● Additional company profiles with specific to client's interest, ● Additional country or region analysis- market size and forecast, ● Criss-cross segment analysis- market size and forecast, ● Expanded list for Company Profiles, ● Historic market data, ● Key player details (including location, contact details, supplier/vendor network etc. in excel format), ● List of customers/consumers/raw material suppliers- value chain analysis, ● SWOT Analysis, Key Market Segments
Forecast units USD million in value
Report coverage Revenue and volume forecast, company share, competitive landscape, growth factors and trends

FAQ for this report

How fast is Recycled Plastic Market growing?

Ans: The Recycled Plastic Market witnessing a CAGR of 7.9% during the forecast period 2024-2032.

What is the Recycled Plastic Market size in 2032?

Ans: The Recycled Plastic Market size in 2032 will be $ 141.9 billion.

Who are the main players in the Recycled Plastic Market report?

Ans: The main players in the Recycled Plastic Market are ● Regulatory Guidelines, ● Additional company profiles with specific to client's interest, ● Additional country or region analysis- market size and forecast, ● Criss-cross segment analysis- market size and forecast, ● Expanded list for Company Profiles, ● Historic market data, ● Key player details (including location, contact details, supplier/vendor network etc. in excel format), ● List of customers/consumers/raw material suppliers- value chain analysis, ● SWOT Analysis, Key Market Segments

What are the Type segmentation covered in the Recycled Plastic Market report?

Ans: The Types covered in the Recycled Plastic Market report are ● Polyethylene Terephthalate (PET), ● High Density Polyethylene (HDPE), ● Polypropylene (PP), ● Others

CHAPTER 1: INTRODUCTION
1.1. Report description
1.2. Key market segments
1.3. Key benefits to the stakeholders
1.4. Research Methodology
1.4.1. Primary research
1.4.2. Secondary research
1.4.3. Analyst tools and models
CHAPTER 2: EXECUTIVE SUMMARY
2.1. CXO Perspective
CHAPTER 3: MARKET OVERVIEW
3.1. Market definition and scope
3.2. Key findings
3.2.1. Top impacting factors
3.2.2. Top investment pockets
3.3. Porter’s five forces analysis
3.4. Market dynamics
3.4.1. Drivers
3.4.2. Restraints
3.4.3. Opportunities
3.5. Average Selling Price
3.6. Market Share Analysis
3.7. Brand Share Analysis
3.8. Trade Data Analysis
3.9. Product Consumption
3.10. Value Chain Analysis
3.11. Regulatory Guidelines
3.12. Key Regulation Analysis
3.13. Reimbursement Scenario
3.14. Patent Landscape
CHAPTER 4: RECYCLED PLASTIC MARKET, BY TYPE
4.1. Overview
4.1.1. Market size and forecast
4.2. Polyethylene Terephthalate (PET)
4.2.1. Key market trends, growth factors and opportunities
4.2.2. Market size and forecast, by region
4.2.3. Market share analysis by country
4.3. High Density Polyethylene (HDPE)
4.3.1. Key market trends, growth factors and opportunities
4.3.2. Market size and forecast, by region
4.3.3. Market share analysis by country
4.4. Polypropylene (PP)
4.4.1. Key market trends, growth factors and opportunities
4.4.2. Market size and forecast, by region
4.4.3. Market share analysis by country
4.5. Others
4.5.1. Key market trends, growth factors and opportunities
4.5.2. Market size and forecast, by region
4.5.3. Market share analysis by country
CHAPTER 5: RECYCLED PLASTIC MARKET, BY END-USE INDUSTRY
5.1. Overview
5.1.1. Market size and forecast
5.2. Agriculture, Farming and Gardening
5.2.1. Key market trends, growth factors and opportunities
5.2.2. Market size and forecast, by region
5.2.3. Market share analysis by country
5.3. Building and Construction
5.3.1. Key market trends, growth factors and opportunities
5.3.2. Market size and forecast, by region
5.3.3. Market share analysis by country
5.4. Packaging
5.4.1. Key market trends, growth factors and opportunities
5.4.2. Market size and forecast, by region
5.4.3. Market share analysis by country
5.5. Automotive
5.5.1. Key market trends, growth factors and opportunities
5.5.2. Market size and forecast, by region
5.5.3. Market share analysis by country
5.6. Electrical and Electronics
5.6.1. Key market trends, growth factors and opportunities
5.6.2. Market size and forecast, by region
5.6.3. Market share analysis by country
5.7. Others
5.7.1. Key market trends, growth factors and opportunities
5.7.2. Market size and forecast, by region
5.7.3. Market share analysis by country
CHAPTER 6: RECYCLED PLASTIC MARKET, BY REGION
6.1. Overview
6.1.1. Market size and forecast By Region
6.2. North America
6.2.1. Key market trends, growth factors and opportunities
6.2.2. Market size and forecast, by Type
6.2.3. Market size and forecast, by End-use Industry
6.2.4. Market size and forecast, by country
6.2.4.1. U.S.
6.2.4.1.1. Market size and forecast, by Type
6.2.4.1.2. Market size and forecast, by End-use Industry
6.2.4.2. Canada
6.2.4.2.1. Market size and forecast, by Type
6.2.4.2.2. Market size and forecast, by End-use Industry
6.2.4.3. Mexico
6.2.4.3.1. Market size and forecast, by Type
6.2.4.3.2. Market size and forecast, by End-use Industry
6.3. Europe
6.3.1. Key market trends, growth factors and opportunities
6.3.2. Market size and forecast, by Type
6.3.3. Market size and forecast, by End-use Industry
6.3.4. Market size and forecast, by country
6.3.4.1. Netherlands
6.3.4.1.1. Market size and forecast, by Type
6.3.4.1.2. Market size and forecast, by End-use Industry
6.3.4.2. Norway
6.3.4.2.1. Market size and forecast, by Type
6.3.4.2.2. Market size and forecast, by End-use Industry
6.3.4.3. Spain
6.3.4.3.1. Market size and forecast, by Type
6.3.4.3.2. Market size and forecast, by End-use Industry
6.3.4.4. Germany
6.3.4.4.1. Market size and forecast, by Type
6.3.4.4.2. Market size and forecast, by End-use Industry
6.3.4.5. Denmark
6.3.4.5.1. Market size and forecast, by Type
6.3.4.5.2. Market size and forecast, by End-use Industry
6.3.4.6. Rest of Europe
6.3.4.6.1. Market size and forecast, by Type
6.3.4.6.2. Market size and forecast, by End-use Industry
6.4. Asia-Pacific
6.4.1. Key market trends, growth factors and opportunities
6.4.2. Market size and forecast, by Type
6.4.3. Market size and forecast, by End-use Industry
6.4.4. Market size and forecast, by country
6.4.4.1. China
6.4.4.1.1. Market size and forecast, by Type
6.4.4.1.2. Market size and forecast, by End-use Industry
6.4.4.2. Japan
6.4.4.2.1. Market size and forecast, by Type
6.4.4.2.2. Market size and forecast, by End-use Industry
6.4.4.3. India
6.4.4.3.1. Market size and forecast, by Type
6.4.4.3.2. Market size and forecast, by End-use Industry
6.4.4.4. South Korea
6.4.4.4.1. Market size and forecast, by Type
6.4.4.4.2. Market size and forecast, by End-use Industry
6.4.4.5. Australia
6.4.4.5.1. Market size and forecast, by Type
6.4.4.5.2. Market size and forecast, by End-use Industry
6.4.4.6. Rest of Asia-Pacific
6.4.4.6.1. Market size and forecast, by Type
6.4.4.6.2. Market size and forecast, by End-use Industry
6.5. LAMEA
6.5.1. Key market trends, growth factors and opportunities
6.5.2. Market size and forecast, by Type
6.5.3. Market size and forecast, by End-use Industry
6.5.4. Market size and forecast, by country
6.5.4.1. Brazil
6.5.4.1.1. Market size and forecast, by Type
6.5.4.1.2. Market size and forecast, by End-use Industry
6.5.4.2. Argentina
6.5.4.2.1. Market size and forecast, by Type
6.5.4.2.2. Market size and forecast, by End-use Industry
6.5.4.3. United Arab Emirates
6.5.4.3.1. Market size and forecast, by Type
6.5.4.3.2. Market size and forecast, by End-use Industry
6.5.4.4. South Africa
6.5.4.4.1. Market size and forecast, by Type
6.5.4.4.2. Market size and forecast, by End-use Industry
6.5.4.5. Rest of LAMEA
6.5.4.5.1. Market size and forecast, by Type
6.5.4.5.2. Market size and forecast, by End-use Industry
CHAPTER 7: COMPETITIVE LANDSCAPE
7.1. Introduction
7.2. Top winning strategies
7.3. Product Mapping of Top 10 Player
7.4. Competitive Dashboard
7.5. Competitive Heatmap
7.6. Top player positioning, 2022
CHAPTER 8: COMPANY PROFILES
8.1. KW Plastics
8.1.1. Company overview
8.1.2. Key Executives
8.1.3. Company snapshot
8.2. Veolia
8.2.1. Company overview
8.2.2. Key Executives
8.2.3. Company snapshot
8.3. Green Line Polymers
8.3.1. Company overview
8.3.2. Key Executives
8.3.3. Company snapshot
8.4. Clear Path Recycling
8.4.1. Company overview
8.4.2. Key Executives
8.4.3. Company snapshot
8.5. Custom Polymers
8.5.1. Company overview
8.5.2. Key Executives
8.5.3. Company snapshot
8.6. Jayplas
8.6.1. Company overview
8.6.2. Key Executives
8.6.3. Company snapshot
8.7. Ultra Poly Corporation
8.7.1. Company overview
8.7.2. Key Executives
8.7.3. Company snapshot
8.8. Plastipak holdings
8.8.1. Company overview
8.8.2. Key Executives
8.8.3. Company snapshot
8.9. B. Schoenberg & Co.
8.9.1. Company overview
8.9.2. Key Executives
8.9.3. Company snapshot
8.10. Joes Plastics Inc.
8.10.1. Company overview
8.10.2. Key Executives
8.10.3. Company snapsho
LIST OF TABLES
TABLE 01. GLOBAL RECYCLED PLASTIC MARKET, BY TYPE, 2022-2032 ($MILLION)
TABLE 02. RECYCLED PLASTIC MARKET FOR POLYETHYLENE TEREPHTHALATE (PET) , BY REGION, 2022-2032 ($MILLION)
TABLE 03. RECYCLED PLASTIC MARKET FOR HIGH DENSITY POLYETHYLENE (HDPE), BY REGION, 2022-2032 ($MILLION)
TABLE 04. RECYCLED PLASTIC MARKET FOR POLYPROPYLENE (PP), BY REGION, 2022-2032 ($MILLION)
TABLE 05. RECYCLED PLASTIC MARKET FOR OTHERS, BY REGION, 2022-2032 ($MILLION)
TABLE 06. GLOBAL RECYCLED PLASTIC MARKET, BY END-USE INDUSTRY, 2022-2032 ($MILLION)
TABLE 07. RECYCLED PLASTIC MARKET FOR AGRICULTURE, FARMING AND GARDENING, BY REGION, 2022-2032 ($MILLION)
TABLE 08. RECYCLED PLASTIC MARKET FOR BUILDING AND CONSTRUCTION, BY REGION, 2022-2032 ($MILLION)
TABLE 09. RECYCLED PLASTIC MARKET FOR PACKAGING, BY REGION, 2022-2032 ($MILLION)
TABLE 10. RECYCLED PLASTIC MARKET FOR AUTOMOTIVE, BY REGION, 2022-2032 ($MILLION)
TABLE 11. RECYCLED PLASTIC MARKET FOR ELECTRICAL AND ELECTRONICS, BY REGION, 2022-2032 ($MILLION)
TABLE 12. RECYCLED PLASTIC MARKET FOR OTHERS, BY REGION, 2022-2032 ($MILLION)
TABLE 13. RECYCLED PLASTIC MARKET, BY REGION, 2022-2032 ($MILLION)
TABLE 14. NORTH AMERICA RECYCLED PLASTIC MARKET, BY TYPE, 2022-2032 ($MILLION)
TABLE 15. NORTH AMERICA RECYCLED PLASTIC MARKET, BY END-USE INDUSTRY, 2022-2032 ($MILLION)
TABLE 16. NORTH AMERICA RECYCLED PLASTIC MARKET, BY COUNTRY, 2022-2032 ($MILLION)
TABLE 17. U.S. RECYCLED PLASTIC MARKET, BY TYPE, 2022-2032 ($MILLION)
TABLE 18. U.S. RECYCLED PLASTIC MARKET, BY END-USE INDUSTRY, 2022-2032 ($MILLION)
TABLE 19. CANADA RECYCLED PLASTIC MARKET, BY TYPE, 2022-2032 ($MILLION)
TABLE 20. CANADA RECYCLED PLASTIC MARKET, BY END-USE INDUSTRY, 2022-2032 ($MILLION)
TABLE 21. MEXICO RECYCLED PLASTIC MARKET, BY TYPE, 2022-2032 ($MILLION)
TABLE 22. MEXICO RECYCLED PLASTIC MARKET, BY END-USE INDUSTRY, 2022-2032 ($MILLION)
TABLE 23. EUROPE RECYCLED PLASTIC MARKET, BY TYPE, 2022-2032 ($MILLION)
TABLE 24. EUROPE RECYCLED PLASTIC MARKET, BY END-USE INDUSTRY, 2022-2032 ($MILLION)
TABLE 25. EUROPE RECYCLED PLASTIC MARKET, BY COUNTRY, 2022-2032 ($MILLION)
TABLE 26. NETHERLANDS RECYCLED PLASTIC MARKET, BY TYPE, 2022-2032 ($MILLION)
TABLE 27. NETHERLANDS RECYCLED PLASTIC MARKET, BY END-USE INDUSTRY, 2022-2032 ($MILLION)
TABLE 28. NORWAY RECYCLED PLASTIC MARKET, BY TYPE, 2022-2032 ($MILLION)
TABLE 29. NORWAY RECYCLED PLASTIC MARKET, BY END-USE INDUSTRY, 2022-2032 ($MILLION)
TABLE 30. SPAIN RECYCLED PLASTIC MARKET, BY TYPE, 2022-2032 ($MILLION)
TABLE 31. SPAIN RECYCLED PLASTIC MARKET, BY END-USE INDUSTRY, 2022-2032 ($MILLION)
TABLE 32. GERMANY RECYCLED PLASTIC MARKET, BY TYPE, 2022-2032 ($MILLION)
TABLE 33. GERMANY RECYCLED PLASTIC MARKET, BY END-USE INDUSTRY, 2022-2032 ($MILLION)
TABLE 34. DENMARK RECYCLED PLASTIC MARKET, BY TYPE, 2022-2032 ($MILLION)
TABLE 35. DENMARK RECYCLED PLASTIC MARKET, BY END-USE INDUSTRY, 2022-2032 ($MILLION)
TABLE 36. REST OF EUROPE RECYCLED PLASTIC MARKET, BY TYPE, 2022-2032 ($MILLION)
TABLE 37. REST OF EUROPE RECYCLED PLASTIC MARKET, BY END-USE INDUSTRY, 2022-2032 ($MILLION)
TABLE 38. ASIA-PACIFIC RECYCLED PLASTIC MARKET, BY TYPE, 2022-2032 ($MILLION)
TABLE 39. ASIA-PACIFIC RECYCLED PLASTIC MARKET, BY END-USE INDUSTRY, 2022-2032 ($MILLION)
TABLE 40. ASIA-PACIFIC RECYCLED PLASTIC MARKET, BY COUNTRY, 2022-2032 ($MILLION)
TABLE 41. CHINA RECYCLED PLASTIC MARKET, BY TYPE, 2022-2032 ($MILLION)
TABLE 42. CHINA RECYCLED PLASTIC MARKET, BY END-USE INDUSTRY, 2022-2032 ($MILLION)
TABLE 43. JAPAN RECYCLED PLASTIC MARKET, BY TYPE, 2022-2032 ($MILLION)
TABLE 44. JAPAN RECYCLED PLASTIC MARKET, BY END-USE INDUSTRY, 2022-2032 ($MILLION)
TABLE 45. INDIA RECYCLED PLASTIC MARKET, BY TYPE, 2022-2032 ($MILLION)
TABLE 46. INDIA RECYCLED PLASTIC MARKET, BY END-USE INDUSTRY, 2022-2032 ($MILLION)
TABLE 47. SOUTH KOREA RECYCLED PLASTIC MARKET, BY TYPE, 2022-2032 ($MILLION)
TABLE 48. SOUTH KOREA RECYCLED PLASTIC MARKET, BY END-USE INDUSTRY, 2022-2032 ($MILLION)
TABLE 49. AUSTRALIA RECYCLED PLASTIC MARKET, BY TYPE, 2022-2032 ($MILLION)
TABLE 50. AUSTRALIA RECYCLED PLASTIC MARKET, BY END-USE INDUSTRY, 2022-2032 ($MILLION)
TABLE 51. REST OF ASIA-PACIFIC RECYCLED PLASTIC MARKET, BY TYPE, 2022-2032 ($MILLION)
TABLE 52. REST OF ASIA-PACIFIC RECYCLED PLASTIC MARKET, BY END-USE INDUSTRY, 2022-2032 ($MILLION)
TABLE 53. LAMEA RECYCLED PLASTIC MARKET, BY TYPE, 2022-2032 ($MILLION)
TABLE 54. LAMEA RECYCLED PLASTIC MARKET, BY END-USE INDUSTRY, 2022-2032 ($MILLION)
TABLE 55. LAMEA RECYCLED PLASTIC MARKET, BY COUNTRY, 2022-2032 ($MILLION)
TABLE 56. BRAZIL RECYCLED PLASTIC MARKET, BY TYPE, 2022-2032 ($MILLION)
TABLE 57. BRAZIL RECYCLED PLASTIC MARKET, BY END-USE INDUSTRY, 2022-2032 ($MILLION)
TABLE 58. ARGENTINA RECYCLED PLASTIC MARKET, BY TYPE, 2022-2032 ($MILLION)
TABLE 59. ARGENTINA RECYCLED PLASTIC MARKET, BY END-USE INDUSTRY, 2022-2032 ($MILLION)
TABLE 60. UNITED ARAB EMIRATES RECYCLED PLASTIC MARKET, BY TYPE, 2022-2032 ($MILLION)
TABLE 61. UNITED ARAB EMIRATES RECYCLED PLASTIC MARKET, BY END-USE INDUSTRY, 2022-2032 ($MILLION)
TABLE 62. SOUTH AFRICA RECYCLED PLASTIC MARKET, BY TYPE, 2022-2032 ($MILLION)
TABLE 63. SOUTH AFRICA RECYCLED PLASTIC MARKET, BY END-USE INDUSTRY, 2022-2032 ($MILLION)
TABLE 64. REST OF LAMEA RECYCLED PLASTIC MARKET, BY TYPE, 2022-2032 ($MILLION)
TABLE 65. REST OF LAMEA RECYCLED PLASTIC MARKET, BY END-USE INDUSTRY, 2022-2032 ($MILLION)
TABLE 66. KW PLASTICS: KEY EXECUTIVES
TABLE 67. KW PLASTICS: COMPANY SNAPSHOT
TABLE 68. VEOLIA: KEY EXECUTIVES
TABLE 69. VEOLIA: COMPANY SNAPSHOT
TABLE 70. GREEN LINE POLYMERS: KEY EXECUTIVES
TABLE 71. GREEN LINE POLYMERS: COMPANY SNAPSHOT
TABLE 72. CLEAR PATH RECYCLING: KEY EXECUTIVES
TABLE 73. CLEAR PATH RECYCLING: COMPANY SNAPSHOT
TABLE 74. CUSTOM POLYMERS: KEY EXECUTIVES
TABLE 75. CUSTOM POLYMERS: COMPANY SNAPSHOT
TABLE 76. JAYPLAS: KEY EXECUTIVES
TABLE 77. JAYPLAS: COMPANY SNAPSHOT
TABLE 78. ULTRA POLY CORPORATION: KEY EXECUTIVES
TABLE 79. ULTRA POLY CORPORATION: COMPANY SNAPSHOT
TABLE 80. PLASTIPAK HOLDINGS: KEY EXECUTIVES
TABLE 81. PLASTIPAK HOLDINGS: COMPANY SNAPSHOT
TABLE 82. B. SCHOENBERG & CO.: KEY EXECUTIVES
TABLE 83. B. SCHOENBERG & CO.: COMPANY SNAPSHOT
TABLE 84. JOES PLASTICS INC.: KEY EXECUTIVES
TABLE 85. JOES PLASTICS INC.: COMPANY SNAPSHOT LIST OF FIGURES
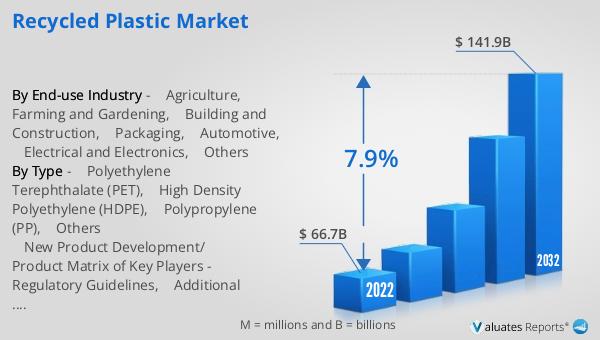
FIGURE 01. RECYCLED PLASTIC MARKET, 2022-2032
FIGURE 02. SEGMENTATION OF RECYCLED PLASTIC MARKET,2022-2032
FIGURE 03. TOP INVESTMENT POCKETS IN RECYCLED PLASTIC MARKET (2023-2032)
FIGURE 04. BARGAINING POWER OF SUPPLIERS
FIGURE 05. BARGAINING POWER OF BUYERS
FIGURE 06. THREAT OF SUBSTITUTION
FIGURE 07. THREAT OF SUBSTITUTION
FIGURE 08. COMPETITIVE RIVALRY
FIGURE 09. GLOBAL RECYCLED PLASTIC MARKET:DRIVERS, RESTRAINTS AND OPPORTUNITIES
FIGURE 10. REGULATORY GUIDELINES: RECYCLED PLASTIC MARKET
FIGURE 11. IMPACT OF KEY REGULATION: RECYCLED PLASTIC MARKET
FIGURE 12. PATENT ANALYSIS BY COMPANY
FIGURE 13. PATENT ANALYSIS BY COUNTRY
FIGURE 14. RECYCLED PLASTIC MARKET, BY TYPE, 2022 AND 2032(%)
FIGURE 15. COMPARATIVE SHARE ANALYSIS OF RECYCLED PLASTIC MARKET FOR POLYETHYLENE TEREPHTHALATE (PET) , BY COUNTRY 2022 AND 2032(%)
FIGURE 16. COMPARATIVE SHARE ANALYSIS OF RECYCLED PLASTIC MARKET FOR HIGH DENSITY POLYETHYLENE (HDPE), BY COUNTRY 2022 AND 2032(%)
FIGURE 17. COMPARATIVE SHARE ANALYSIS OF RECYCLED PLASTIC MARKET FOR POLYPROPYLENE (PP), BY COUNTRY 2022 AND 2032(%)
FIGURE 18. COMPARATIVE SHARE ANALYSIS OF RECYCLED PLASTIC MARKET FOR OTHERS, BY COUNTRY 2022 AND 2032(%)
FIGURE 19. RECYCLED PLASTIC MARKET, BY END-USE INDUSTRY, 2022 AND 2032(%)
FIGURE 20. COMPARATIVE SHARE ANALYSIS OF RECYCLED PLASTIC MARKET FOR AGRICULTURE, FARMING AND GARDENING, BY COUNTRY 2022 AND 2032(%)
FIGURE 21. COMPARATIVE SHARE ANALYSIS OF RECYCLED PLASTIC MARKET FOR BUILDING AND CONSTRUCTION, BY COUNTRY 2022 AND 2032(%)
FIGURE 22. COMPARATIVE SHARE ANALYSIS OF RECYCLED PLASTIC MARKET FOR PACKAGING, BY COUNTRY 2022 AND 2032(%)
FIGURE 23. COMPARATIVE SHARE ANALYSIS OF RECYCLED PLASTIC MARKET FOR AUTOMOTIVE, BY COUNTRY 2022 AND 2032(%)
FIGURE 24. COMPARATIVE SHARE ANALYSIS OF RECYCLED PLASTIC MARKET FOR ELECTRICAL AND ELECTRONICS, BY COUNTRY 2022 AND 2032(%)
FIGURE 25. COMPARATIVE SHARE ANALYSIS OF RECYCLED PLASTIC MARKET FOR OTHERS, BY COUNTRY 2022 AND 2032(%)
FIGURE 26. RECYCLED PLASTIC MARKET BY REGION, 2022 AND 2032(%)
FIGURE 27. U.S. RECYCLED PLASTIC MARKET, 2022-2032 ($MILLION)
FIGURE 28. CANADA RECYCLED PLASTIC MARKET, 2022-2032 ($MILLION)
FIGURE 29. MEXICO RECYCLED PLASTIC MARKET, 2022-2032 ($MILLION)
FIGURE 30. NETHERLANDS RECYCLED PLASTIC MARKET, 2022-2032 ($MILLION)
FIGURE 31. NORWAY RECYCLED PLASTIC MARKET, 2022-2032 ($MILLION)
FIGURE 32. SPAIN RECYCLED PLASTIC MARKET, 2022-2032 ($MILLION)
FIGURE 33. GERMANY RECYCLED PLASTIC MARKET, 2022-2032 ($MILLION)
FIGURE 34. DENMARK RECYCLED PLASTIC MARKET, 2022-2032 ($MILLION)
FIGURE 35. REST OF EUROPE RECYCLED PLASTIC MARKET, 2022-2032 ($MILLION)
FIGURE 36. CHINA RECYCLED PLASTIC MARKET, 2022-2032 ($MILLION)
FIGURE 37. JAPAN RECYCLED PLASTIC MARKET, 2022-2032 ($MILLION)
FIGURE 38. INDIA RECYCLED PLASTIC MARKET, 2022-2032 ($MILLION)
FIGURE 39. SOUTH KOREA RECYCLED PLASTIC MARKET, 2022-2032 ($MILLION)
FIGURE 40. AUSTRALIA RECYCLED PLASTIC MARKET, 2022-2032 ($MILLION)
FIGURE 41. REST OF ASIA-PACIFIC RECYCLED PLASTIC MARKET, 2022-2032 ($MILLION)
FIGURE 42. BRAZIL RECYCLED PLASTIC MARKET, 2022-2032 ($MILLION)
FIGURE 43. ARGENTINA RECYCLED PLASTIC MARKET, 2022-2032 ($MILLION)
FIGURE 44. UNITED ARAB EMIRATES RECYCLED PLASTIC MARKET, 2022-2032 ($MILLION)
FIGURE 45. SOUTH AFRICA RECYCLED PLASTIC MARKET, 2022-2032 ($MILLION)
FIGURE 46. REST OF LAMEA RECYCLED PLASTIC MARKET, 2022-2032 ($MILLION)
FIGURE 47. TOP WINNING STRATEGIES, BY YEAR
FIGURE 48. TOP WINNING STRATEGIES, BY DEVELOPMENT
FIGURE 49. TOP WINNING STRATEGIES, BY COMPANY
FIGURE 50. PRODUCT MAPPING OF TOP 10 PLAYERS
FIGURE 51. COMPETITIVE DASHBOARD
FIGURE 52. COMPETITIVE HEATMAP: RECYCLED PLASTIC MARKET
FIGURE 53. TOP PLAYER POSITIONING, 202
SELECT A FORMAT
Added to Cart
Electronic (PDF)

$5730

This license allows only one user to access the PDF.
Electronic (PDF)

$6450

This license allows 1 - 5 user to access the PDF, license is suitable for small groups of 5 users working together
Electronic (PDF)

$9600

This license allows users/teams in a same Enterprise to use this report, various departments within an enterpise can use this report
Electronic (PDF)

$3840

This license just provides quantitative data in a excel sheet
Add to Cart
Buy Now (15% Discount)

OUR CUSTOMER

Accenture

SIMILAR REPORTS


RELATED REPORTS

Global Engineering Thermoplastics PA6 and PA66 Market Research Report 2025

120 Pages
Type: Report
Code: QYRE-Auto-32C13797
Fri Mar 21 00:00:00 UTC 2025

Add to Cart

Global Halogen-Free Flame Retardant Plastic Market Research Report 2025

120 Pages
Type: Report
Code: QYRE-Auto-8T13387
Fri Mar 21 00:00:00 UTC 2025

Add to Cart

Global Isobutyl Rubber Market Research Report 2025

120 Pages
Type: Report
Code: QYRE-Auto-32F13114
Fri Mar 21 00:00:00 UTC 2025

Add to Cart

Global Polybutene Sales Market Report, Competitive Analysis and Regional Opportunities 2025-2031

120 Pages
Type: Report
Code: QYRE-Auto-36K9161
Fri Mar 21 00:00:00 UTC 2025

Add to Cart