0
U.S. (TOLL FREE)
+1 (315) 215-3225
Automative

0
U.S. (TOLL FREE)
+1 (315) 215-3225
Anti-Caking Agents Market By Source (Natural, Synthetic), By Type (Calcium Compounds, Sodium Compounds, Others), By Application (Dairy, Bakery, Seasonings and Condiments, Others): Global Opportunity Analysis and Industry Forecast, 2021-2031
Published Date: October 2022
|
Report Code: ALLI-Auto-4O875
Home | Market Reports | Business & Industrial| Chemicals Industry
Anti Caking Agents Market By Source Natural Synthetic By Type Calcium Compounds Sodium Compounds Others By Application Dairy Bakery Seasonings and Condiments Others Global Opportunity Analysis and Industry Forecast 2021 2031
BUY CHAPTERS

Anti-Caking Agents Market By Source (Natural, Synthetic), By Type (Calcium Compounds, Sodium Compounds, Others), By Application (Dairy, Bakery, Seasonings and Condiments, Others): Global Opportunity Analysis and Industry Forecast, 2021-2031

Code: ALLI-Auto-4O875
Report
October 2022
Pages:250
Allied Market Research
Buy Now with 15% Discount
DESCRIPTION
TABLE OF CONTENT
TABLES & FIGURES

Anti-Caking Agents Market Size

According to a new report published by , titled, “Global Anti-Caking Agents Market," The global Anti-Caking Agents Market Size was valued at $1.1 billion in 2021, and is estimated to reach $2.1 billion by 2031, growing at a CAGR of 6.4% from 2022 to 2031.

Anti-Caking Agents Market

Anti-Caking Agents Market

Anti-caking agents are substances that are added in small quantities to meals, cosmetics, and other items to stop them from clumping and adhering. Anti-caking compounds are used to stop lumps from forming, usually in finely powdered materials. Alcohol, water, and other organic solvents can all be used to dissolve anti-caking compounds. They either absorb extra moisture or cover the powdered particles with something that repels water. Anti-caking agents' great flexibility is expected to boost Anti-Caking Agents Market Demand during the forecast period further. Demand for anti-caking compounds is also anticipated to increase as a result of factors like ease of packing, transportation, and consumption. Rising demand from a number of industries, including the food, feed, and fertilizer sectors, is likely to drive growth in the market for anti-caking agents globally. The key factors driving the global market for anti-caking agents are rising packaged food demand and increase disposable income.
Anti-caking chemicals are used in food and beverages due to rising customer demand for takeout, fast food, and processed foods. Powered cellulose tricalcium phosphate, sodium bicarbonate, polydimethylsiloxane, magnesium trisilicate, potassium aluminum silicate, and polydimethylsiloxane are a few of the commercial anti-caking substances on the market.
The global Anti-Caking Agents Market is segmented into source, type application, and region. By source, the Anti-Caking Agents Market is segmented into natural and synthetic. Among these, the synthetic segment occupied the major share of the market in 2021 and is projected to maintain its dominance during the forecast period. The growth of the natural segment is attributed to the surge in demand for skiing and a growing number of food industries. However, the natural segment is anticipated to grow at the highest CAGR in the future.
By type, it is classified into calcium compounds and sodium compounds, and others. The sodium compounds segment is anticipated to grow at the highest rate during the forecast period, owing to the growing desire of the youth population for health benefits.
As per application, it is categorized into dairy, bakery, seasoning and condiments, and others. The bakery segment is anticipated to grow at the highest CAGR during the forecast period, due to the consumption of bakery products such as cookies, muffins, pastries and others. The sale of anti-caking agent bakeries is one of the industry’s fastest-growing sales channels. Because they are easily available. For the purpose of attracting more customers, this platform provides a variety of discounts on bakery product purchases.
In 2021, Europe accounted for 34.5% of the global Anti-Caking Agents Market Share and is expected to maintain its dominance during the forecast period. High demand for bakery food products has led to the use of food additives such as anti-caking agents in the region. Spain, Germany, and France are expected to be the largest markets due to their higher feed production than other European countries. Driven by growing demand for higher-quality meat products, the feed additive market in the region, especially anti-caking agents, is growing rapidly.
Under the influence of COVID-19, the food Anti-Caking Agents Market Trends is estimated to grow fairly steadily. The market is expected to have a smooth regulatory environment. End users are expected to accept food release agents to a moderate degree. There are slight restrictions on trade/exports after COVID-19, which may slightly impede the Anti-Caking Agents Market growth. However, the regulatory framework supporting the food anti-caking agent market, wide-ranging consumer acceptance, favorable trade policies, new entrants, high investment, low competition with alternative products, and the cost of ingredients are the food solidification. Anti-caking agents are expected to boost demand for baking agents in the future.
The major players analyzed for the global Anti-Caking Agents industry are Evonik Industries AG (US), PPG Industries Inc. (US), Brenntag AG (Germany), Univar Solutions Inc. (US), Solvay SA (Belgium), Cabot Corporation (US), Agropur Ingredients (US), Huber Engineered Material, Kao Corp., IMAC Inc.
KEY FINDINGS OF THE STUDY
By source, natural segment was the highest revenue contributor to the market in 2021, and is estimated to reach $1,041.8 million by 2031, with a CAGR of 6.0%.
On the basis of type, calcium compounds segment was the highest revenue contributor to the market in 2021, with a CAGR of 6.1%.
On the basis of application, dairy segment dominated the global market in 2021, and is likely to remain dominant during the forecast period.
Region-wise, Europe was the highest revenue contributor, accounting for $392.4 million in 2021, with a CAGR of 7.1%

Overview

The global global anti-caking agents market was valued at $1.1 billion in 2021, and is projected to reach $2.1 billion by 2031, growing at a CAGR of 6.4% from 2022 to 2031. Anhydrous substances known as anti-caking agents are sparingly added to dry foods to avoid particle clumping and promote free-flowing drying. Anti-caking chemicals function by soaking up extra moisture and coating particles to make them more water-repellent. It will be more challenging to use the premix for manufacturing without the anti-caking ingredient since dry soup, cake, and cookie mix would clump and the cappuccino and hot chocolate machines will not function effectively. Milk and cream powders, flour combinations, baking powders, table salts, cocoa, and blended coffee beverages are just a few examples of products that frequently contain anti-caking agents. Anti-caking agents can be used during manufacture to lower production rates while preventing bridging during packaging. When particles interact or unite to form a bridge or arch across the outlet of a container, such as a silo, hopper, or mixing tank, this is known as powder bridging.
It is beneficial for the production of food anti-caking agents to consume more food ingredients such as milk, cake mix, instant soup powder, baking powder, and cream powder. The market for anti-caking agents is anticipated to be driven by rising consumer demand for high-quality foods with extended shelf lives. Additionally, consumers are demanding more convenience meals, higher-quality foods with longer shelf lives, and anti-solidification food additives are being used in a wider range of food applications.
The global anti-caking agent market is segmented into the source, type, application, and region. By source, the market is divided into natural and synthetic. By type, it is classified into calcium compounds, sodium compounds and others. By application, the market is divided into dairy, bakery, seasoning and condiments, and others. Region-wise, the market is analyzed across North America (the U.S., Canada, and Mexico), Europe (UK, Germany, France, Russia, Italy and the rest of Europe), Asia-Pacific (China, Japan, India, South Korea, Australia and rest of Asia-Pacific), and LAMEA (Brazil, South Africa, United Arab Emirates, and the rest of LAMEA).
The market for an anti-caking agent is negatively impacted by COVID-19, particularly during its peak transmission period in 2020. Even if the COVID-19 pandemic continues to have an impact on business globally, despite challenging economic conditions, the market for anti-caking agents has been able to resume pre-COVID-19 levels of growth. The worldwide anti-caking agent market is anticipated to sustain a substantial growth rate over the forecast period due to the resumption of sporting events and other national and international competitions.
The major players operating in the global winter sports equipment market are Evonik Industries AG (US), PPG Industries Inc. (US), Brenntag AG (Germany), Univar Solutions Inc. (US), Solvay SA (Belgium), Cabot Corporation (US), Agropur Ingredients (US), Huber Engineered Material, Kao Corp., IMAC Inc.

Key Benefits For Stakeholders

●This report provides a quantitative analysis of the market segments, current trends, estimations, and dynamics of the global anti-caking agents market analysis from 2021 to 2031 to identify the prevailing global anti-caking agents market opportunities.
●The market research is offered along with information related to key drivers, restraints, and opportunities.
●Porter's five forces analysis highlights the potency of buyers and suppliers to enable stakeholders make profit-oriented business decisions and strengthen their supplier-buyer network.
●In-depth analysis of the global anti-caking agents market segmentation assists to determine the prevailing market opportunities.
●Major countries in each region are mapped according to their revenue contribution to the global market.
●Market player positioning facilitates benchmarking and provides a clear understanding of the present position of the market players.
●The report includes the analysis of the regional as well as global global anti-caking agents market trends, key players, market segments, application areas, and market growth strategies.
Key Market Segments
○ Kao Corp

Scope of Anti-Caking Agents Market Report

Report Metric Details
Report Name Anti-Caking Agents Market
Accounted market size in 2021 $ 1.1 billion
Forecasted market size in 2031 $ 2.1 billion
CAGR 6.4%
Base Year 2021
Forecasted years 2024 - 2031
By Source ● Natural
● Synthetic
By Type ● Calcium Compounds
● Sodium Compounds
● Others
By Application ● Seasonings and Condiments
● Others
● Dairy
● Bakery
By Region
  • North America (United States, Canada)
  • Europe (Germany, France, UK, Italy, Russia) Rest of Europe
  • Nordic Countries
  • Asia-Pacific (China, Japan, South Korea)
  • Southeast Asia (India, Australia)
  • Rest of Asia
  • Latin America (Mexico, Brazil)
  • Rest of Latin America
  • Middle East & Africa (Turkey, Saudi Arabia, UAE, Rest of MEA)
Forecast units USD million in value
Report coverage Revenue and volume forecast, company share, competitive landscape, growth factors and trends

FAQ for this report

How fast is Anti-Caking Agents Market growing?

Ans: The Anti-Caking Agents Market witnessing a CAGR of 6.4% during the forecast period 2024-2031.

What is the Anti-Caking Agents Market size in 2031?

Ans: The Anti-Caking Agents Market size in 2031 will be $ 2.1 billion.

What are the Application segmentation covered in the Anti-Caking Agents Market report?

Ans: The Applications covered in the Anti-Caking Agents Market report are ● Seasonings and Condiments, ● Others, ● Dairy, ● Bakery

What are the Type segmentation covered in the Anti-Caking Agents Market report?

Ans: The Types covered in the Anti-Caking Agents Market report are ● Calcium Compounds, ● Sodium Compounds, ● Others

CHAPTER 1:INTRODUCTION
1.1.Report description
1.2.Key market segments
1.3.Key benefits to the stakeholders
1.4.Research Methodology
1.4.1.Secondary research
1.4.2.Primary research
1.4.3.Analyst tools and models
CHAPTER 2:EXECUTIVE SUMMARY
2.1.Key findings of the study
2.2.CXO Perspective
CHAPTER 3:MARKET OVERVIEW
3.1.Market definition and scope
3.2.Key findings
3.2.1.Top investment pockets
3.3.Porter’s five forces analysis
3.4.Market dynamics
3.4.1.Drivers
3.4.2.Restraints
3.4.3.Opportunities
3.5.COVID-19 Impact Analysis on the market
CHAPTER 4: ANTI-CAKING AGENTS MARKET, BY SOURCE
4.1 Overview
4.1.1 Market size and forecast
4.2 Natural
4.2.1 Key market trends, growth factors and opportunities
4.2.2 Market size and forecast, by region
4.2.3 Market share analysis by country
4.3 Synthetic
4.3.1 Key market trends, growth factors and opportunities
4.3.2 Market size and forecast, by region
4.3.3 Market share analysis by country
CHAPTER 5: ANTI-CAKING AGENTS MARKET, BY TYPE
5.1 Overview
5.1.1 Market size and forecast
5.2 Calcium Compounds
5.2.1 Key market trends, growth factors and opportunities
5.2.2 Market size and forecast, by region
5.2.3 Market share analysis by country
5.3 Sodium Compounds
5.3.1 Key market trends, growth factors and opportunities
5.3.2 Market size and forecast, by region
5.3.3 Market share analysis by country
5.4 Others
5.4.1 Key market trends, growth factors and opportunities
5.4.2 Market size and forecast, by region
5.4.3 Market share analysis by country
CHAPTER 6: ANTI-CAKING AGENTS MARKET, BY APPLICATION
6.1 Overview
6.1.1 Market size and forecast
6.2 Dairy
6.2.1 Key market trends, growth factors and opportunities
6.2.2 Market size and forecast, by region
6.2.3 Market share analysis by country
6.3 Bakery
6.3.1 Key market trends, growth factors and opportunities
6.3.2 Market size and forecast, by region
6.3.3 Market share analysis by country
6.4 Seasonings and Condiments
6.4.1 Key market trends, growth factors and opportunities
6.4.2 Market size and forecast, by region
6.4.3 Market share analysis by country
6.5 Others
6.5.1 Key market trends, growth factors and opportunities
6.5.2 Market size and forecast, by region
6.5.3 Market share analysis by country
CHAPTER 7: ANTI-CAKING AGENTS MARKET, BY REGION
7.1 Overview
7.1.1 Market size and forecast
7.2 North America
7.2.1 Key trends and opportunities
7.2.2 North America Market size and forecast, by Source
7.2.3 North America Market size and forecast, by Type
7.2.4 North America Market size and forecast, by Application
7.2.5 North America Market size and forecast, by country
7.2.5.1 U.S.
7.2.5.1.1 Key market trends, growth factors and opportunities
7.2.5.1.2 Market size and forecast, by Source
7.2.5.1.3 Market size and forecast, by Type
7.2.5.1.4 Market size and forecast, by Application
7.2.5.2 Canada
7.2.5.2.1 Key market trends, growth factors and opportunities
7.2.5.2.2 Market size and forecast, by Source
7.2.5.2.3 Market size and forecast, by Type
7.2.5.2.4 Market size and forecast, by Application
7.2.5.3 Mexico
7.2.5.3.1 Key market trends, growth factors and opportunities
7.2.5.3.2 Market size and forecast, by Source
7.2.5.3.3 Market size and forecast, by Type
7.2.5.3.4 Market size and forecast, by Application
7.3 Europe
7.3.1 Key trends and opportunities
7.3.2 Europe Market size and forecast, by Source
7.3.3 Europe Market size and forecast, by Type
7.3.4 Europe Market size and forecast, by Application
7.3.5 Europe Market size and forecast, by country
7.3.5.1 UK
7.3.5.1.1 Key market trends, growth factors and opportunities
7.3.5.1.2 Market size and forecast, by Source
7.3.5.1.3 Market size and forecast, by Type
7.3.5.1.4 Market size and forecast, by Application
7.3.5.2 Germany
7.3.5.2.1 Key market trends, growth factors and opportunities
7.3.5.2.2 Market size and forecast, by Source
7.3.5.2.3 Market size and forecast, by Type
7.3.5.2.4 Market size and forecast, by Application
7.3.5.3 France
7.3.5.3.1 Key market trends, growth factors and opportunities
7.3.5.3.2 Market size and forecast, by Source
7.3.5.3.3 Market size and forecast, by Type
7.3.5.3.4 Market size and forecast, by Application
7.3.5.4 Russia
7.3.5.4.1 Key market trends, growth factors and opportunities
7.3.5.4.2 Market size and forecast, by Source
7.3.5.4.3 Market size and forecast, by Type
7.3.5.4.4 Market size and forecast, by Application
7.3.5.5 Italy
7.3.5.5.1 Key market trends, growth factors and opportunities
7.3.5.5.2 Market size and forecast, by Source
7.3.5.5.3 Market size and forecast, by Type
7.3.5.5.4 Market size and forecast, by Application
7.3.5.6 Rest of Europe
7.3.5.6.1 Key market trends, growth factors and opportunities
7.3.5.6.2 Market size and forecast, by Source
7.3.5.6.3 Market size and forecast, by Type
7.3.5.6.4 Market size and forecast, by Application
7.4 Asia-Pacific
7.4.1 Key trends and opportunities
7.4.2 Asia-Pacific Market size and forecast, by Source
7.4.3 Asia-Pacific Market size and forecast, by Type
7.4.4 Asia-Pacific Market size and forecast, by Application
7.4.5 Asia-Pacific Market size and forecast, by country
7.4.5.1 China
7.4.5.1.1 Key market trends, growth factors and opportunities
7.4.5.1.2 Market size and forecast, by Source
7.4.5.1.3 Market size and forecast, by Type
7.4.5.1.4 Market size and forecast, by Application
7.4.5.2 Japan
7.4.5.2.1 Key market trends, growth factors and opportunities
7.4.5.2.2 Market size and forecast, by Source
7.4.5.2.3 Market size and forecast, by Type
7.4.5.2.4 Market size and forecast, by Application
7.4.5.3 India
7.4.5.3.1 Key market trends, growth factors and opportunities
7.4.5.3.2 Market size and forecast, by Source
7.4.5.3.3 Market size and forecast, by Type
7.4.5.3.4 Market size and forecast, by Application
7.4.5.4 South Korea
7.4.5.4.1 Key market trends, growth factors and opportunities
7.4.5.4.2 Market size and forecast, by Source
7.4.5.4.3 Market size and forecast, by Type
7.4.5.4.4 Market size and forecast, by Application
7.4.5.5 Australia
7.4.5.5.1 Key market trends, growth factors and opportunities
7.4.5.5.2 Market size and forecast, by Source
7.4.5.5.3 Market size and forecast, by Type
7.4.5.5.4 Market size and forecast, by Application
7.4.5.6 Rest of Asia-Pacific
7.4.5.6.1 Key market trends, growth factors and opportunities
7.4.5.6.2 Market size and forecast, by Source
7.4.5.6.3 Market size and forecast, by Type
7.4.5.6.4 Market size and forecast, by Application
7.5 LAMEA
7.5.1 Key trends and opportunities
7.5.2 LAMEA Market size and forecast, by Source
7.5.3 LAMEA Market size and forecast, by Type
7.5.4 LAMEA Market size and forecast, by Application
7.5.5 LAMEA Market size and forecast, by country
7.5.5.1 Brazil
7.5.5.1.1 Key market trends, growth factors and opportunities
7.5.5.1.2 Market size and forecast, by Source
7.5.5.1.3 Market size and forecast, by Type
7.5.5.1.4 Market size and forecast, by Application
7.5.5.2 South Africa
7.5.5.2.1 Key market trends, growth factors and opportunities
7.5.5.2.2 Market size and forecast, by Source
7.5.5.2.3 Market size and forecast, by Type
7.5.5.2.4 Market size and forecast, by Application
7.5.5.3 United Arab Emirates
7.5.5.3.1 Key market trends, growth factors and opportunities
7.5.5.3.2 Market size and forecast, by Source
7.5.5.3.3 Market size and forecast, by Type
7.5.5.3.4 Market size and forecast, by Application
7.5.5.4 Rest of LAMEA
7.5.5.4.1 Key market trends, growth factors and opportunities
7.5.5.4.2 Market size and forecast, by Source
7.5.5.4.3 Market size and forecast, by Type
7.5.5.4.4 Market size and forecast, by Application
CHAPTER 8: COMPANY LANDSCAPE
8.1. Introduction
8.2. Top winning strategies
8.3. Product Mapping of Top 10 Player
8.4. Top player positioning, 2021
8.5. Competitive Dashboard
8.6. Competitive Heatmap
8.7. Key developments
CHAPTER 9: COMPANY PROFILES
9.1 Evonik Industries AG
9.1.1 Company overview
9.1.2 Key Executives
9.1.3 Company snapshot
9.1.4 Operating business segments
9.1.5 Product portfolio
9.1.6 Business performance
9.1.7 Key strategic moves and developments
9.2 PPG Industries Inc.
9.2.1 Company overview
9.2.2 Key Executives
9.2.3 Company snapshot
9.2.4 Operating business segments
9.2.5 Product portfolio
9.2.6 Business performance
9.2.7 Key strategic moves and developments
9.3 Brenntag AG
9.3.1 Company overview
9.3.2 Key Executives
9.3.3 Company snapshot
9.3.4 Operating business segments
9.3.5 Product portfolio
9.3.6 Business performance
9.3.7 Key strategic moves and developments
9.4 Univar Solutions Inc.
9.4.1 Company overview
9.4.2 Key Executives
9.4.3 Company snapshot
9.4.4 Operating business segments
9.4.5 Product portfolio
9.4.6 Business performance
9.4.7 Key strategic moves and developments
9.5 Solvay SA
9.5.1 Company overview
9.5.2 Key Executives
9.5.3 Company snapshot
9.5.4 Operating business segments
9.5.5 Product portfolio
9.5.6 Business performance
9.5.7 Key strategic moves and developments
9.6 Cabot Corporation
9.6.1 Company overview
9.6.2 Key Executives
9.6.3 Company snapshot
9.6.4 Operating business segments
9.6.5 Product portfolio
9.6.6 Business performance
9.6.7 Key strategic moves and developments
9.7 Agropur Ingredients
9.7.1 Company overview
9.7.2 Key Executives
9.7.3 Company snapshot
9.7.4 Operating business segments
9.7.5 Product portfolio
9.7.6 Business performance
9.7.7 Key strategic moves and developments
9.8 Huber Engineered Material
9.8.1 Company overview
9.8.2 Key Executives
9.8.3 Company snapshot
9.8.4 Operating business segments
9.8.5 Product portfolio
9.8.6 Business performance
9.8.7 Key strategic moves and developments
9.9 IMAC Inc
9.9.1 Company overview
9.9.2 Key Executives
9.9.3 Company snapshot
9.9.4 Operating business segments
9.9.5 Product portfolio
9.9.6 Business performance
9.9.7 Key strategic moves and developments
9.10 Kao Corp.
9.10.1 Company overview
9.10.2 Key Executives
9.10.3 Company snapshot
9.10.4 Operating business segments
9.10.5 Product portfolio
9.10.6 Business performance
9.10.7 Key strategic moves and development
LIST OF TABLES
TABLE 1. GLOBAL ANTI-CAKING AGENTS MARKET, BY SOURCE, 2021-2031 (REVENUE, $MILLION)
TABLE 2. ANTI-CAKING AGENTS MARKET FOR NATURAL, BY REGION, 2021-2031 (REVENUE, $MILLION)
TABLE 3. ANTI-CAKING AGENTS MARKET FOR SYNTHETIC, BY REGION, 2021-2031 (REVENUE, $MILLION)
TABLE 4. GLOBAL ANTI-CAKING AGENTS MARKET, BY TYPE, 2021-2031 (REVENUE, $MILLION)
TABLE 5. ANTI-CAKING AGENTS MARKET FOR CALCIUM COMPOUNDS, BY REGION, 2021-2031 (REVENUE, $MILLION)
TABLE 6. ANTI-CAKING AGENTS MARKET FOR SODIUM COMPOUNDS, BY REGION, 2021-2031 (REVENUE, $MILLION)
TABLE 7. ANTI-CAKING AGENTS MARKET FOR OTHERS, BY REGION, 2021-2031 (REVENUE, $MILLION)
TABLE 8. GLOBAL ANTI-CAKING AGENTS MARKET, BY APPLICATION, 2021-2031 (REVENUE, $MILLION)
TABLE 9. ANTI-CAKING AGENTS MARKET FOR DAIRY, BY REGION, 2021-2031 (REVENUE, $MILLION)
TABLE 10. ANTI-CAKING AGENTS MARKET FOR BAKERY, BY REGION, 2021-2031 (REVENUE, $MILLION)
TABLE 11. ANTI-CAKING AGENTS MARKET FOR SEASONINGS AND CONDIMENTS, BY REGION, 2021-2031 (REVENUE, $MILLION)
TABLE 12. ANTI-CAKING AGENTS MARKET FOR OTHERS, BY REGION, 2021-2031 (REVENUE, $MILLION)
TABLE 13. ANTI-CAKING AGENTS MARKET, BY REGION, 2021-2031 (REVENUE, $MILLION)
TABLE 14. NORTH AMERICA ANTI-CAKING AGENTS MARKET, BY SOURCE, 2021-2031 (REVENUE, $MILLION)
TABLE 15. NORTH AMERICA ANTI-CAKING AGENTS MARKET, BY TYPE, 2021-2031 (REVENUE, $MILLION)
TABLE 16. NORTH AMERICA ANTI-CAKING AGENTS MARKET, BY APPLICATION, 2021-2031 (REVENUE, $MILLION)
TABLE 17. NORTH AMERICA ANTI-CAKING AGENTS MARKET, BY COUNTRY, 2021-2031 (REVENUE, $MILLION)
TABLE 18. U.S. ANTI-CAKING AGENTS MARKET, BY SOURCE, 2021-2031 (REVENUE, $MILLION)
TABLE 19. U.S. ANTI-CAKING AGENTS MARKET, BY TYPE, 2021-2031 (REVENUE, $MILLION)
TABLE 20. U.S. ANTI-CAKING AGENTS MARKET, BY APPLICATION, 2021-2031 (REVENUE, $MILLION)
TABLE 21. CANADA ANTI-CAKING AGENTS MARKET, BY SOURCE, 2021-2031 (REVENUE, $MILLION)
TABLE 22. CANADA ANTI-CAKING AGENTS MARKET, BY TYPE, 2021-2031 (REVENUE, $MILLION)
TABLE 23. CANADA ANTI-CAKING AGENTS MARKET, BY APPLICATION, 2021-2031 (REVENUE, $MILLION)
TABLE 24. MEXICO ANTI-CAKING AGENTS MARKET, BY SOURCE, 2021-2031 (REVENUE, $MILLION)
TABLE 25. MEXICO ANTI-CAKING AGENTS MARKET, BY TYPE, 2021-2031 (REVENUE, $MILLION)
TABLE 26. MEXICO ANTI-CAKING AGENTS MARKET, BY APPLICATION, 2021-2031 (REVENUE, $MILLION)
TABLE 27. EUROPE ANTI-CAKING AGENTS MARKET, BY SOURCE, 2021-2031 (REVENUE, $MILLION)
TABLE 28. EUROPE ANTI-CAKING AGENTS MARKET, BY TYPE, 2021-2031 (REVENUE, $MILLION)
TABLE 29. EUROPE ANTI-CAKING AGENTS MARKET, BY APPLICATION, 2021-2031 (REVENUE, $MILLION)
TABLE 30. EUROPE ANTI-CAKING AGENTS MARKET, BY COUNTRY, 2021-2031 (REVENUE, $MILLION)
TABLE 31. UK ANTI-CAKING AGENTS MARKET, BY SOURCE, 2021-2031 (REVENUE, $MILLION)
TABLE 32. UK ANTI-CAKING AGENTS MARKET, BY TYPE, 2021-2031 (REVENUE, $MILLION)
TABLE 33. UK ANTI-CAKING AGENTS MARKET, BY APPLICATION, 2021-2031 (REVENUE, $MILLION)
TABLE 34. GERMANY ANTI-CAKING AGENTS MARKET, BY SOURCE, 2021-2031 (REVENUE, $MILLION)
TABLE 35. GERMANY ANTI-CAKING AGENTS MARKET, BY TYPE, 2021-2031 (REVENUE, $MILLION)
TABLE 36. GERMANY ANTI-CAKING AGENTS MARKET, BY APPLICATION, 2021-2031 (REVENUE, $MILLION)
TABLE 37. FRANCE ANTI-CAKING AGENTS MARKET, BY SOURCE, 2021-2031 (REVENUE, $MILLION)
TABLE 38. FRANCE ANTI-CAKING AGENTS MARKET, BY TYPE, 2021-2031 (REVENUE, $MILLION)
TABLE 39. FRANCE ANTI-CAKING AGENTS MARKET, BY APPLICATION, 2021-2031 (REVENUE, $MILLION)
TABLE 40. RUSSIA ANTI-CAKING AGENTS MARKET, BY SOURCE, 2021-2031 (REVENUE, $MILLION)
TABLE 41. RUSSIA ANTI-CAKING AGENTS MARKET, BY TYPE, 2021-2031 (REVENUE, $MILLION)
TABLE 42. RUSSIA ANTI-CAKING AGENTS MARKET, BY APPLICATION, 2021-2031 (REVENUE, $MILLION)
TABLE 43. ITALY ANTI-CAKING AGENTS MARKET, BY SOURCE, 2021-2031 (REVENUE, $MILLION)
TABLE 44. ITALY ANTI-CAKING AGENTS MARKET, BY TYPE, 2021-2031 (REVENUE, $MILLION)
TABLE 45. ITALY ANTI-CAKING AGENTS MARKET, BY APPLICATION, 2021-2031 (REVENUE, $MILLION)
TABLE 46. REST OF EUROPE ANTI-CAKING AGENTS MARKET, BY SOURCE, 2021-2031 (REVENUE, $MILLION)
TABLE 47. REST OF EUROPE ANTI-CAKING AGENTS MARKET, BY TYPE, 2021-2031 (REVENUE, $MILLION)
TABLE 48. REST OF EUROPE ANTI-CAKING AGENTS MARKET, BY APPLICATION, 2021-2031 (REVENUE, $MILLION)
TABLE 49. ASIA-PACIFIC ANTI-CAKING AGENTS MARKET, BY SOURCE, 2021-2031 (REVENUE, $MILLION)
TABLE 50. ASIA-PACIFIC ANTI-CAKING AGENTS MARKET, BY TYPE, 2021-2031 (REVENUE, $MILLION)
TABLE 51. ASIA-PACIFIC ANTI-CAKING AGENTS MARKET, BY APPLICATION, 2021-2031 (REVENUE, $MILLION)
TABLE 52. ASIA-PACIFIC ANTI-CAKING AGENTS MARKET, BY COUNTRY, 2021-2031 (REVENUE, $MILLION)
TABLE 53. CHINA ANTI-CAKING AGENTS MARKET, BY SOURCE, 2021-2031 (REVENUE, $MILLION)
TABLE 54. CHINA ANTI-CAKING AGENTS MARKET, BY TYPE, 2021-2031 (REVENUE, $MILLION)
TABLE 55. CHINA ANTI-CAKING AGENTS MARKET, BY APPLICATION, 2021-2031 (REVENUE, $MILLION)
TABLE 56. JAPAN ANTI-CAKING AGENTS MARKET, BY SOURCE, 2021-2031 (REVENUE, $MILLION)
TABLE 57. JAPAN ANTI-CAKING AGENTS MARKET, BY TYPE, 2021-2031 (REVENUE, $MILLION)
TABLE 58. JAPAN ANTI-CAKING AGENTS MARKET, BY APPLICATION, 2021-2031 (REVENUE, $MILLION)
TABLE 59. INDIA ANTI-CAKING AGENTS MARKET, BY SOURCE, 2021-2031 (REVENUE, $MILLION)
TABLE 60. INDIA ANTI-CAKING AGENTS MARKET, BY TYPE, 2021-2031 (REVENUE, $MILLION)
TABLE 61. INDIA ANTI-CAKING AGENTS MARKET, BY APPLICATION, 2021-2031 (REVENUE, $MILLION)
TABLE 62. SOUTH KOREA ANTI-CAKING AGENTS MARKET, BY SOURCE, 2021-2031 (REVENUE, $MILLION)
TABLE 63. SOUTH KOREA ANTI-CAKING AGENTS MARKET, BY TYPE, 2021-2031 (REVENUE, $MILLION)
TABLE 64. SOUTH KOREA ANTI-CAKING AGENTS MARKET, BY APPLICATION, 2021-2031 (REVENUE, $MILLION)
TABLE 65. AUSTRALIA ANTI-CAKING AGENTS MARKET, BY SOURCE, 2021-2031 (REVENUE, $MILLION)
TABLE 66. AUSTRALIA ANTI-CAKING AGENTS MARKET, BY TYPE, 2021-2031 (REVENUE, $MILLION)
TABLE 67. AUSTRALIA ANTI-CAKING AGENTS MARKET, BY APPLICATION, 2021-2031 (REVENUE, $MILLION)
TABLE 68. REST OF ASIA-PACIFIC ANTI-CAKING AGENTS MARKET, BY SOURCE, 2021-2031 (REVENUE, $MILLION)
TABLE 69. REST OF ASIA-PACIFIC ANTI-CAKING AGENTS MARKET, BY TYPE, 2021-2031 (REVENUE, $MILLION)
TABLE 70. REST OF ASIA-PACIFIC ANTI-CAKING AGENTS MARKET, BY APPLICATION, 2021-2031 (REVENUE, $MILLION)
TABLE 71. LAMEA ANTI-CAKING AGENTS MARKET, BY SOURCE, 2021-2031 (REVENUE, $MILLION)
TABLE 72. LAMEA ANTI-CAKING AGENTS MARKET, BY TYPE, 2021-2031 (REVENUE, $MILLION)
TABLE 73. LAMEA ANTI-CAKING AGENTS MARKET, BY APPLICATION, 2021-2031 (REVENUE, $MILLION)
TABLE 74. LAMEA ANTI-CAKING AGENTS MARKET, BY COUNTRY, 2021-2031 (REVENUE, $MILLION)
TABLE 75. BRAZIL ANTI-CAKING AGENTS MARKET, BY SOURCE, 2021-2031 (REVENUE, $MILLION)
TABLE 76. BRAZIL ANTI-CAKING AGENTS MARKET, BY TYPE, 2021-2031 (REVENUE, $MILLION)
TABLE 77. BRAZIL ANTI-CAKING AGENTS MARKET, BY APPLICATION, 2021-2031 (REVENUE, $MILLION)
TABLE 78. SOUTH AFRICA ANTI-CAKING AGENTS MARKET, BY SOURCE, 2021-2031 (REVENUE, $MILLION)
TABLE 79. SOUTH AFRICA ANTI-CAKING AGENTS MARKET, BY TYPE, 2021-2031 (REVENUE, $MILLION)
TABLE 80. SOUTH AFRICA ANTI-CAKING AGENTS MARKET, BY APPLICATION, 2021-2031 (REVENUE, $MILLION)
TABLE 81. UNITED ARAB EMIRATES ANTI-CAKING AGENTS MARKET, BY SOURCE, 2021-2031 (REVENUE, $MILLION)
TABLE 82. UNITED ARAB EMIRATES ANTI-CAKING AGENTS MARKET, BY TYPE, 2021-2031 (REVENUE, $MILLION)
TABLE 83. UNITED ARAB EMIRATES ANTI-CAKING AGENTS MARKET, BY APPLICATION, 2021-2031 (REVENUE, $MILLION)
TABLE 84. REST OF LAMEA ANTI-CAKING AGENTS MARKET, BY SOURCE, 2021-2031 (REVENUE, $MILLION)
TABLE 85. REST OF LAMEA ANTI-CAKING AGENTS MARKET, BY TYPE, 2021-2031 (REVENUE, $MILLION)
TABLE 86. REST OF LAMEA ANTI-CAKING AGENTS MARKET, BY APPLICATION, 2021-2031 (REVENUE, $MILLION)
TABLE 88.EVONIK INDUSTRIES AG: KEY EXECUTIVES
TABLE 88.EVONIK INDUSTRIES AG: COMPANY SNAPSHOT
TABLE 89.EVONIK INDUSTRIES AG: OPERATING SEGMENTS
TABLE 90.EVONIK INDUSTRIES AG: PRODUCT PORTFOLIO
TABLE 91.EVONIK INDUSTRIES AG: NET SALES
TABLE 92.EVONIK INDUSTRIES AG: KEY STRATERGIES
TABLE 94.PPG INDUSTRIES INC.: KEY EXECUTIVES
TABLE 94.PPG INDUSTRIES INC.: COMPANY SNAPSHOT
TABLE 95.PPG INDUSTRIES INC.: OPERATING SEGMENTS
TABLE 96.PPG INDUSTRIES INC.: PRODUCT PORTFOLIO
TABLE 97.PPG INDUSTRIES INC.: NET SALES
TABLE 98.PPG INDUSTRIES INC.: KEY STRATERGIES
TABLE 100.BRENNTAG AG: KEY EXECUTIVES
TABLE 100.BRENNTAG AG: COMPANY SNAPSHOT
TABLE 101.BRENNTAG AG: OPERATING SEGMENTS
TABLE 102.BRENNTAG AG: PRODUCT PORTFOLIO
TABLE 103.BRENNTAG AG: NET SALES
TABLE 104.BRENNTAG AG: KEY STRATERGIES
TABLE 106.UNIVAR SOLUTIONS INC.: KEY EXECUTIVES
TABLE 106.UNIVAR SOLUTIONS INC.: COMPANY SNAPSHOT
TABLE 107.UNIVAR SOLUTIONS INC.: OPERATING SEGMENTS
TABLE 108.UNIVAR SOLUTIONS INC.: PRODUCT PORTFOLIO
TABLE 109.UNIVAR SOLUTIONS INC.: NET SALES
TABLE 110.UNIVAR SOLUTIONS INC.: KEY STRATERGIES
TABLE 112.SOLVAY SA: KEY EXECUTIVES
TABLE 112.SOLVAY SA: COMPANY SNAPSHOT
TABLE 113.SOLVAY SA: OPERATING SEGMENTS
TABLE 114.SOLVAY SA: PRODUCT PORTFOLIO
TABLE 115.SOLVAY SA: NET SALES
TABLE 116.SOLVAY SA: KEY STRATERGIES
TABLE 118.CABOT CORPORATION: KEY EXECUTIVES
TABLE 118.CABOT CORPORATION: COMPANY SNAPSHOT
TABLE 119.CABOT CORPORATION: OPERATING SEGMENTS
TABLE 120.CABOT CORPORATION: PRODUCT PORTFOLIO
TABLE 121.CABOT CORPORATION: NET SALES
TABLE 122.CABOT CORPORATION: KEY STRATERGIES
TABLE 124.AGROPUR INGREDIENTS: KEY EXECUTIVES
TABLE 124.AGROPUR INGREDIENTS: COMPANY SNAPSHOT
TABLE 125.AGROPUR INGREDIENTS: OPERATING SEGMENTS
TABLE 126.AGROPUR INGREDIENTS: PRODUCT PORTFOLIO
TABLE 127.AGROPUR INGREDIENTS: NET SALES
TABLE 128.AGROPUR INGREDIENTS: KEY STRATERGIES
TABLE 130.HUBER ENGINEERED MATERIAL: KEY EXECUTIVES
TABLE 130.HUBER ENGINEERED MATERIAL: COMPANY SNAPSHOT
TABLE 131.HUBER ENGINEERED MATERIAL: OPERATING SEGMENTS
TABLE 132.HUBER ENGINEERED MATERIAL: PRODUCT PORTFOLIO
TABLE 133.HUBER ENGINEERED MATERIAL: NET SALES
TABLE 134.HUBER ENGINEERED MATERIAL: KEY STRATERGIES
TABLE 136.IMAC INC: KEY EXECUTIVES
TABLE 136.IMAC INC: COMPANY SNAPSHOT
TABLE 137.IMAC INC: OPERATING SEGMENTS
TABLE 138.IMAC INC: PRODUCT PORTFOLIO
TABLE 139.IMAC INC: NET SALES
TABLE 140.IMAC INC: KEY STRATERGIES
TABLE 142.KAO CORP.: KEY EXECUTIVES
TABLE 142.KAO CORP.: COMPANY SNAPSHOT
TABLE 143.KAO CORP.: OPERATING SEGMENTS
TABLE 144.KAO CORP.: PRODUCT PORTFOLIO
TABLE 145.KAO CORP.: NET SALES
TABLE 146.KAO CORP.: KEY STRATERGIES LIST OF FIGURES
FIGURE 1. SEGMENTATION OF ANTI-CAKING AGENTS MARKET,2021-2031
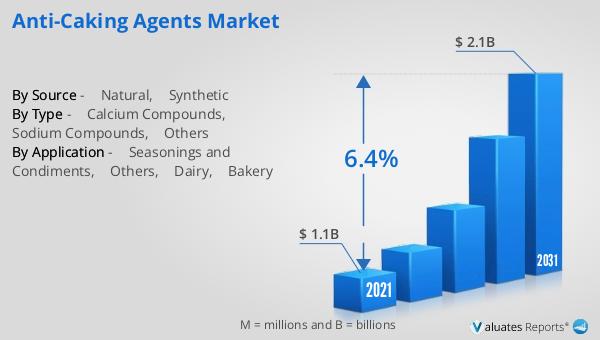
FIGURE 2.ANTI-CAKING AGENTS MARKET,2021-2031
FIGURE 3. TOP INVESTMENT POCKETS, BY REGION
FIGURE 4.PORTER FIVE-1
FIGURE 5.PORTER FIVE-2
FIGURE 6.PORTER FIVE-3
FIGURE 7.PORTER FIVE-4
FIGURE 8.PORTER FIVE-5
FIGURE 9.ANTI-CAKING AGENTS MARKET:DRIVERS, RESTRAINTS AND OPPORTUNITIES
FIGURE 10.ANTI-CAKING AGENTS MARKET,BY SOURCE,2021(%)
FIGURE 11.COMPARATIVE SHARE ANALYSIS OF NATURAL ANTI-CAKING AGENTS MARKET, 2021 AND 2031(%)
FIGURE 12.COMPARATIVE SHARE ANALYSIS OF SYNTHETIC ANTI-CAKING AGENTS MARKET, 2021 AND 2031(%)
FIGURE 13.ANTI-CAKING AGENTS MARKET,BY TYPE,2021(%)
FIGURE 14.COMPARATIVE SHARE ANALYSIS OF CALCIUM COMPOUNDS ANTI-CAKING AGENTS MARKET, 2021 AND 2031(%)
FIGURE 15.COMPARATIVE SHARE ANALYSIS OF SODIUM COMPOUNDS ANTI-CAKING AGENTS MARKET, 2021 AND 2031(%)
FIGURE 16.COMPARATIVE SHARE ANALYSIS OF OTHERS ANTI-CAKING AGENTS MARKET, 2021 AND 2031(%)
FIGURE 17.ANTI-CAKING AGENTS MARKET,BY APPLICATION,2021(%)
FIGURE 18.COMPARATIVE SHARE ANALYSIS OF DAIRY ANTI-CAKING AGENTS MARKET, 2021 AND 2031(%)
FIGURE 19.COMPARATIVE SHARE ANALYSIS OF BAKERY ANTI-CAKING AGENTS MARKET, 2021 AND 2031(%)
FIGURE 20.COMPARATIVE SHARE ANALYSIS OF SEASONINGS AND CONDIMENTS ANTI-CAKING AGENTS MARKET, 2021 AND 2031(%)
FIGURE 21.COMPARATIVE SHARE ANALYSIS OF OTHERS ANTI-CAKING AGENTS MARKET, 2021 AND 2031(%)
FIGURE 22.ANTI-CAKING AGENTS MARKET BY REGION,2021
FIGURE 23.U.S. ANTI-CAKING AGENTS MARKET,2021-2031($MILLION)
FIGURE 24.CANADA ANTI-CAKING AGENTS MARKET,2021-2031($MILLION)
FIGURE 25.MEXICO ANTI-CAKING AGENTS MARKET,2021-2031($MILLION)
FIGURE 26.UK ANTI-CAKING AGENTS MARKET,2021-2031($MILLION)
FIGURE 27.GERMANY ANTI-CAKING AGENTS MARKET,2021-2031($MILLION)
FIGURE 28.FRANCE ANTI-CAKING AGENTS MARKET,2021-2031($MILLION)
FIGURE 29.RUSSIA ANTI-CAKING AGENTS MARKET,2021-2031($MILLION)
FIGURE 30.ITALY ANTI-CAKING AGENTS MARKET,2021-2031($MILLION)
FIGURE 31.REST OF EUROPE ANTI-CAKING AGENTS MARKET,2021-2031($MILLION)
FIGURE 32.CHINA ANTI-CAKING AGENTS MARKET,2021-2031($MILLION)
FIGURE 33.JAPAN ANTI-CAKING AGENTS MARKET,2021-2031($MILLION)
FIGURE 34.INDIA ANTI-CAKING AGENTS MARKET,2021-2031($MILLION)
FIGURE 35.SOUTH KOREA ANTI-CAKING AGENTS MARKET,2021-2031($MILLION)
FIGURE 36.AUSTRALIA ANTI-CAKING AGENTS MARKET,2021-2031($MILLION)
FIGURE 37.REST OF ASIA-PACIFIC ANTI-CAKING AGENTS MARKET,2021-2031($MILLION)
FIGURE 38.BRAZIL ANTI-CAKING AGENTS MARKET,2021-2031($MILLION)
FIGURE 39.SOUTH AFRICA ANTI-CAKING AGENTS MARKET,2021-2031($MILLION)
FIGURE 40.UNITED ARAB EMIRATES ANTI-CAKING AGENTS MARKET,2021-2031($MILLION)
FIGURE 41.REST OF LAMEA ANTI-CAKING AGENTS MARKET,2021-2031($MILLION)
FIGURE 42. TOP WINNING STRATEGIES, BY YEAR
FIGURE 43. TOP WINNING STRATEGIES, BY DEVELOPMENT
FIGURE 44. TOP WINNING STRATEGIES, BY COMPANY
FIGURE 45.PRODUCT MAPPING OF TOP 10 PLAYERS
FIGURE 46.TOP PLAYER POSITIONING, 2021
FIGURE 47.COMPETITIVE DASHBOARD
FIGURE 48.COMPETITIVE HEATMAP OF TOP 10 KEY PLAYERS
FIGURE 49.EVONIK INDUSTRIES AG.: NET SALES ($MILLION)
FIGURE 50.PPG INDUSTRIES INC..: NET SALES ($MILLION)
FIGURE 51.BRENNTAG AG.: NET SALES ($MILLION)
FIGURE 52.UNIVAR SOLUTIONS INC..: NET SALES ($MILLION)
FIGURE 53.SOLVAY SA.: NET SALES ($MILLION)
FIGURE 54.CABOT CORPORATION.: NET SALES ($MILLION)
FIGURE 55.AGROPUR INGREDIENTS.: NET SALES ($MILLION)
FIGURE 56.HUBER ENGINEERED MATERIAL.: NET SALES ($MILLION)
FIGURE 57.IMAC INC.: NET SALES ($MILLION)
FIGURE 58.KAO CORP..: NET SALES ($MILLION
SELECT A FORMAT
Added to Cart
Electronic (PDF)

$5730

This license allows only one user to access the PDF.
Electronic (PDF)

$6450

This license allows 1 - 5 user to access the PDF, license is suitable for small groups of 5 users working together
Electronic (PDF)

$9600

This license allows users/teams in a same Enterprise to use this report, various departments within an enterpise can use this report
Electronic (PDF)

$3840

This license just provides quantitative data in a excel sheet
Add to Cart
Buy Now (15% Discount)

OUR CUSTOMER

Lukasiewicz Research Network

SIMILAR REPORTS