0
U.S. (TOLL FREE)
+1 (315) 215-3225
Automative

0
U.S. (TOLL FREE)
+1 (315) 215-3225
Rare Biomarkers Specimen Collection and Stabilization Market By Type (Circulating Cell Free DNA (ccfDNA), Circulating Tumor Cells (CTCs), Exosomes Vesicles), By Product (Isolation Kits and Reagent, Blood Collection Tubes, Systems), By Application (Oncology, Cardiovascular Diseases, NIPT, Transcriptomics, Pharmacogenomics, Transplant Rejection, Population Screening, Others): Global Opportunity Analysis and Industry Forecast, 2021-2031
Published Date: October 2022
|
Report Code: ALLI-Auto-4S895
Home | Market Reports | Business & Industrial| Pharmaceuticals & Biotech
Rare Biomarkers Specimen Collection and Stabilization Market By Type Circulating Cell Free DNA ccfDNA Circulating Tumor Cells CTCs Exosomes Vesicles By Product Isolation Kits and Reagent Blood Collection Tubes Systems By Application Oncology Cardiovascular Diseases NIPT Transcriptomics Pharmacogenomics Transplant Rejection Population Screening Others Global Opportunity Analysis and Industry Forecast 2021 2031
BUY CHAPTERS

Rare Biomarkers Specimen Collection and Stabilization Market By Type (Circulating Cell Free DNA (ccfDNA), Circulating Tumor Cells (CTCs), Exosomes Vesicles), By Product (Isolation Kits and Reagent, Blood Collection Tubes, Systems), By Application (Oncology, Cardiovascular Diseases, NIPT, Transcriptomics, Pharmacogenomics, Transplant Rejection, Population Screening, Others): Global Opportunity Analysis and Industry Forecast, 2021-2031

Code: ALLI-Auto-4S895
Report
October 2022
Pages:356
Allied Market Research
Buy Now with 15% Discount
DESCRIPTION
TABLE OF CONTENT
TABLES & FIGURES

Rare Biomarkers Specimen Collection and Stabilization Market Size

According to a new report published by , titled, “Rare Biomarkers Specimen Collection and Stabilization Market," The Rare Biomarkers Specimen Collection And Stabilization Market Size was valued at $23.3 billion in 2021, and is estimated to reach $54.2 billion by 2031, growing at a CAGR of 8.7% from 2022 to 2031. 

Rare Biomarkers Specimen Collection and Stabilization Market

Rare Biomarkers Specimen Collection and Stabilization Market

Biomarkers are the measures used to perform a clinical assessment such as blood pressure or cholesterol level and are used to monitor and predict health states in individuals or across populations so that appropriate therapeutic intervention can be planned. Biomarkers may be used alone or in combination to assess the health or disease state of an individual.
A wide range of biomarkers are used. Every biological system (for example, the cardiovascular system, metabolic system, or the immune system) has its own specific biomarkers. Many of these biomarkers are relatively easy to measure and form part of routine medical examinations. For example, a general health check may include assessment of blood pressure, heart rate, cholesterol, and fasting glucose levels. Body measurements such as weight, body mass index (BMI), and waist-to-hip ratio are routinely used for assessing conditions such as obesity and metabolic disorders.
The principles of biomarkers in disease have been applied to the detection, screening, diagnosis, treatment, and monitoring of cancer. Traditionally, anti-cancer drugs were agents that killed both cancer cells and healthy cells. However, more targeted therapies have now been developed that can be directed to kill cancer cells only, while sparing healthy cells..
The key factors that drive the growth of the market are the rise in the prevalence of cancer and chronic diseases. Moreover, an increase in the geriatric population, a surge in the adoption of advanced healthcare services, and a rise in investments in R&D by biopharmaceutical companies  propel the growth of the rare biomarker specimen collection and stabilization market. For instance, Hereditary Angioedema (HAE) is an autosomal dominant genetic disorder that affects 1 in 50,000 people. It is caused in most cases by a pathogenic variant in SERPING1, encoding the C1-inhibitor (C1-INH), leading to deficiency or dysfunction of C1-INH (HAE types 1 and 2 [HAE-1/2], respectively). Thus, in order to guide the therapeutic management in HAE, it can be of great benefit to utilizing biomarkers, i.e., biological indicators of disease state, as it may be possible to personalize the treatment according to the biomarker status. Therefore, the rise in the adoption of biomarkers to treat genetic disorders propels the Rare Biomarkers Specimen Collection And Stabilization Market Growth in the forecast period.  
Furthermore, an increase in the number of studies in the area of rare biomarker specimens and a surge in usage of clinical utilities for drug development purposes are the major factors that drive the growth of the market.
However, the high cost of the biomarker’s development and the lack of skilled personnel are the major barriers for the growth of the market. Emerging economies such as India, China, Mexico, and Brazil are anticipated to create new opportunities during the forecast period due to an increase in applications of rare biomarker specimens in pharmacogenomics and disease diagnosis. 
On the basis of type, the rare biomarkers specimen collection and stabilization market is segmented into circulating cell-free DNA, circulating tumor cells, and exosome vesicles. In 2021, the circulating cell-free DNA segment accounted for the largest Rare Biomarkers Specimen Collection And Stabilization Market Share. The dominance of this segment can be attributed to the increasing adoption of NIPT in detecting chromosomal anomalies in the fetus and as it is a very promising tumor biomarker for cancer diagnosis & monitoring, prognosis assessment, and personalized medication guidance.
On the basis of product, the Rare Biomarkers Specimen Collection And Stabilization Industry is categorized into isolation kits & reagents, blood collection tubes, and systems. The isolation kits & reagents segment exhibited the highest growth in 2021, and is anticipated to lead during the forecast period, owing to rise in prevalence of cancer & rare genetic disorder and the increase in investment for exploring the utility of CTCs in diagnosis, prognosis, and treatment monitoring are the Rare Biomarkers Specimen Collection And Stabilization Market Trends that propel the growth of the market in upcoming years.
By application the market is classified into NIPT, oncology, transcriptomics, pharmacogenomics, transplant rejection, population screening, cardiovascular diseases, and others. The oncology segment exhibited the highest growth in 2021, and is anticipated to lead during the forecast period, owing to surge in prevalence of cancer cases, which has increased the demand for rare biomarkers and advancement in technology coupled with an increased interest in personalized medication.
North America accounted for a majority of the rare biomarker’s specimen collection and stabilization market share in 2021 and is anticipated to remain dominant during the forecast period owing to the high adoption of technologically advanced imaging systems, increase in the healthcare expenditure, and presence of major key players in the region & the strategies they adopt for their product development.
Asia-Pacific was the second largest contributor to the market in 2021, and is expected to register the fastest CAGR during the forecast period. The market growth in the Asia-Pacific is supplemented by the rise in demand for minimal invasive therapies, healthcare reforms, highly populated countries along with high birth rate, and surge in prevalence of chronic diseases. In addition, the increasing patient awareness and presence of high unmet needs in the developing nations, especially in countries such as India and China, are expected to further drive the market growth.
The key players that operate in the rare biomarkers specimen collection and stabilization market are Agilent Technologies, Bio-Rad Laboratories inc., Charles River Laboratories Inc, F. Hoffman La Roche AG, Merck KGaA, Miltenyi Biotec, Perkin Elmer, Qiagen, Thermofisher Scientific Inc, and Siemens AG.
Key findings of the study
By type, the circulating cell free DNA segment was the highest contributor to the market in 2021.
By product, the isolation kits & reagents segment was the highest contributor in 2021.
By application, the oncology dominated the market in 2021 and is expected to continue this trend during the forecast period.
By region, North America garnered the largest revenue share in 2021, whereas Asia-Pacific is anticipated to grow at the highest CAGR during the forecast period.
[SS1]Which nations? Asia-pacific nations?
[s2]Done

Overview

The global rare biomarkers specimen collection and stabilization market was valued at $23,270.04 million in 2021, and is projected to reach $54,145.59 million by 2031, registering a CAGR of 8.7% from 2022 to 2031. Biomarker is a measurable indicator of some biological state or condition. It is usually used in the measurement and evaluation of blood, urine, and soft tissues. Biomarkers focus on monitoring vital parameters such as heart rate and accelerometer data. In rare biomarker specimen collection, the rare disease-causing microorganisms are identified by evaluating blood and other parts of body.These samples are stabilized by using isolation kits, reagents, and other equipment for further study. Molecular biomarkers, cellular biomarkers, and imaging biomarkers are the three different types of biomarkers.
However, a biomarker can lessen the burden of the clinical trial process by providing information about the safety and efficacy of treatments before the collection of definitive clinical data, which provides the opportunity for mid‐course re‐appraisal, and even interruption if the intervention being investigated is revealed as potentially harmful to participants.
The key factors that drive the growth of market are rise in prevalence of chronic & genetic diseases, increase in incidence of rare diseases such as cystic fibrosis, muscular dystrophy, & spina bifida; and rise in geriatric population. For instance, in May, 2022 Illumina, Inc. a global leader in DNA sequencing and array-based technologies, announced the addition of a companion diagnostic (CDx) indication to its CE-marked in vitro diagnostic TruSight Oncology (TSO) Comprehensive (EU) test. This single test kit, launched across Europe, assesses multiple tumor genes and biomarkers to reveal the specific molecular profile of a patient's cancer.
Moreover, increased R&D activities for the launch of approved novel drugs on rare diseases, favorable government reimbursement policies for rare biomarkers, surge in investment in the modern healthcare facility sector, and rise in demand for accurate chronic disease diagnosis are anticipated to fuel the market growth.
However, stringent government regulations and high cost associated with the development of rare biomarkers specimen and standardization hamper the market growth. Conversely, emerging healthcare market in developing countries, increase in applications of rare biomarker specimens in pharmacogenomics, and surge in the risk of pandemic & rare genetic diseases are expected to provide lucrative opportunity for the growth of market during the forecast period. 
The rare biomarkers specimen collection and stabilization market is segmented on the basis of type, product, application, and region. By type, the market is categorized into circulating cell free DNA, circulating tumor cells, and exosomes vesicles. By product, the market is classified into isolation kits & reagents, blood collection tubes, and systems. By application, the market is fragmented into NIPT, oncology, transcriptomics, pharmacogenomics, transplant rejection, population screening, cardiovascular diseases, and other. By application, the oncology segment is further sub-classified into research and diagnostics.Region-wise, it is analyzed across North America, Europe, Asia-Pacific, and LAMEA.
North America accounted for a majority of the rare biomarker’s specimen collection and stabilization market share in 2021 and is anticipated to remain dominant during the forecast period. The rare biomarkers specimen collection and stabilization market is mainly driven by rise in prevalence of chronic & genetic diseases, increase in the healthcare expenditure, surge in number of approved rare biomarker isolation kits for both clinical and research use are anticipated to increase the usage of liquid biopsy and assisted reproductive technology space in the region which propels the growth of the market.
Asia-Pacific was the second largest contributor to the market in 2021, and is expected to register the fastest CAGR during the forecast period. This is due to the presence of high unmet medical needs and constantly improving healthcare infrastructure to cure chronic disorders. In addition, rise in investment for exploring the utility of circulating tumor cells (CTCs) in diagnosis, prognosis, and treatment monitoring have provided lucrative growth opportunities to players, which is further expected contribute to the growth of the market.
The key players that operate in the rare biomarkers specimen collection and stabilization market are Agilent Technologies, Bio-Rad Laboratories inc., Charles River Laboratories Inc, F. Hoffman La Roche AG, Merck KGaA, Miltenyi Biotec, Perkin Elmer, Qiagen, Thermofisher Scientific Inc and Siemens AG.

Key Benefits For Stakeholders

●This report provides a quantitative analysis of the market segments, current trends, estimations, and dynamics of the rare biomarkers specimen collection and stabilization market analysis from 2021 to 2031 to identify the prevailing rare biomarkers specimen collection and stabilization market opportunities.
●The market research is offered along with information related to key drivers, restraints, and opportunities.
●Porter's five forces analysis highlights the potency of buyers and suppliers to enable stakeholders make profit-oriented business decisions and strengthen their supplier-buyer network.
●In-depth analysis of the rare biomarkers specimen collection and stabilization market segmentation assists to determine the prevailing market opportunities.
●Major countries in each region are mapped according to their revenue contribution to the global market.
●Market player positioning facilitates benchmarking and provides a clear understanding of the present position of the market players.
●The report includes the analysis of the regional as well as global rare biomarkers specimen collection and stabilization market trends, key players, market segments, application areas, and market growth strategies.
Key Market Segments
○ Eurofins Scientific, Inc

Scope of Rare Biomarkers Specimen Collection and Stabilization Market Report

Report Metric Details
Report Name Rare Biomarkers Specimen Collection and Stabilization Market
Accounted market size in 2021 $ 23.3 billion
Forecasted market size in 2031 $ 54.2 billion
CAGR 8.7%
Base Year 2021
Forecasted years 2024 - 2031
By Type ● Circulating Cell Free DNA (ccfDNA)
● Circulating Tumor Cells (CTCs)
● Exosomes Vesicles
By Product ● Isolation Kits and Reagent
● Blood Collection Tubes
● Systems
By Application ● Transcriptomics
● Pharmacogenomics
● Transplant Rejection
● Population Screening
● Others
● Oncology
○ Type
○ Research
○ Diagnostics
● Cardiovascular Diseases
● NIPT
By Region
  • North America (United States, Canada)
  • Europe (Germany, France, UK, Italy, Russia) Rest of Europe
  • Nordic Countries
  • Asia-Pacific (China, Japan, South Korea)
  • Southeast Asia (India, Australia)
  • Rest of Asia
  • Latin America (Mexico, Brazil)
  • Rest of Latin America
  • Middle East & Africa (Turkey, Saudi Arabia, UAE, Rest of MEA)
Forecast units USD million in value
Report coverage Revenue and volume forecast, company share, competitive landscape, growth factors and trends

FAQ for this report

How fast is Rare Biomarkers Specimen Collection and Stabilization Market growing?

Ans: The Rare Biomarkers Specimen Collection and Stabilization Market witnessing a CAGR of 8.7% during the forecast period 2024-2031.

What is the Rare Biomarkers Specimen Collection and Stabilization Market size in 2031?

Ans: The Rare Biomarkers Specimen Collection and Stabilization Market size in 2031 will be $ 54.2 billion.

What are the Application segmentation covered in the Rare Biomarkers Specimen Collection and Stabilization Market report?

Ans: The Applications covered in the Rare Biomarkers Specimen Collection and Stabilization Market report are ● Transcriptomics, ● Pharmacogenomics, ● Transplant Rejection, ● Population Screening, ● Others, ● Oncology, ○ Type, ○ Research, ○ Diagnostics, ● Cardiovascular Diseases, ● NIPT

What are the Type segmentation covered in the Rare Biomarkers Specimen Collection and Stabilization Market report?

Ans: The Types covered in the Rare Biomarkers Specimen Collection and Stabilization Market report are ● Circulating Cell Free DNA (ccfDNA), ● Circulating Tumor Cells (CTCs), ● Exosomes Vesicles

CHAPTER 1:INTRODUCTION
1.1.Report description
1.2.Key market segments
1.3.Key benefits to the stakeholders
1.4.Research Methodology
1.4.1.Secondary research
1.4.2.Primary research
1.4.3.Analyst tools and models
CHAPTER 2:EXECUTIVE SUMMARY
2.1.Key findings of the study
2.2.CXO Perspective
CHAPTER 3:MARKET OVERVIEW
3.1.Market definition and scope
3.2.Key findings
3.2.1.Top investment pockets
3.3.Porter’s five forces analysis
3.4.Top player positioning
3.5.Market dynamics
3.5.1.Drivers
3.5.2.Restraints
3.5.3.Opportunities
3.6.COVID-19 Impact Analysis on the market
CHAPTER 4: RARE BIOMARKERS SPECIMEN COLLECTION AND STABILIZATION MARKET, BY TYPE
4.1 Overview
4.1.1 Market size and forecast
4.2 Circulating Cell Free DNA (ccfDNA)
4.2.1 Key market trends, growth factors and opportunities
4.2.2 Market size and forecast, by region
4.2.3 Market analysis by country
4.3 Circulating Tumor Cells (CTCs)
4.3.1 Key market trends, growth factors and opportunities
4.3.2 Market size and forecast, by region
4.3.3 Market analysis by country
4.4 Exosomes Vesicles
4.4.1 Key market trends, growth factors and opportunities
4.4.2 Market size and forecast, by region
4.4.3 Market analysis by country
CHAPTER 5: RARE BIOMARKERS SPECIMEN COLLECTION AND STABILIZATION MARKET, BY PRODUCT
5.1 Overview
5.1.1 Market size and forecast
5.2 Isolation Kits and Reagent
5.2.1 Key market trends, growth factors and opportunities
5.2.2 Market size and forecast, by region
5.2.3 Market analysis by country
5.3 Blood Collection Tubes
5.3.1 Key market trends, growth factors and opportunities
5.3.2 Market size and forecast, by region
5.3.3 Market analysis by country
5.4 Systems
5.4.1 Key market trends, growth factors and opportunities
5.4.2 Market size and forecast, by region
5.4.3 Market analysis by country
CHAPTER 6: RARE BIOMARKERS SPECIMEN COLLECTION AND STABILIZATION MARKET, BY APPLICATION
6.1 Overview
6.1.1 Market size and forecast
6.2 Oncology
6.2.1 Key market trends, growth factors and opportunities
6.2.2 Market size and forecast, by region
6.2.3 Market analysis by country
6.2.4 Oncology Rare Biomarkers Specimen Collection and Stabilization Market by Type
6.2.4.1 Research Market size and forecast, by region
6.2.4.2 Diagnostics Market size and forecast, by region
6.3 Cardiovascular Diseases
6.3.1 Key market trends, growth factors and opportunities
6.3.2 Market size and forecast, by region
6.3.3 Market analysis by country
6.4 NIPT
6.4.1 Key market trends, growth factors and opportunities
6.4.2 Market size and forecast, by region
6.4.3 Market analysis by country
6.5 Transcriptomics
6.5.1 Key market trends, growth factors and opportunities
6.5.2 Market size and forecast, by region
6.5.3 Market analysis by country
6.6 Pharmacogenomics
6.6.1 Key market trends, growth factors and opportunities
6.6.2 Market size and forecast, by region
6.6.3 Market analysis by country
6.7 Transplant Rejection
6.7.1 Key market trends, growth factors and opportunities
6.7.2 Market size and forecast, by region
6.7.3 Market analysis by country
6.8 Population Screening
6.8.1 Key market trends, growth factors and opportunities
6.8.2 Market size and forecast, by region
6.8.3 Market analysis by country
6.9 Others
6.9.1 Key market trends, growth factors and opportunities
6.9.2 Market size and forecast, by region
6.9.3 Market analysis by country
CHAPTER 7: RARE BIOMARKERS SPECIMEN COLLECTION AND STABILIZATION MARKET, BY REGION
7.1 Overview
7.1.1 Market size and forecast
7.2 North America
7.2.1 Key trends and opportunities
7.2.2 North America Market size and forecast, by Type
7.2.3 North America Market size and forecast, by Product
7.2.4 North America Market size and forecast, by Application
7.2.4.1 North America Oncology Rare Biomarkers Specimen Collection and Stabilization Market by Type
7.2.5 North America Market size and forecast, by country
7.2.5.1 U.S.
7.2.5.1.1 Market size and forecast, by Type
7.2.5.1.2 Market size and forecast, by Product
7.2.5.1.3 Market size and forecast, by Application
7.2.5.2 Canada
7.2.5.2.1 Market size and forecast, by Type
7.2.5.2.2 Market size and forecast, by Product
7.2.5.2.3 Market size and forecast, by Application
7.2.5.3 Mexico
7.2.5.3.1 Market size and forecast, by Type
7.2.5.3.2 Market size and forecast, by Product
7.2.5.3.3 Market size and forecast, by Application
7.3 Europe
7.3.1 Key trends and opportunities
7.3.2 Europe Market size and forecast, by Type
7.3.3 Europe Market size and forecast, by Product
7.3.4 Europe Market size and forecast, by Application
7.3.4.1 Europe Oncology Rare Biomarkers Specimen Collection and Stabilization Market by Type
7.3.5 Europe Market size and forecast, by country
7.3.5.1 Germany
7.3.5.1.1 Market size and forecast, by Type
7.3.5.1.2 Market size and forecast, by Product
7.3.5.1.3 Market size and forecast, by Application
7.3.5.2 France
7.3.5.2.1 Market size and forecast, by Type
7.3.5.2.2 Market size and forecast, by Product
7.3.5.2.3 Market size and forecast, by Application
7.3.5.3 UK
7.3.5.3.1 Market size and forecast, by Type
7.3.5.3.2 Market size and forecast, by Product
7.3.5.3.3 Market size and forecast, by Application
7.3.5.4 Italy
7.3.5.4.1 Market size and forecast, by Type
7.3.5.4.2 Market size and forecast, by Product
7.3.5.4.3 Market size and forecast, by Application
7.3.5.5 Spain
7.3.5.5.1 Market size and forecast, by Type
7.3.5.5.2 Market size and forecast, by Product
7.3.5.5.3 Market size and forecast, by Application
7.3.5.6 Rest of Europe
7.3.5.6.1 Market size and forecast, by Type
7.3.5.6.2 Market size and forecast, by Product
7.3.5.6.3 Market size and forecast, by Application
7.4 Asia-Pacific
7.4.1 Key trends and opportunities
7.4.2 Asia-Pacific Market size and forecast, by Type
7.4.3 Asia-Pacific Market size and forecast, by Product
7.4.4 Asia-Pacific Market size and forecast, by Application
7.4.4.1 Asia-Pacific Oncology Rare Biomarkers Specimen Collection and Stabilization Market by Type
7.4.5 Asia-Pacific Market size and forecast, by country
7.4.5.1 Japan
7.4.5.1.1 Market size and forecast, by Type
7.4.5.1.2 Market size and forecast, by Product
7.4.5.1.3 Market size and forecast, by Application
7.4.5.2 China
7.4.5.2.1 Market size and forecast, by Type
7.4.5.2.2 Market size and forecast, by Product
7.4.5.2.3 Market size and forecast, by Application
7.4.5.3 Australia
7.4.5.3.1 Market size and forecast, by Type
7.4.5.3.2 Market size and forecast, by Product
7.4.5.3.3 Market size and forecast, by Application
7.4.5.4 India
7.4.5.4.1 Market size and forecast, by Type
7.4.5.4.2 Market size and forecast, by Product
7.4.5.4.3 Market size and forecast, by Application
7.4.5.5 South Korea
7.4.5.5.1 Market size and forecast, by Type
7.4.5.5.2 Market size and forecast, by Product
7.4.5.5.3 Market size and forecast, by Application
7.4.5.6 Rest of Asia-Pacific
7.4.5.6.1 Market size and forecast, by Type
7.4.5.6.2 Market size and forecast, by Product
7.4.5.6.3 Market size and forecast, by Application
7.5 LAMEA
7.5.1 Key trends and opportunities
7.5.2 LAMEA Market size and forecast, by Type
7.5.3 LAMEA Market size and forecast, by Product
7.5.4 LAMEA Market size and forecast, by Application
7.5.4.1 LAMEA Oncology Rare Biomarkers Specimen Collection and Stabilization Market by Type
7.5.5 LAMEA Market size and forecast, by country
7.5.5.1 Brazil
7.5.5.1.1 Market size and forecast, by Type
7.5.5.1.2 Market size and forecast, by Product
7.5.5.1.3 Market size and forecast, by Application
7.5.5.2 Saudi Arabia
7.5.5.2.1 Market size and forecast, by Type
7.5.5.2.2 Market size and forecast, by Product
7.5.5.2.3 Market size and forecast, by Application
7.5.5.3 South Africa
7.5.5.3.1 Market size and forecast, by Type
7.5.5.3.2 Market size and forecast, by Product
7.5.5.3.3 Market size and forecast, by Application
7.5.5.4 Rest of LAMEA
7.5.5.4.1 Market size and forecast, by Type
7.5.5.4.2 Market size and forecast, by Product
7.5.5.4.3 Market size and forecast, by Application
CHAPTER 8: COMPANY LANDSCAPE
8.1. Introduction
8.2. Top winning strategies
8.3. Product Mapping of Top 10 Player
8.4. Competitive Dashboard
8.5. Competitive Heatmap
8.6. Key developments
CHAPTER 9: COMPANY PROFILES
9.1 Agilent Technologies Inc
9.1.1 Company overview
9.1.2 Company snapshot
9.1.3 Operating business segments
9.1.4 Product portfolio
9.1.5 Business performance
9.1.6 Key strategic moves and developments
9.2 F Hoffman La Roche
9.2.1 Company overview
9.2.2 Company snapshot
9.2.3 Operating business segments
9.2.4 Product portfolio
9.2.5 Business performance
9.2.6 Key strategic moves and developments
9.3 Merck Kgaa
9.3.1 Company overview
9.3.2 Company snapshot
9.3.3 Operating business segments
9.3.4 Product portfolio
9.3.5 Business performance
9.3.6 Key strategic moves and developments
9.4 Bio Rad Laboratories
9.4.1 Company overview
9.4.2 Company snapshot
9.4.3 Operating business segments
9.4.4 Product portfolio
9.4.5 Business performance
9.4.6 Key strategic moves and developments
9.5 Thermofischer Scientific Inc
9.5.1 Company overview
9.5.2 Company snapshot
9.5.3 Operating business segments
9.5.4 Product portfolio
9.5.5 Business performance
9.5.6 Key strategic moves and developments
9.6 Qiagen
9.6.1 Company overview
9.6.2 Company snapshot
9.6.3 Operating business segments
9.6.4 Product portfolio
9.6.5 Business performance
9.6.6 Key strategic moves and developments
9.7 Perkin Elmer
9.7.1 Company overview
9.7.2 Company snapshot
9.7.3 Operating business segments
9.7.4 Product portfolio
9.7.5 Business performance
9.7.6 Key strategic moves and developments
9.8 Charles River Laboratories International, Inc.
9.8.1 Company overview
9.8.2 Company snapshot
9.8.3 Operating business segments
9.8.4 Product portfolio
9.8.5 Business performance
9.8.6 Key strategic moves and developments
9.9 Siemens Healthineers
9.9.1 Company overview
9.9.2 Company snapshot
9.9.3 Operating business segments
9.9.4 Product portfolio
9.9.5 Business performance
9.9.6 Key strategic moves and developments
9.10 Eurofins Scientific, Inc.
9.10.1 Company overview
9.10.2 Company snapshot
9.10.3 Operating business segments
9.10.4 Product portfolio
9.10.5 Business performance
9.10.6 Key strategic moves and development
LIST OF TABLES
TABLE 1. GLOBAL RARE BIOMARKERS SPECIMEN COLLECTION AND STABILIZATION MARKET, BY TYPE, 2021-2031 ($MILLION)
TABLE 2. RARE BIOMARKERS SPECIMEN COLLECTION AND STABILIZATION MARKET, FOR CIRCULATING CELL FREE DNA (CCFDNA), BY REGION, 2021-2031 ($MILLION)
TABLE 3. RARE BIOMARKERS SPECIMEN COLLECTION AND STABILIZATION MARKET FOR CIRCULATING CELL FREE DNA (CCFDNA), BY COUNTRY, 2021-2031 ($MILLION)
TABLE 4. RARE BIOMARKERS SPECIMEN COLLECTION AND STABILIZATION MARKET, FOR CIRCULATING TUMOR CELLS (CTCS), BY REGION, 2021-2031 ($MILLION)
TABLE 5. RARE BIOMARKERS SPECIMEN COLLECTION AND STABILIZATION MARKET FOR CIRCULATING TUMOR CELLS (CTCS), BY COUNTRY, 2021-2031 ($MILLION)
TABLE 6. RARE BIOMARKERS SPECIMEN COLLECTION AND STABILIZATION MARKET, FOR EXOSOMES VESICLES, BY REGION, 2021-2031 ($MILLION)
TABLE 7. RARE BIOMARKERS SPECIMEN COLLECTION AND STABILIZATION MARKET FOR EXOSOMES VESICLES, BY COUNTRY, 2021-2031 ($MILLION)
TABLE 8. GLOBAL RARE BIOMARKERS SPECIMEN COLLECTION AND STABILIZATION MARKET, BY PRODUCT, 2021-2031 ($MILLION)
TABLE 9. RARE BIOMARKERS SPECIMEN COLLECTION AND STABILIZATION MARKET, FOR ISOLATION KITS AND REAGENT, BY REGION, 2021-2031 ($MILLION)
TABLE 10. RARE BIOMARKERS SPECIMEN COLLECTION AND STABILIZATION MARKET FOR ISOLATION KITS AND REAGENT, BY COUNTRY, 2021-2031 ($MILLION)
TABLE 11. RARE BIOMARKERS SPECIMEN COLLECTION AND STABILIZATION MARKET, FOR BLOOD COLLECTION TUBES, BY REGION, 2021-2031 ($MILLION)
TABLE 12. RARE BIOMARKERS SPECIMEN COLLECTION AND STABILIZATION MARKET FOR BLOOD COLLECTION TUBES, BY COUNTRY, 2021-2031 ($MILLION)
TABLE 13. RARE BIOMARKERS SPECIMEN COLLECTION AND STABILIZATION MARKET, FOR SYSTEMS, BY REGION, 2021-2031 ($MILLION)
TABLE 14. RARE BIOMARKERS SPECIMEN COLLECTION AND STABILIZATION MARKET FOR SYSTEMS, BY COUNTRY, 2021-2031 ($MILLION)
TABLE 15. GLOBAL RARE BIOMARKERS SPECIMEN COLLECTION AND STABILIZATION MARKET, BY APPLICATION, 2021-2031 ($MILLION)
TABLE 16. RARE BIOMARKERS SPECIMEN COLLECTION AND STABILIZATION MARKET, FOR ONCOLOGY, BY REGION, 2021-2031 ($MILLION)
TABLE 17. RARE BIOMARKERS SPECIMEN COLLECTION AND STABILIZATION MARKET FOR ONCOLOGY, BY COUNTRY, 2021-2031 ($MILLION)
TABLE 18. GLOBAL ONCOLOGY RARE BIOMARKERS SPECIMEN COLLECTION AND STABILIZATION MARKET, BY TYPE, 2021-2031 ($MILLION)
TABLE 19. RARE BIOMARKERS SPECIMEN COLLECTION AND STABILIZATION MARKET, FOR RESEARCH, BY REGION, 2021-2031 ($MILLION)
TABLE 20. RARE BIOMARKERS SPECIMEN COLLECTION AND STABILIZATION MARKET, FOR DIAGNOSTICS, BY REGION, 2021-2031 ($MILLION)
TABLE 21. RARE BIOMARKERS SPECIMEN COLLECTION AND STABILIZATION MARKET, FOR CARDIOVASCULAR DISEASES, BY REGION, 2021-2031 ($MILLION)
TABLE 22. RARE BIOMARKERS SPECIMEN COLLECTION AND STABILIZATION MARKET FOR CARDIOVASCULAR DISEASES, BY COUNTRY, 2021-2031 ($MILLION)
TABLE 23. RARE BIOMARKERS SPECIMEN COLLECTION AND STABILIZATION MARKET, FOR NIPT, BY REGION, 2021-2031 ($MILLION)
TABLE 24. RARE BIOMARKERS SPECIMEN COLLECTION AND STABILIZATION MARKET FOR NIPT, BY COUNTRY, 2021-2031 ($MILLION)
TABLE 25. RARE BIOMARKERS SPECIMEN COLLECTION AND STABILIZATION MARKET, FOR TRANSCRIPTOMICS, BY REGION, 2021-2031 ($MILLION)
TABLE 26. RARE BIOMARKERS SPECIMEN COLLECTION AND STABILIZATION MARKET FOR TRANSCRIPTOMICS, BY COUNTRY, 2021-2031 ($MILLION)
TABLE 27. RARE BIOMARKERS SPECIMEN COLLECTION AND STABILIZATION MARKET, FOR PHARMACOGENOMICS, BY REGION, 2021-2031 ($MILLION)
TABLE 28. RARE BIOMARKERS SPECIMEN COLLECTION AND STABILIZATION MARKET FOR PHARMACOGENOMICS, BY COUNTRY, 2021-2031 ($MILLION)
TABLE 29. RARE BIOMARKERS SPECIMEN COLLECTION AND STABILIZATION MARKET, FOR TRANSPLANT REJECTION, BY REGION, 2021-2031 ($MILLION)
TABLE 30. RARE BIOMARKERS SPECIMEN COLLECTION AND STABILIZATION MARKET FOR TRANSPLANT REJECTION, BY COUNTRY, 2021-2031 ($MILLION)
TABLE 31. RARE BIOMARKERS SPECIMEN COLLECTION AND STABILIZATION MARKET, FOR POPULATION SCREENING, BY REGION, 2021-2031 ($MILLION)
TABLE 32. RARE BIOMARKERS SPECIMEN COLLECTION AND STABILIZATION MARKET FOR POPULATION SCREENING, BY COUNTRY, 2021-2031 ($MILLION)
TABLE 33. RARE BIOMARKERS SPECIMEN COLLECTION AND STABILIZATION MARKET, FOR OTHERS, BY REGION, 2021-2031 ($MILLION)
TABLE 34. RARE BIOMARKERS SPECIMEN COLLECTION AND STABILIZATION MARKET FOR OTHERS, BY COUNTRY, 2021-2031 ($MILLION)
TABLE 35. RARE BIOMARKERS SPECIMEN COLLECTION AND STABILIZATION MARKET, BY REGION, 2021-2031 ($MILLION)
TABLE 36. NORTH AMERICA RARE BIOMARKERS SPECIMEN COLLECTION AND STABILIZATION MARKET, BY TYPE, 2021-2031 ($MILLION)
TABLE 37. NORTH AMERICA RARE BIOMARKERS SPECIMEN COLLECTION AND STABILIZATION MARKET, BY PRODUCT, 2021-2031 ($MILLION)
TABLE 38. NORTH AMERICA RARE BIOMARKERS SPECIMEN COLLECTION AND STABILIZATION MARKET, BY APPLICATION, 2021-2031 ($MILLION)
TABLE 39. NORTH AMERICA ONCOLOGY RARE BIOMARKERS SPECIMEN COLLECTION AND STABILIZATION MARKET, BY TYPE, 2021-2031 ($MILLION)
TABLE 40. NORTH AMERICA RARE BIOMARKERS SPECIMEN COLLECTION AND STABILIZATION MARKET, BY COUNTRY, 2021-2031 ($MILLION)
TABLE 41. U.S. RARE BIOMARKERS SPECIMEN COLLECTION AND STABILIZATION MARKET, BY TYPE, 2021-2031 ($MILLION)
TABLE 42. U.S. RARE BIOMARKERS SPECIMEN COLLECTION AND STABILIZATION MARKET, BY PRODUCT, 2021-2031 ($MILLION)
TABLE 43. U.S. RARE BIOMARKERS SPECIMEN COLLECTION AND STABILIZATION MARKET, BY APPLICATION, 2021-2031 ($MILLION)
TABLE 44. CANADA RARE BIOMARKERS SPECIMEN COLLECTION AND STABILIZATION MARKET, BY TYPE, 2021-2031 ($MILLION)
TABLE 45. CANADA RARE BIOMARKERS SPECIMEN COLLECTION AND STABILIZATION MARKET, BY PRODUCT, 2021-2031 ($MILLION)
TABLE 46. CANADA RARE BIOMARKERS SPECIMEN COLLECTION AND STABILIZATION MARKET, BY APPLICATION, 2021-2031 ($MILLION)
TABLE 47. MEXICO RARE BIOMARKERS SPECIMEN COLLECTION AND STABILIZATION MARKET, BY TYPE, 2021-2031 ($MILLION)
TABLE 48. MEXICO RARE BIOMARKERS SPECIMEN COLLECTION AND STABILIZATION MARKET, BY PRODUCT, 2021-2031 ($MILLION)
TABLE 49. MEXICO RARE BIOMARKERS SPECIMEN COLLECTION AND STABILIZATION MARKET, BY APPLICATION, 2021-2031 ($MILLION)
TABLE 50. EUROPE RARE BIOMARKERS SPECIMEN COLLECTION AND STABILIZATION MARKET, BY TYPE, 2021-2031 ($MILLION)
TABLE 51. EUROPE RARE BIOMARKERS SPECIMEN COLLECTION AND STABILIZATION MARKET, BY PRODUCT, 2021-2031 ($MILLION)
TABLE 52. EUROPE RARE BIOMARKERS SPECIMEN COLLECTION AND STABILIZATION MARKET, BY APPLICATION, 2021-2031 ($MILLION)
TABLE 53. EUROPE ONCOLOGY RARE BIOMARKERS SPECIMEN COLLECTION AND STABILIZATION MARKET, BY TYPE, 2021-2031 ($MILLION)
TABLE 54. EUROPE RARE BIOMARKERS SPECIMEN COLLECTION AND STABILIZATION MARKET, BY COUNTRY, 2021-2031 ($MILLION)
TABLE 55. GERMANY RARE BIOMARKERS SPECIMEN COLLECTION AND STABILIZATION MARKET, BY TYPE, 2021-2031 ($MILLION)
TABLE 56. GERMANY RARE BIOMARKERS SPECIMEN COLLECTION AND STABILIZATION MARKET, BY PRODUCT, 2021-2031 ($MILLION)
TABLE 57. GERMANY RARE BIOMARKERS SPECIMEN COLLECTION AND STABILIZATION MARKET, BY APPLICATION, 2021-2031 ($MILLION)
TABLE 58. FRANCE RARE BIOMARKERS SPECIMEN COLLECTION AND STABILIZATION MARKET, BY TYPE, 2021-2031 ($MILLION)
TABLE 59. FRANCE RARE BIOMARKERS SPECIMEN COLLECTION AND STABILIZATION MARKET, BY PRODUCT, 2021-2031 ($MILLION)
TABLE 60. FRANCE RARE BIOMARKERS SPECIMEN COLLECTION AND STABILIZATION MARKET, BY APPLICATION, 2021-2031 ($MILLION)
TABLE 61. UK RARE BIOMARKERS SPECIMEN COLLECTION AND STABILIZATION MARKET, BY TYPE, 2021-2031 ($MILLION)
TABLE 62. UK RARE BIOMARKERS SPECIMEN COLLECTION AND STABILIZATION MARKET, BY PRODUCT, 2021-2031 ($MILLION)
TABLE 63. UK RARE BIOMARKERS SPECIMEN COLLECTION AND STABILIZATION MARKET, BY APPLICATION, 2021-2031 ($MILLION)
TABLE 64. ITALY RARE BIOMARKERS SPECIMEN COLLECTION AND STABILIZATION MARKET, BY TYPE, 2021-2031 ($MILLION)
TABLE 65. ITALY RARE BIOMARKERS SPECIMEN COLLECTION AND STABILIZATION MARKET, BY PRODUCT, 2021-2031 ($MILLION)
TABLE 66. ITALY RARE BIOMARKERS SPECIMEN COLLECTION AND STABILIZATION MARKET, BY APPLICATION, 2021-2031 ($MILLION)
TABLE 67. SPAIN RARE BIOMARKERS SPECIMEN COLLECTION AND STABILIZATION MARKET, BY TYPE, 2021-2031 ($MILLION)
TABLE 68. SPAIN RARE BIOMARKERS SPECIMEN COLLECTION AND STABILIZATION MARKET, BY PRODUCT, 2021-2031 ($MILLION)
TABLE 69. SPAIN RARE BIOMARKERS SPECIMEN COLLECTION AND STABILIZATION MARKET, BY APPLICATION, 2021-2031 ($MILLION)
TABLE 70. REST OF EUROPE RARE BIOMARKERS SPECIMEN COLLECTION AND STABILIZATION MARKET, BY TYPE, 2021-2031 ($MILLION)
TABLE 71. REST OF EUROPE RARE BIOMARKERS SPECIMEN COLLECTION AND STABILIZATION MARKET, BY PRODUCT, 2021-2031 ($MILLION)
TABLE 72. REST OF EUROPE RARE BIOMARKERS SPECIMEN COLLECTION AND STABILIZATION MARKET, BY APPLICATION, 2021-2031 ($MILLION)
TABLE 73. ASIA-PACIFIC RARE BIOMARKERS SPECIMEN COLLECTION AND STABILIZATION MARKET, BY TYPE, 2021-2031 ($MILLION)
TABLE 74. ASIA-PACIFIC RARE BIOMARKERS SPECIMEN COLLECTION AND STABILIZATION MARKET, BY PRODUCT, 2021-2031 ($MILLION)
TABLE 75. ASIA-PACIFIC RARE BIOMARKERS SPECIMEN COLLECTION AND STABILIZATION MARKET, BY APPLICATION, 2021-2031 ($MILLION)
TABLE 76. ASIA-PACIFIC ONCOLOGY RARE BIOMARKERS SPECIMEN COLLECTION AND STABILIZATION MARKET, BY TYPE, 2021-2031 ($MILLION)
TABLE 77. ASIA-PACIFIC RARE BIOMARKERS SPECIMEN COLLECTION AND STABILIZATION MARKET, BY COUNTRY, 2021-2031 ($MILLION)
TABLE 78. JAPAN RARE BIOMARKERS SPECIMEN COLLECTION AND STABILIZATION MARKET, BY TYPE, 2021-2031 ($MILLION)
TABLE 79. JAPAN RARE BIOMARKERS SPECIMEN COLLECTION AND STABILIZATION MARKET, BY PRODUCT, 2021-2031 ($MILLION)
TABLE 80. JAPAN RARE BIOMARKERS SPECIMEN COLLECTION AND STABILIZATION MARKET, BY APPLICATION, 2021-2031 ($MILLION)
TABLE 81. CHINA RARE BIOMARKERS SPECIMEN COLLECTION AND STABILIZATION MARKET, BY TYPE, 2021-2031 ($MILLION)
TABLE 82. CHINA RARE BIOMARKERS SPECIMEN COLLECTION AND STABILIZATION MARKET, BY PRODUCT, 2021-2031 ($MILLION)
TABLE 83. CHINA RARE BIOMARKERS SPECIMEN COLLECTION AND STABILIZATION MARKET, BY APPLICATION, 2021-2031 ($MILLION)
TABLE 84. AUSTRALIA RARE BIOMARKERS SPECIMEN COLLECTION AND STABILIZATION MARKET, BY TYPE, 2021-2031 ($MILLION)
TABLE 85. AUSTRALIA RARE BIOMARKERS SPECIMEN COLLECTION AND STABILIZATION MARKET, BY PRODUCT, 2021-2031 ($MILLION)
TABLE 86. AUSTRALIA RARE BIOMARKERS SPECIMEN COLLECTION AND STABILIZATION MARKET, BY APPLICATION, 2021-2031 ($MILLION)
TABLE 87. INDIA RARE BIOMARKERS SPECIMEN COLLECTION AND STABILIZATION MARKET, BY TYPE, 2021-2031 ($MILLION)
TABLE 88. INDIA RARE BIOMARKERS SPECIMEN COLLECTION AND STABILIZATION MARKET, BY PRODUCT, 2021-2031 ($MILLION)
TABLE 89. INDIA RARE BIOMARKERS SPECIMEN COLLECTION AND STABILIZATION MARKET, BY APPLICATION, 2021-2031 ($MILLION)
TABLE 90. SOUTH KOREA RARE BIOMARKERS SPECIMEN COLLECTION AND STABILIZATION MARKET, BY TYPE, 2021-2031 ($MILLION)
TABLE 91. SOUTH KOREA RARE BIOMARKERS SPECIMEN COLLECTION AND STABILIZATION MARKET, BY PRODUCT, 2021-2031 ($MILLION)
TABLE 92. SOUTH KOREA RARE BIOMARKERS SPECIMEN COLLECTION AND STABILIZATION MARKET, BY APPLICATION, 2021-2031 ($MILLION)
TABLE 93. REST OF ASIA-PACIFIC RARE BIOMARKERS SPECIMEN COLLECTION AND STABILIZATION MARKET, BY TYPE, 2021-2031 ($MILLION)
TABLE 94. REST OF ASIA-PACIFIC RARE BIOMARKERS SPECIMEN COLLECTION AND STABILIZATION MARKET, BY PRODUCT, 2021-2031 ($MILLION)
TABLE 95. REST OF ASIA-PACIFIC RARE BIOMARKERS SPECIMEN COLLECTION AND STABILIZATION MARKET, BY APPLICATION, 2021-2031 ($MILLION)
TABLE 96. LAMEA RARE BIOMARKERS SPECIMEN COLLECTION AND STABILIZATION MARKET, BY TYPE, 2021-2031 ($MILLION)
TABLE 97. LAMEA RARE BIOMARKERS SPECIMEN COLLECTION AND STABILIZATION MARKET, BY PRODUCT, 2021-2031 ($MILLION)
TABLE 98. LAMEA RARE BIOMARKERS SPECIMEN COLLECTION AND STABILIZATION MARKET, BY APPLICATION, 2021-2031 ($MILLION)
TABLE 99. LAMEA ONCOLOGY RARE BIOMARKERS SPECIMEN COLLECTION AND STABILIZATION MARKET, BY TYPE, 2021-2031 ($MILLION)
TABLE 100. LAMEA RARE BIOMARKERS SPECIMEN COLLECTION AND STABILIZATION MARKET, BY COUNTRY, 2021-2031 ($MILLION)
TABLE 101. BRAZIL RARE BIOMARKERS SPECIMEN COLLECTION AND STABILIZATION MARKET, BY TYPE, 2021-2031 ($MILLION)
TABLE 102. BRAZIL RARE BIOMARKERS SPECIMEN COLLECTION AND STABILIZATION MARKET, BY PRODUCT, 2021-2031 ($MILLION)
TABLE 103. BRAZIL RARE BIOMARKERS SPECIMEN COLLECTION AND STABILIZATION MARKET, BY APPLICATION, 2021-2031 ($MILLION)
TABLE 104. SAUDI ARABIA RARE BIOMARKERS SPECIMEN COLLECTION AND STABILIZATION MARKET, BY TYPE, 2021-2031 ($MILLION)
TABLE 105. SAUDI ARABIA RARE BIOMARKERS SPECIMEN COLLECTION AND STABILIZATION MARKET, BY PRODUCT, 2021-2031 ($MILLION)
TABLE 106. SAUDI ARABIA RARE BIOMARKERS SPECIMEN COLLECTION AND STABILIZATION MARKET, BY APPLICATION, 2021-2031 ($MILLION)
TABLE 107. SOUTH AFRICA RARE BIOMARKERS SPECIMEN COLLECTION AND STABILIZATION MARKET, BY TYPE, 2021-2031 ($MILLION)
TABLE 108. SOUTH AFRICA RARE BIOMARKERS SPECIMEN COLLECTION AND STABILIZATION MARKET, BY PRODUCT, 2021-2031 ($MILLION)
TABLE 109. SOUTH AFRICA RARE BIOMARKERS SPECIMEN COLLECTION AND STABILIZATION MARKET, BY APPLICATION, 2021-2031 ($MILLION)
TABLE 110. REST OF LAMEA RARE BIOMARKERS SPECIMEN COLLECTION AND STABILIZATION MARKET, BY TYPE, 2021-2031 ($MILLION)
TABLE 111. REST OF LAMEA RARE BIOMARKERS SPECIMEN COLLECTION AND STABILIZATION MARKET, BY PRODUCT, 2021-2031 ($MILLION)
TABLE 112. REST OF LAMEA RARE BIOMARKERS SPECIMEN COLLECTION AND STABILIZATION MARKET, BY APPLICATION, 2021-2031 ($MILLION)
TABLE 113.AGILENT TECHNOLOGIES INC: COMPANY SNAPSHOT
TABLE 114.AGILENT TECHNOLOGIES INC: OPERATING SEGMENTS
TABLE 115.AGILENT TECHNOLOGIES INC: PRODUCT PORTFOLIO
TABLE 116.AGILENT TECHNOLOGIES INC: NET SALES,
TABLE 117.AGILENT TECHNOLOGIES INC: KEY STRATERGIES
TABLE 118.F HOFFMAN LA ROCHE: COMPANY SNAPSHOT
TABLE 119.F HOFFMAN LA ROCHE: OPERATING SEGMENTS
TABLE 120.F HOFFMAN LA ROCHE: PRODUCT PORTFOLIO
TABLE 121.F HOFFMAN LA ROCHE: NET SALES,
TABLE 122.F HOFFMAN LA ROCHE: KEY STRATERGIES
TABLE 123.MERCK KGAA: COMPANY SNAPSHOT
TABLE 124.MERCK KGAA: OPERATING SEGMENTS
TABLE 125.MERCK KGAA: PRODUCT PORTFOLIO
TABLE 126.MERCK KGAA: NET SALES,
TABLE 127.MERCK KGAA: KEY STRATERGIES
TABLE 128.BIO RAD LABORATORIES: COMPANY SNAPSHOT
TABLE 129.BIO RAD LABORATORIES: OPERATING SEGMENTS
TABLE 130.BIO RAD LABORATORIES: PRODUCT PORTFOLIO
TABLE 131.BIO RAD LABORATORIES: NET SALES,
TABLE 132.BIO RAD LABORATORIES: KEY STRATERGIES
TABLE 133.THERMOFISCHER SCIENTIFIC INC: COMPANY SNAPSHOT
TABLE 134.THERMOFISCHER SCIENTIFIC INC: OPERATING SEGMENTS
TABLE 135.THERMOFISCHER SCIENTIFIC INC: PRODUCT PORTFOLIO
TABLE 136.THERMOFISCHER SCIENTIFIC INC: NET SALES,
TABLE 137.THERMOFISCHER SCIENTIFIC INC: KEY STRATERGIES
TABLE 138.QIAGEN: COMPANY SNAPSHOT
TABLE 139.QIAGEN: OPERATING SEGMENTS
TABLE 140.QIAGEN: PRODUCT PORTFOLIO
TABLE 141.QIAGEN: NET SALES,
TABLE 142.QIAGEN: KEY STRATERGIES
TABLE 143.PERKIN ELMER: COMPANY SNAPSHOT
TABLE 144.PERKIN ELMER: OPERATING SEGMENTS
TABLE 145.PERKIN ELMER: PRODUCT PORTFOLIO
TABLE 146.PERKIN ELMER: NET SALES,
TABLE 147.PERKIN ELMER: KEY STRATERGIES
TABLE 148.CHARLES RIVER LABORATORIES INTERNATIONAL, INC.: COMPANY SNAPSHOT
TABLE 149.CHARLES RIVER LABORATORIES INTERNATIONAL, INC.: OPERATING SEGMENTS
TABLE 150.CHARLES RIVER LABORATORIES INTERNATIONAL, INC.: PRODUCT PORTFOLIO
TABLE 151.CHARLES RIVER LABORATORIES INTERNATIONAL, INC.: NET SALES,
TABLE 152.CHARLES RIVER LABORATORIES INTERNATIONAL, INC.: KEY STRATERGIES
TABLE 153.SIEMENS HEALTHINEERS: COMPANY SNAPSHOT
TABLE 154.SIEMENS HEALTHINEERS: OPERATING SEGMENTS
TABLE 155.SIEMENS HEALTHINEERS: PRODUCT PORTFOLIO
TABLE 156.SIEMENS HEALTHINEERS: NET SALES,
TABLE 157.SIEMENS HEALTHINEERS: KEY STRATERGIES
TABLE 158.EUROFINS SCIENTIFIC, INC.: COMPANY SNAPSHOT
TABLE 159.EUROFINS SCIENTIFIC, INC.: OPERATING SEGMENTS
TABLE 160.EUROFINS SCIENTIFIC, INC.: PRODUCT PORTFOLIO
TABLE 161.EUROFINS SCIENTIFIC, INC.: NET SALES,
TABLE 162.EUROFINS SCIENTIFIC, INC.: KEY STRATERGIES LIST OF FIGURES
FIGURE 1.RARE BIOMARKERS SPECIMEN COLLECTION AND STABILIZATION MARKET SEGMENTATION
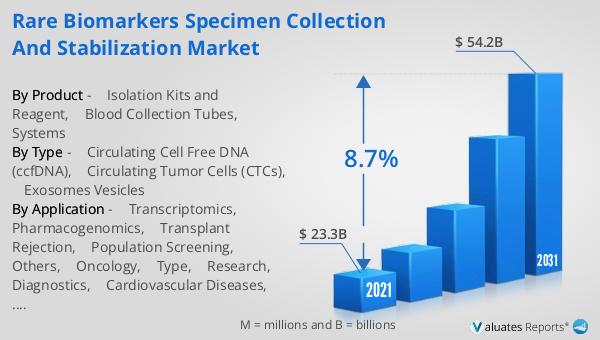
FIGURE 2.RARE BIOMARKERS SPECIMEN COLLECTION AND STABILIZATION MARKET,2021-2031
FIGURE 3.RARE BIOMARKERS SPECIMEN COLLECTION AND STABILIZATION MARKET,2021-2031
FIGURE 4. TOP INVESTMENT POCKETS, BY REGION
FIGURE 5.PORTER FIVE-1
FIGURE 6.PORTER FIVE-2
FIGURE 7.PORTER FIVE-3
FIGURE 8.PORTER FIVE-4
FIGURE 9.PORTER FIVE-5
FIGURE 10.TOP PLAYER POSITIONING
FIGURE 11.RARE BIOMARKERS SPECIMEN COLLECTION AND STABILIZATION MARKET:DRIVERS, RESTRAINTS AND OPPORTUNITIES
FIGURE 12.RARE BIOMARKERS SPECIMEN COLLECTION AND STABILIZATION MARKET,BY TYPE,2021(%)
FIGURE 13.COMPARATIVE SHARE ANALYSIS OF CIRCULATING CELL FREE DNA (CCFDNA) RARE BIOMARKERS SPECIMEN COLLECTION AND STABILIZATION MARKET,2021-2031(%)
FIGURE 14.COMPARATIVE SHARE ANALYSIS OF CIRCULATING TUMOR CELLS (CTCS) RARE BIOMARKERS SPECIMEN COLLECTION AND STABILIZATION MARKET,2021-2031(%)
FIGURE 15.COMPARATIVE SHARE ANALYSIS OF EXOSOMES VESICLES RARE BIOMARKERS SPECIMEN COLLECTION AND STABILIZATION MARKET,2021-2031(%)
FIGURE 16.RARE BIOMARKERS SPECIMEN COLLECTION AND STABILIZATION MARKET,BY PRODUCT,2021(%)
FIGURE 17.COMPARATIVE SHARE ANALYSIS OF ISOLATION KITS AND REAGENT RARE BIOMARKERS SPECIMEN COLLECTION AND STABILIZATION MARKET,2021-2031(%)
FIGURE 18.COMPARATIVE SHARE ANALYSIS OF BLOOD COLLECTION TUBES RARE BIOMARKERS SPECIMEN COLLECTION AND STABILIZATION MARKET,2021-2031(%)
FIGURE 19.COMPARATIVE SHARE ANALYSIS OF SYSTEMS RARE BIOMARKERS SPECIMEN COLLECTION AND STABILIZATION MARKET,2021-2031(%)
FIGURE 20.RARE BIOMARKERS SPECIMEN COLLECTION AND STABILIZATION MARKET,BY APPLICATION,2021(%)
FIGURE 21.COMPARATIVE SHARE ANALYSIS OF ONCOLOGY RARE BIOMARKERS SPECIMEN COLLECTION AND STABILIZATION MARKET,2021-2031(%)
FIGURE 22.COMPARATIVE SHARE ANALYSIS OF CARDIOVASCULAR DISEASES RARE BIOMARKERS SPECIMEN COLLECTION AND STABILIZATION MARKET,2021-2031(%)
FIGURE 23.COMPARATIVE SHARE ANALYSIS OF NIPT RARE BIOMARKERS SPECIMEN COLLECTION AND STABILIZATION MARKET,2021-2031(%)
FIGURE 24.COMPARATIVE SHARE ANALYSIS OF TRANSCRIPTOMICS RARE BIOMARKERS SPECIMEN COLLECTION AND STABILIZATION MARKET,2021-2031(%)
FIGURE 25.COMPARATIVE SHARE ANALYSIS OF PHARMACOGENOMICS RARE BIOMARKERS SPECIMEN COLLECTION AND STABILIZATION MARKET,2021-2031(%)
FIGURE 26.COMPARATIVE SHARE ANALYSIS OF TRANSPLANT REJECTION RARE BIOMARKERS SPECIMEN COLLECTION AND STABILIZATION MARKET,2021-2031(%)
FIGURE 27.COMPARATIVE SHARE ANALYSIS OF POPULATION SCREENING RARE BIOMARKERS SPECIMEN COLLECTION AND STABILIZATION MARKET,2021-2031(%)
FIGURE 28.COMPARATIVE SHARE ANALYSIS OF OTHERS RARE BIOMARKERS SPECIMEN COLLECTION AND STABILIZATION MARKET,2021-2031(%)
FIGURE 29.RARE BIOMARKERS SPECIMEN COLLECTION AND STABILIZATION MARKET BY REGION,2021
FIGURE 30.U.S. RARE BIOMARKERS SPECIMEN COLLECTION AND STABILIZATION MARKET,2021-2031($MILLION)
FIGURE 31.CANADA RARE BIOMARKERS SPECIMEN COLLECTION AND STABILIZATION MARKET,2021-2031($MILLION)
FIGURE 32.MEXICO RARE BIOMARKERS SPECIMEN COLLECTION AND STABILIZATION MARKET,2021-2031($MILLION)
FIGURE 33.GERMANY RARE BIOMARKERS SPECIMEN COLLECTION AND STABILIZATION MARKET,2021-2031($MILLION)
FIGURE 34.FRANCE RARE BIOMARKERS SPECIMEN COLLECTION AND STABILIZATION MARKET,2021-2031($MILLION)
FIGURE 35.UK RARE BIOMARKERS SPECIMEN COLLECTION AND STABILIZATION MARKET,2021-2031($MILLION)
FIGURE 36.ITALY RARE BIOMARKERS SPECIMEN COLLECTION AND STABILIZATION MARKET,2021-2031($MILLION)
FIGURE 37.SPAIN RARE BIOMARKERS SPECIMEN COLLECTION AND STABILIZATION MARKET,2021-2031($MILLION)
FIGURE 38.REST OF EUROPE RARE BIOMARKERS SPECIMEN COLLECTION AND STABILIZATION MARKET,2021-2031($MILLION)
FIGURE 39.JAPAN RARE BIOMARKERS SPECIMEN COLLECTION AND STABILIZATION MARKET,2021-2031($MILLION)
FIGURE 40.CHINA RARE BIOMARKERS SPECIMEN COLLECTION AND STABILIZATION MARKET,2021-2031($MILLION)
FIGURE 41.AUSTRALIA RARE BIOMARKERS SPECIMEN COLLECTION AND STABILIZATION MARKET,2021-2031($MILLION)
FIGURE 42.INDIA RARE BIOMARKERS SPECIMEN COLLECTION AND STABILIZATION MARKET,2021-2031($MILLION)
FIGURE 43.SOUTH KOREA RARE BIOMARKERS SPECIMEN COLLECTION AND STABILIZATION MARKET,2021-2031($MILLION)
FIGURE 44.REST OF ASIA-PACIFIC RARE BIOMARKERS SPECIMEN COLLECTION AND STABILIZATION MARKET,2021-2031($MILLION)
FIGURE 45.BRAZIL RARE BIOMARKERS SPECIMEN COLLECTION AND STABILIZATION MARKET,2021-2031($MILLION)
FIGURE 46.SAUDI ARABIA RARE BIOMARKERS SPECIMEN COLLECTION AND STABILIZATION MARKET,2021-2031($MILLION)
FIGURE 47.SOUTH AFRICA RARE BIOMARKERS SPECIMEN COLLECTION AND STABILIZATION MARKET,2021-2031($MILLION)
FIGURE 48.REST OF LAMEA RARE BIOMARKERS SPECIMEN COLLECTION AND STABILIZATION MARKET,2021-2031($MILLION)
FIGURE 49. TOP WINNING STRATEGIES, BY YEAR
FIGURE 50. TOP WINNING STRATEGIES, BY DEVELOPMENT
FIGURE 51. TOP WINNING STRATEGIES, BY COMPANY
FIGURE 52.PRODUCT MAPPING OF TOP 10 PLAYERS
FIGURE 53.COMPETITIVE DASHBOARD
FIGURE 54.COMPETITIVE HEATMAP OF TOP 10 KEY PLAYERS
FIGURE 55.AGILENT TECHNOLOGIES INC.: NET SALES ,($MILLION)
FIGURE 56.F HOFFMAN LA ROCHE.: NET SALES ,($MILLION)
FIGURE 57.MERCK KGAA.: NET SALES ,($MILLION)
FIGURE 58.BIO RAD LABORATORIES.: NET SALES ,($MILLION)
FIGURE 59.THERMOFISCHER SCIENTIFIC INC.: NET SALES ,($MILLION)
FIGURE 60.QIAGEN.: NET SALES ,($MILLION)
FIGURE 61.PERKIN ELMER.: NET SALES ,($MILLION)
FIGURE 62.CHARLES RIVER LABORATORIES INTERNATIONAL, INC..: NET SALES ,($MILLION)
FIGURE 63.SIEMENS HEALTHINEERS.: NET SALES ,($MILLION)
FIGURE 64.EUROFINS SCIENTIFIC, INC..: NET SALES ,($MILLION
SELECT A FORMAT
Added to Cart
Electronic (PDF)

$6090

This license allows only one user to access the PDF.
Electronic (PDF)

$6630

This license allows 1 - 5 user to access the PDF, license is suitable for small groups of 5 users working together
Electronic (PDF)

$10500

This license allows users/teams in a same Enterprise to use this report, various departments within an enterpise can use this report
Electronic (PDF)

$4380

This license just provides quantitative data in a excel sheet
Add to Cart
Buy Now (15% Discount)

OUR CUSTOMER

Bioinformatics Barcelona

SIMILAR REPORTS