0
  • Category
  • Region
U.S. (TOLL FREE)
+1 (315) 215-3225
0
U.S. (TOLL FREE)
+1 (315) 215-3225
Ambient Intelligence Market By Component (Hardware, Software, Service), By Technology (Bluetooth Low Energy, RFID, Ambient Light Sensor, Software Agents, Affective Computing, Biometrics, Others), By End User (Residential, Retail, Healthcare, Office Building, Automotive, Others): Global Opportunity Analysis and Industry Forecast, 2023-2032
Published Date: September 2023
|
Report Code: ALLI-Auto-4W582
Home | Market Reports | Computers & Electronics
Ambient Intelligence Market By Component Hardware Software Service By Technology Bluetooth Low Energy RFID Ambient Light Sensor Software Agents Affective Computing Biometrics Others By End User Residential Retail Healthcare Office Building Automotive Others Global Opportunity Analysis and Industry Forecast 2023 2032
BUY CHAPTERS

Ambient Intelligence Market By Component (Hardware, Software, Service), By Technology (Bluetooth Low Energy, RFID, Ambient Light Sensor, Software Agents, Affective Computing, Biometrics, Others), By End User (Residential, Retail, Healthcare, Office Building, Automotive, Others): Global Opportunity Analysis and Industry Forecast, 2023-2032

Code: ALLI-Auto-4W582
Report
September 2023
Pages:429
Allied Market Research
Buy Now with 15% Discount
DESCRIPTION
TABLE OF CONTENT
TABLES & FIGURES

Ambient Intelligence Market Size

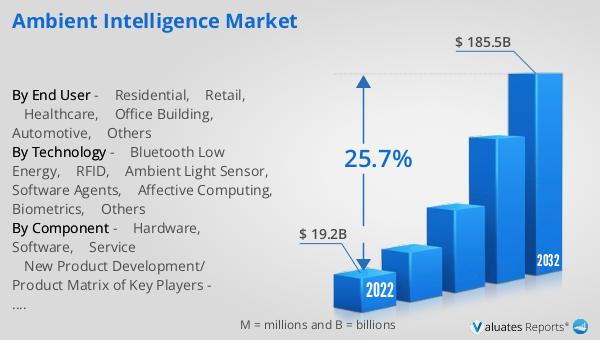
According to a new report published by , titled, “Ambient Intelligence Market," The ambient intelligence market was valued at $19.2 billion in 2022, and is estimated to reach $185.5 billion by 2032, growing at a CAGR of 25.7% from 2023 to 2032.

Ambient Intelligence Market

Ambient intelligence refers to a pervasive and responsive environment that leverages sensors, artificial intelligence, and connectivity to enhance user experiences and automate tasks seamlessly. The main use of ambient intelligence is to create smart, context-aware environments that can anticipate and respond to the needs of individuals or groups of people without requiring explicit commands or interactions. 

The major factors driving the growth of the ambient intelligence market include the increase in adoption of smart homes & the development of connected and autonomous vehicles. Smart home appliances are gaining popularity due to their convenience, efficiency, and security. These devices are widely used in residential systems to perform tasks such as heat regulation, lighting control, and switching on/off electronic devices. In addition, increase in demand for smart healthcare devices is considered an important factor to boost the ambient intelligence market. However, higher implementation cost and the concern about privacy and security are expected to hamper market growth. Deploying ambient intelligence technology requires a large upfront investment and can be prohibitively expensive for many businesses. Implementing ambient intelligence systems often requires a substantial upfront capital investment. This includes the cost of sensors, connectivity infrastructure, software development, and integration with existing systems. For businesses and homeowners, this financial commitment can be a barrier to entry. On the contrary, rise in development of advanced sensors contribute significantly to the growth of the ambient intelligence market. Advanced sensors are equipped with greater accuracy and sensitivity, which allows them to capture of more environmental data. This consists information on temperature, humidity, air quality, lighting conditions and sound levels. This enhanced perception capability is essential for ambient intelligence systems to create more responsive and adaptive environments.

The report focuses on growth prospects, restraints, and trends of the ambient intelligence market analysis. The study provides Porter’s five forces analysis to understand the impact of various factors, such as bargaining power of suppliers, competitive intensity of competitors, threat of new entrants, threat of substitutes, and bargaining power of buyers, on the ambient intelligence market.

The ambient intelligence market is segmented into Component, Technology and End User.

Segment Review

The ambient intelligence market is segmented on the basis of component, technology, end user, and region. On the basis of component, the market is categorized into hardware, software, and service. On the basis of technology, the market is divided into bluetooth low energy, RFID, ambient light sensor, software agents, affective computing, biometrics, and others. On the basis of end user, it is divided into residential, retail, healthcare, office building, automotive, and others. On the basis of region, it is analysed across North America, Europe, Asia-Pacific, and LAMEA.

On the basis of technology, the affective computing segment attained the highest ambient intelligence market size in 2022, because consumers are increasingly looking for personalized experiences, and affective computing can help to create more tailored experiences based on individual preferences and emotional states.

On the basis of region, North America held the highest ambient intelligence market share in 2022, owing to factors such as the presence large number of key players of ambient intelligence vendors in the country, early adoption of advanced technologies, and considerable digitalization across various sectors in the region.

The report analyzes the profiles of key players operating in the ambient intelligence market such as Schneider Electric S.E., Siemens AG, ABB Group, Johnson Controls, Infosys, Honeywell International, Inc., BioIntelliSense, Inc., Nuance Communications, Inc., Eyeris Technologies, Inc., and Accel Robotics. These players have adopted various strategies to increase their market penetration and strengthen their position in the ambient intelligence market.

Market Landscape and Trends

The ambient intelligence market is expanding due to the growing demand for sustainable and energy-efficient solutions. The technology uses sensors and sophisticated computing to create a more sustainable environment and reduce energy. Eco-friendly technologies provide comprehensive answers to problems of sustainability and environmental degradation through energy efficiency and resource efficiency reduction, and the development of the Internet of Things played an important role in environmental intelligence. The proliferation of IoT devices and the development of improved connectivity solutions such as 5G have contributed to the expansion of AmI applications. Furthermore, governments across the globe are investing heavily in ambient intelligence, while increasing adoption of nanotechnologies, smart technologies and autonomous cars are all contributing to the expansion of the market, which is expected to propel the market growth during the forecast period.

Top Impacting Factors

Increase in demand for smart healthcare devices 

Smart health devices are becoming popular, owing to their ability to provide real-time health information to users. These devices monitor heart rate, blood pressure, temperature, and other vital signs and can be monitored remotely. This allows timely detection of any changes in health and enables timely medical intervention when needed. In addition, the COVID-19 pandemic accelerated the adoption of remote patient monitoring (RPM). Smart healthcare devices enable healthcare providers to remotely track patients' vital signs, chronic conditions, and post-operative recovery, reducing hospital readmissions and improving patient outcomes. Furthermore, growing interest in health and fitness drives the demand for wearable smart devices. Consumers are using these devices to track their physical activity, sleep patterns, and nutrition, leading to a more health-conscious life. Moreover, regulatory agencies are increasingly recognizing the value and safety of smart healthcare devices. This support is encouraging innovation in the healthcare technology sector and boosting investor confidence. Therefore, increase in demand for smart healthcare devices drives the growth of the ambient intelligence industry. 

Development of connected and autonomous vehicles

Autonomous vehicles are designed to prioritize safety and efficiency. They rely on ambient intelligence systems to navigate and interact with their environment. These systems can communicate with other vehicles, delivering traffic management systems that create a safer and more accurate travel environment.  In addition, businesses and logistics companies are increasingly adopting CAVs for transportation and delivery services. Ambient intelligence plays a crucial role in optimizing fleet management, ensuring on-time deliveries, and reducing operational costs through real-time tracking and route optimization. Further, as CAV technology matures and gains public trust, more people will embrace the concept of autonomous transportation. This increase in acceptance is expected to drive the demand for ambient intelligence systems that enhance the safety and convenience of connected and autonomous vehicles.   

Increase in adoption of smart homes and buildings

Smart home appliances are gaining popularity due to their convenience, efficiency, and security. These devices are widely used in residential systems for functions such as heat regulation, lighting control, and switching electronic devices. In addition, ambient intelligence enhances the user experience in smart homes and buildings by creating personalized and responsive environments. For instance, based on user preferences and patterns, ambient intelligence can adjust lighting, heating, and entertainment systems to create a more comfortable and convenient space. Furthermore, ambient intelligence leverages data from sensors and devices to predict when maintenance or repairs are needed. This proactive approach reduces downtime, extends the lifespan of equipment, and minimizes operational disruptions. This growing demand for smart home appliances drives the growth of the ambient intelligence industry.  

Higher implementation cost and concerns about privacy and security

Deploying ambient intelligence technology requires a large upfront investment and can be prohibitively expensive for many businesses. Implementing ambient intelligence systems often requires a substantial upfront capital investment. This includes the cost of sensors, connectivity infrastructure, software development, and integration with existing systems. For businesses and homeowners, this financial commitment can be a barrier to entry. Moreover, retrofitting existing buildings with ambient intelligence technologies can be costlier than incorporating them during the initial construction phase. This retrofit cost discourages building owners from adopting these solutions, especially for older structures. Furthermore, ambient intelligence systems can become targets for cyberattacks. Unauthorized access to data or control of smart devices can result in data breaches, privacy violations, and even physical security risks. In addition, security breaches or privacy violations can severely damage the reputation of companies that provide ambient intelligence solutions. This can result in legal consequences and a loss of customer trust.

Rise in adoption of big data analytics

Big data analytics empowers ambient intelligence systems to make informed, data-driven decisions. By processing and analyzing the massive amounts of data generated by smart sensors, devices, and IoT infrastructure, ambient intelligence systems can optimize various aspects of the environment, such as energy usage, security, and user experience. Moreover, big data analytics enables real-time monitoring of ambient intelligence systems. It can quickly identify anomalies, trends, and patterns in data, allowing for immediate responses to changes in the environment. For instance, in a smart building, real-time analytics can adjust heating and cooling systems based on occupancy and external weather conditions. In addition, big data analytics plays a pivotal role in personalizing user experiences in smart environments. It can analyze user behavior, preferences, and usage patterns to tailor lighting, climate control, and other settings to individual preferences, enhancing comfort and satisfaction. Furthermore, businesses and organizations benefit from improved operational efficiency and cost savings through big data analytics in ambient intelligence. By optimizing processes, resource usage, and workflows, companies can reduce expenses and enhance competitiveness. Thus, all these factors are expected to provide lucrative opportunities for the growth of the market. 

Rise in development of advanced sensors

Advanced sensors are equipped with greater accuracy and sensitivity, which allows them to capture of more environmental data. This consists information on temperature, humidity, air quality, lighting conditions, and sound levels. This enhanced perception capability is essential for ambient intelligence systems to create more responsive and adaptive environments. In addition, advanced sensors often support multiple sensing modalities in a single device. For instance, a sensor can combine temperature, humidity, and motion detection. This multimodal sensing provides a comprehensive view of the environment, enabling better control and decision-making. Moreover, many advanced sensors are equipped with wireless communication capabilities, such as Bluetooth and Wi-Fi. This wireless connectivity simplifies the deployment of ambient intelligence systems and facilitates data transmission to central processing units. Therefore, these trends are expected to drive ambient intelligence market growth. 

Scope of Ambient Intelligence Market Report

Report Metric Details
Report Name Ambient Intelligence Market
Accounted market size in 2022 $ 19.2 in billion
Forecasted market size in 2032 $ 185.5 billion
CAGR 25.7%
Base Year 2022
Forecasted years 2024 - 2032
● Upcoming/New Entrant by Regions ● Technology Trend Analysis
By Component ● Hardware
● Software
● Service
By Technology ● Bluetooth Low Energy
● RFID
● Ambient Light Sensor
● Software Agents
● Affective Computing
● Biometrics
● Others
By End User ● Residential
● Retail
● Healthcare
● Office Building
● Automotive
● Others
By Region
  • North America (United States, Canada)
  • Europe (Germany, France, UK, Italy, Russia) Rest of Europe
  • Nordic Countries
  • Asia-Pacific (China, Japan, South Korea)
  • Southeast Asia (India, Australia)
  • Rest of Asia
  • Latin America (Mexico, Brazil)
  • Rest of Latin America
  • Middle East & Africa (Turkey, Saudi Arabia, UAE, Rest of MEA)
● New Product Development/ Product Matrix of Key Players Schneider Electric, Accel Robotics, Johnson Controls, Eyeris Technologies, Inc., Honeywell International, Inc., BioIntelliSense, Inc., Infosys, Siemens AG, ABB Group, Nuance Communications, Inc.
Forecast units USD million in value
Report coverage Revenue and volume forecast, company share, competitive landscape, growth factors and trends

FAQ for this report

How fast is Ambient Intelligence Market growing?

Ans: The Ambient Intelligence Market witnessing a CAGR of 25.7% during the forecast period 2024-2032.

What is the Ambient Intelligence Market size in 2032?

Ans: The Ambient Intelligence Market size in 2032 will be $ 185.5 billion.

Who are the main players in the Ambient Intelligence Market report?

Ans: The main players in the Ambient Intelligence Market are ● Regulatory Guidelines, ● Additional company profiles with specific to client's interest, ● Additional country or region analysis- market size and forecast, ● Key player details (including location, contact details, supplier/vendor network etc. in excel format), ● SWOT Analysis, Key Market Segments

What are the End User segmentation covered in the Ambient Intelligence Market report?

Ans: The End users covered in the Ambient Intelligence Market report are ● Residential, ● Retail, ● Healthcare, ● Office Building, ● Automotive, ● Others

CHAPTER 1: INTRODUCTION
1.1. Report description
1.2. Key market segments
1.3. Key benefits to the stakeholders
1.4. Research methodology
1.4.1. Primary research
1.4.2. Secondary research
1.4.3. Analyst tools and models
CHAPTER 2: EXECUTIVE SUMMARY
2.1. CXO Perspective
CHAPTER 3: MARKET OVERVIEW
3.1. Market definition and scope
3.2. Key findings
3.2.1. Top impacting factors
3.2.2. Top investment pockets
3.3. Porter’s five forces analysis
3.3.1. Low bargaining power of suppliers
3.3.2. Low threat of new entrants
3.3.3. Low threat of substitutes
3.3.4. Low intensity of rivalry
3.3.5. Low bargaining power of buyers
3.4. Market dynamics
3.4.1. Drivers
3.4.1.1. Increase in demand for smart healthcare devices
3.4.1.2. Development of connected and autonomous vehicles
3.4.1.3. Increase in adoption of smart homes and buildings
3.4.2. Restraints
3.4.2.1. Higher implementation cost and concerns about privacy and security
3.4.3. Opportunities
3.4.3.1. Rise in adoption of big data analytics
3.4.3.2. Rise in development of advanced sensors
CHAPTER 4: AMBIENT INTELLIGENCE MARKET, BY COMPONENT
4.1. Overview
4.1.1. Market size and forecast
4.2. Hardware
4.2.1. Key market trends, growth factors and opportunities
4.2.2. Market size and forecast, by region
4.2.3. Market share analysis by country
4.3. Software
4.3.1. Key market trends, growth factors and opportunities
4.3.2. Market size and forecast, by region
4.3.3. Market share analysis by country
4.4. Service
4.4.1. Key market trends, growth factors and opportunities
4.4.2. Market size and forecast, by region
4.4.3. Market share analysis by country
CHAPTER 5: AMBIENT INTELLIGENCE MARKET, BY TECHNOLOGY
5.1. Overview
5.1.1. Market size and forecast
5.2. Bluetooth Low Energy
5.2.1. Key market trends, growth factors and opportunities
5.2.2. Market size and forecast, by region
5.2.3. Market share analysis by country
5.3. RFID
5.3.1. Key market trends, growth factors and opportunities
5.3.2. Market size and forecast, by region
5.3.3. Market share analysis by country
5.4. Ambient Light Sensor
5.4.1. Key market trends, growth factors and opportunities
5.4.2. Market size and forecast, by region
5.4.3. Market share analysis by country
5.5. Software Agents
5.5.1. Key market trends, growth factors and opportunities
5.5.2. Market size and forecast, by region
5.5.3. Market share analysis by country
5.6. Affective Computing
5.6.1. Key market trends, growth factors and opportunities
5.6.2. Market size and forecast, by region
5.6.3. Market share analysis by country
5.7. Biometrics
5.7.1. Key market trends, growth factors and opportunities
5.7.2. Market size and forecast, by region
5.7.3. Market share analysis by country
5.8. Others
5.8.1. Key market trends, growth factors and opportunities
5.8.2. Market size and forecast, by region
5.8.3. Market share analysis by country
CHAPTER 6: AMBIENT INTELLIGENCE MARKET, BY END USER
6.1. Overview
6.1.1. Market size and forecast
6.2. Residential
6.2.1. Key market trends, growth factors and opportunities
6.2.2. Market size and forecast, by region
6.2.3. Market share analysis by country
6.3. Retail
6.3.1. Key market trends, growth factors and opportunities
6.3.2. Market size and forecast, by region
6.3.3. Market share analysis by country
6.4. Healthcare
6.4.1. Key market trends, growth factors and opportunities
6.4.2. Market size and forecast, by region
6.4.3. Market share analysis by country
6.5. Office Building
6.5.1. Key market trends, growth factors and opportunities
6.5.2. Market size and forecast, by region
6.5.3. Market share analysis by country
6.6. Automotive
6.6.1. Key market trends, growth factors and opportunities
6.6.2. Market size and forecast, by region
6.6.3. Market share analysis by country
6.7. Others
6.7.1. Key market trends, growth factors and opportunities
6.7.2. Market size and forecast, by region
6.7.3. Market share analysis by country
CHAPTER 7: AMBIENT INTELLIGENCE MARKET, BY REGION
7.1. Overview
7.1.1. Market size and forecast By Region
7.2. North America
7.2.1. Key market trends, growth factors and opportunities
7.2.2. Market size and forecast, by Component
7.2.3. Market size and forecast, by Technology
7.2.4. Market size and forecast, by End User
7.2.5. Market size and forecast, by country
7.2.5.1. U.S.
7.2.5.1.1. Market size and forecast, by Component
7.2.5.1.2. Market size and forecast, by Technology
7.2.5.1.3. Market size and forecast, by End User
7.2.5.2. Canada
7.2.5.2.1. Market size and forecast, by Component
7.2.5.2.2. Market size and forecast, by Technology
7.2.5.2.3. Market size and forecast, by End User
7.3. Europe
7.3.1. Key market trends, growth factors and opportunities
7.3.2. Market size and forecast, by Component
7.3.3. Market size and forecast, by Technology
7.3.4. Market size and forecast, by End User
7.3.5. Market size and forecast, by country
7.3.5.1. UK
7.3.5.1.1. Market size and forecast, by Component
7.3.5.1.2. Market size and forecast, by Technology
7.3.5.1.3. Market size and forecast, by End User
7.3.5.2. Germany
7.3.5.2.1. Market size and forecast, by Component
7.3.5.2.2. Market size and forecast, by Technology
7.3.5.2.3. Market size and forecast, by End User
7.3.5.3. France
7.3.5.3.1. Market size and forecast, by Component
7.3.5.3.2. Market size and forecast, by Technology
7.3.5.3.3. Market size and forecast, by End User
7.3.5.4. Italy
7.3.5.4.1. Market size and forecast, by Component
7.3.5.4.2. Market size and forecast, by Technology
7.3.5.4.3. Market size and forecast, by End User
7.3.5.5. Spain
7.3.5.5.1. Market size and forecast, by Component
7.3.5.5.2. Market size and forecast, by Technology
7.3.5.5.3. Market size and forecast, by End User
7.3.5.6. Rest of Europe
7.3.5.6.1. Market size and forecast, by Component
7.3.5.6.2. Market size and forecast, by Technology
7.3.5.6.3. Market size and forecast, by End User
7.4. Asia-Pacific
7.4.1. Key market trends, growth factors and opportunities
7.4.2. Market size and forecast, by Component
7.4.3. Market size and forecast, by Technology
7.4.4. Market size and forecast, by End User
7.4.5. Market size and forecast, by country
7.4.5.1. China
7.4.5.1.1. Market size and forecast, by Component
7.4.5.1.2. Market size and forecast, by Technology
7.4.5.1.3. Market size and forecast, by End User
7.4.5.2. Japan
7.4.5.2.1. Market size and forecast, by Component
7.4.5.2.2. Market size and forecast, by Technology
7.4.5.2.3. Market size and forecast, by End User
7.4.5.3. India
7.4.5.3.1. Market size and forecast, by Component
7.4.5.3.2. Market size and forecast, by Technology
7.4.5.3.3. Market size and forecast, by End User
7.4.5.4. Australia
7.4.5.4.1. Market size and forecast, by Component
7.4.5.4.2. Market size and forecast, by Technology
7.4.5.4.3. Market size and forecast, by End User
7.4.5.5. South Korea
7.4.5.5.1. Market size and forecast, by Component
7.4.5.5.2. Market size and forecast, by Technology
7.4.5.5.3. Market size and forecast, by End User
7.4.5.6. Rest of Asia-Pacific
7.4.5.6.1. Market size and forecast, by Component
7.4.5.6.2. Market size and forecast, by Technology
7.4.5.6.3. Market size and forecast, by End User
7.5. LAMEA
7.5.1. Key market trends, growth factors and opportunities
7.5.2. Market size and forecast, by Component
7.5.3. Market size and forecast, by Technology
7.5.4. Market size and forecast, by End User
7.5.5. Market size and forecast, by country
7.5.5.1. Latin America
7.5.5.1.1. Market size and forecast, by Component
7.5.5.1.2. Market size and forecast, by Technology
7.5.5.1.3. Market size and forecast, by End User
7.5.5.2. Middle East
7.5.5.2.1. Market size and forecast, by Component
7.5.5.2.2. Market size and forecast, by Technology
7.5.5.2.3. Market size and forecast, by End User
7.5.5.3. Africa
7.5.5.3.1. Market size and forecast, by Component
7.5.5.3.2. Market size and forecast, by Technology
7.5.5.3.3. Market size and forecast, by End User
CHAPTER 8: COMPETITIVE LANDSCAPE
8.1. Introduction
8.2. Top winning strategies
8.3. Product mapping of top 10 player
8.4. Competitive dashboard
8.5. Competitive heatmap
8.6. Top player positioning, 2022
CHAPTER 9: COMPANY PROFILES
9.1. Schneider Electric
9.1.1. Company overview
9.1.2. Key executives
9.1.3. Company snapshot
9.1.4. Operating business segments
9.1.5. Product portfolio
9.1.6. Business performance
9.1.7. Key strategic moves and developments
9.2. Siemens AG
9.2.1. Company overview
9.2.2. Key executives
9.2.3. Company snapshot
9.2.4. Operating business segments
9.2.5. Product portfolio
9.2.6. Business performance
9.2.7. Key strategic moves and developments
9.3. ABB Group
9.3.1. Company overview
9.3.2. Key executives
9.3.3. Company snapshot
9.3.4. Operating business segments
9.3.5. Product portfolio
9.3.6. Business performance
9.3.7. Key strategic moves and developments
9.4. Johnson Controls
9.4.1. Company overview
9.4.2. Key executives
9.4.3. Company snapshot
9.4.4. Operating business segments
9.4.5. Product portfolio
9.4.6. Business performance
9.4.7. Key strategic moves and developments
9.5. Infosys
9.5.1. Company overview
9.5.2. Key executives
9.5.3. Company snapshot
9.5.4. Operating business segments
9.5.5. Product portfolio
9.5.6. Business performance
9.5.7. Key strategic moves and developments
9.6. Honeywell International, Inc.
9.6.1. Company overview
9.6.2. Key executives
9.6.3. Company snapshot
9.6.4. Operating business segments
9.6.5. Product portfolio
9.6.6. Business performance
9.6.7. Key strategic moves and developments
9.7. BioIntelliSense, Inc.
9.7.1. Company overview
9.7.2. Key executives
9.7.3. Company snapshot
9.7.4. Operating business segments
9.7.5. Product portfolio
9.7.6. Key strategic moves and developments
9.8. Nuance Communications, Inc.
9.8.1. Company overview
9.8.2. Key executives
9.8.3. Company snapshot
9.8.4. Operating business segments
9.8.5. Product portfolio
9.8.6. Business performance
9.8.7. Key strategic moves and developments
9.9. Eyeris Technologies, Inc.
9.9.1. Company overview
9.9.2. Key executives
9.9.3. Company snapshot
9.9.4. Operating business segments
9.9.5. Product portfolio
9.9.6. Key strategic moves and developments
9.10. Accel Robotics
9.10.1. Company overview
9.10.2. Key executives
9.10.3. Company snapshot
9.10.4. Operating business segments
9.10.5. Product portfolio
9.10.6. Key strategic moves and development
LIST OF TABLES
TABLE 01. GLOBAL AMBIENT INTELLIGENCE MARKET, BY COMPONENT, 2022-2032 ($MILLION)
TABLE 02. AMBIENT INTELLIGENCE MARKET FOR HARDWARE, BY REGION, 2022-2032 ($MILLION)
TABLE 03. AMBIENT INTELLIGENCE MARKET FOR SOFTWARE, BY REGION, 2022-2032 ($MILLION)
TABLE 04. AMBIENT INTELLIGENCE MARKET FOR SERVICE, BY REGION, 2022-2032 ($MILLION)
TABLE 05. GLOBAL AMBIENT INTELLIGENCE MARKET, BY TECHNOLOGY, 2022-2032 ($MILLION)
TABLE 06. AMBIENT INTELLIGENCE MARKET FOR BLUETOOTH LOW ENERGY, BY REGION, 2022-2032 ($MILLION)
TABLE 07. AMBIENT INTELLIGENCE MARKET FOR RFID, BY REGION, 2022-2032 ($MILLION)
TABLE 08. AMBIENT INTELLIGENCE MARKET FOR AMBIENT LIGHT SENSOR, BY REGION, 2022-2032 ($MILLION)
TABLE 09. AMBIENT INTELLIGENCE MARKET FOR SOFTWARE AGENTS, BY REGION, 2022-2032 ($MILLION)
TABLE 10. AMBIENT INTELLIGENCE MARKET FOR AFFECTIVE COMPUTING, BY REGION, 2022-2032 ($MILLION)
TABLE 11. AMBIENT INTELLIGENCE MARKET FOR BIOMETRICS, BY REGION, 2022-2032 ($MILLION)
TABLE 12. AMBIENT INTELLIGENCE MARKET FOR OTHERS, BY REGION, 2022-2032 ($MILLION)
TABLE 13. GLOBAL AMBIENT INTELLIGENCE MARKET, BY END USER, 2022-2032 ($MILLION)
TABLE 14. AMBIENT INTELLIGENCE MARKET FOR RESIDENTIAL, BY REGION, 2022-2032 ($MILLION)
TABLE 15. AMBIENT INTELLIGENCE MARKET FOR RETAIL, BY REGION, 2022-2032 ($MILLION)
TABLE 16. AMBIENT INTELLIGENCE MARKET FOR HEALTHCARE, BY REGION, 2022-2032 ($MILLION)
TABLE 17. AMBIENT INTELLIGENCE MARKET FOR OFFICE BUILDING, BY REGION, 2022-2032 ($MILLION)
TABLE 18. AMBIENT INTELLIGENCE MARKET FOR AUTOMOTIVE, BY REGION, 2022-2032 ($MILLION)
TABLE 19. AMBIENT INTELLIGENCE MARKET FOR OTHERS, BY REGION, 2022-2032 ($MILLION)
TABLE 20. AMBIENT INTELLIGENCE MARKET, BY REGION, 2022-2032 ($MILLION)
TABLE 21. NORTH AMERICA AMBIENT INTELLIGENCE MARKET, BY COMPONENT, 2022-2032 ($MILLION)
TABLE 22. NORTH AMERICA AMBIENT INTELLIGENCE MARKET, BY TECHNOLOGY, 2022-2032 ($MILLION)
TABLE 23. NORTH AMERICA AMBIENT INTELLIGENCE MARKET, BY END USER, 2022-2032 ($MILLION)
TABLE 24. NORTH AMERICA AMBIENT INTELLIGENCE MARKET, BY COUNTRY, 2022-2032 ($MILLION)
TABLE 25. U.S. AMBIENT INTELLIGENCE MARKET, BY COMPONENT, 2022-2032 ($MILLION)
TABLE 26. U.S. AMBIENT INTELLIGENCE MARKET, BY TECHNOLOGY, 2022-2032 ($MILLION)
TABLE 27. U.S. AMBIENT INTELLIGENCE MARKET, BY END USER, 2022-2032 ($MILLION)
TABLE 28. CANADA AMBIENT INTELLIGENCE MARKET, BY COMPONENT, 2022-2032 ($MILLION)
TABLE 29. CANADA AMBIENT INTELLIGENCE MARKET, BY TECHNOLOGY, 2022-2032 ($MILLION)
TABLE 30. CANADA AMBIENT INTELLIGENCE MARKET, BY END USER, 2022-2032 ($MILLION)
TABLE 31. EUROPE AMBIENT INTELLIGENCE MARKET, BY COMPONENT, 2022-2032 ($MILLION)
TABLE 32. EUROPE AMBIENT INTELLIGENCE MARKET, BY TECHNOLOGY, 2022-2032 ($MILLION)
TABLE 33. EUROPE AMBIENT INTELLIGENCE MARKET, BY END USER, 2022-2032 ($MILLION)
TABLE 34. EUROPE AMBIENT INTELLIGENCE MARKET, BY COUNTRY, 2022-2032 ($MILLION)
TABLE 35. UK AMBIENT INTELLIGENCE MARKET, BY COMPONENT, 2022-2032 ($MILLION)
TABLE 36. UK AMBIENT INTELLIGENCE MARKET, BY TECHNOLOGY, 2022-2032 ($MILLION)
TABLE 37. UK AMBIENT INTELLIGENCE MARKET, BY END USER, 2022-2032 ($MILLION)
TABLE 38. GERMANY AMBIENT INTELLIGENCE MARKET, BY COMPONENT, 2022-2032 ($MILLION)
TABLE 39. GERMANY AMBIENT INTELLIGENCE MARKET, BY TECHNOLOGY, 2022-2032 ($MILLION)
TABLE 40. GERMANY AMBIENT INTELLIGENCE MARKET, BY END USER, 2022-2032 ($MILLION)
TABLE 41. FRANCE AMBIENT INTELLIGENCE MARKET, BY COMPONENT, 2022-2032 ($MILLION)
TABLE 42. FRANCE AMBIENT INTELLIGENCE MARKET, BY TECHNOLOGY, 2022-2032 ($MILLION)
TABLE 43. FRANCE AMBIENT INTELLIGENCE MARKET, BY END USER, 2022-2032 ($MILLION)
TABLE 44. ITALY AMBIENT INTELLIGENCE MARKET, BY COMPONENT, 2022-2032 ($MILLION)
TABLE 45. ITALY AMBIENT INTELLIGENCE MARKET, BY TECHNOLOGY, 2022-2032 ($MILLION)
TABLE 46. ITALY AMBIENT INTELLIGENCE MARKET, BY END USER, 2022-2032 ($MILLION)
TABLE 47. SPAIN AMBIENT INTELLIGENCE MARKET, BY COMPONENT, 2022-2032 ($MILLION)
TABLE 48. SPAIN AMBIENT INTELLIGENCE MARKET, BY TECHNOLOGY, 2022-2032 ($MILLION)
TABLE 49. SPAIN AMBIENT INTELLIGENCE MARKET, BY END USER, 2022-2032 ($MILLION)
TABLE 50. REST OF EUROPE AMBIENT INTELLIGENCE MARKET, BY COMPONENT, 2022-2032 ($MILLION)
TABLE 51. REST OF EUROPE AMBIENT INTELLIGENCE MARKET, BY TECHNOLOGY, 2022-2032 ($MILLION)
TABLE 52. REST OF EUROPE AMBIENT INTELLIGENCE MARKET, BY END USER, 2022-2032 ($MILLION)
TABLE 53. ASIA-PACIFIC AMBIENT INTELLIGENCE MARKET, BY COMPONENT, 2022-2032 ($MILLION)
TABLE 54. ASIA-PACIFIC AMBIENT INTELLIGENCE MARKET, BY TECHNOLOGY, 2022-2032 ($MILLION)
TABLE 55. ASIA-PACIFIC AMBIENT INTELLIGENCE MARKET, BY END USER, 2022-2032 ($MILLION)
TABLE 56. ASIA-PACIFIC AMBIENT INTELLIGENCE MARKET, BY COUNTRY, 2022-2032 ($MILLION)
TABLE 57. CHINA AMBIENT INTELLIGENCE MARKET, BY COMPONENT, 2022-2032 ($MILLION)
TABLE 58. CHINA AMBIENT INTELLIGENCE MARKET, BY TECHNOLOGY, 2022-2032 ($MILLION)
TABLE 59. CHINA AMBIENT INTELLIGENCE MARKET, BY END USER, 2022-2032 ($MILLION)
TABLE 60. JAPAN AMBIENT INTELLIGENCE MARKET, BY COMPONENT, 2022-2032 ($MILLION)
TABLE 61. JAPAN AMBIENT INTELLIGENCE MARKET, BY TECHNOLOGY, 2022-2032 ($MILLION)
TABLE 62. JAPAN AMBIENT INTELLIGENCE MARKET, BY END USER, 2022-2032 ($MILLION)
TABLE 63. INDIA AMBIENT INTELLIGENCE MARKET, BY COMPONENT, 2022-2032 ($MILLION)
TABLE 64. INDIA AMBIENT INTELLIGENCE MARKET, BY TECHNOLOGY, 2022-2032 ($MILLION)
TABLE 65. INDIA AMBIENT INTELLIGENCE MARKET, BY END USER, 2022-2032 ($MILLION)
TABLE 66. AUSTRALIA AMBIENT INTELLIGENCE MARKET, BY COMPONENT, 2022-2032 ($MILLION)
TABLE 67. AUSTRALIA AMBIENT INTELLIGENCE MARKET, BY TECHNOLOGY, 2022-2032 ($MILLION)
TABLE 68. AUSTRALIA AMBIENT INTELLIGENCE MARKET, BY END USER, 2022-2032 ($MILLION)
TABLE 69. SOUTH KOREA AMBIENT INTELLIGENCE MARKET, BY COMPONENT, 2022-2032 ($MILLION)
TABLE 70. SOUTH KOREA AMBIENT INTELLIGENCE MARKET, BY TECHNOLOGY, 2022-2032 ($MILLION)
TABLE 71. SOUTH KOREA AMBIENT INTELLIGENCE MARKET, BY END USER, 2022-2032 ($MILLION)
TABLE 72. REST OF ASIA-PACIFIC AMBIENT INTELLIGENCE MARKET, BY COMPONENT, 2022-2032 ($MILLION)
TABLE 73. REST OF ASIA-PACIFIC AMBIENT INTELLIGENCE MARKET, BY TECHNOLOGY, 2022-2032 ($MILLION)
TABLE 74. REST OF ASIA-PACIFIC AMBIENT INTELLIGENCE MARKET, BY END USER, 2022-2032 ($MILLION)
TABLE 75. LAMEA AMBIENT INTELLIGENCE MARKET, BY COMPONENT, 2022-2032 ($MILLION)
TABLE 76. LAMEA AMBIENT INTELLIGENCE MARKET, BY TECHNOLOGY, 2022-2032 ($MILLION)
TABLE 77. LAMEA AMBIENT INTELLIGENCE MARKET, BY END USER, 2022-2032 ($MILLION)
TABLE 78. LAMEA AMBIENT INTELLIGENCE MARKET, BY COUNTRY, 2022-2032 ($MILLION)
TABLE 79. LATIN AMERICA AMBIENT INTELLIGENCE MARKET, BY COMPONENT, 2022-2032 ($MILLION)
TABLE 80. LATIN AMERICA AMBIENT INTELLIGENCE MARKET, BY TECHNOLOGY, 2022-2032 ($MILLION)
TABLE 81. LATIN AMERICA AMBIENT INTELLIGENCE MARKET, BY END USER, 2022-2032 ($MILLION)
TABLE 82. MIDDLE EAST AMBIENT INTELLIGENCE MARKET, BY COMPONENT, 2022-2032 ($MILLION)
TABLE 83. MIDDLE EAST AMBIENT INTELLIGENCE MARKET, BY TECHNOLOGY, 2022-2032 ($MILLION)
TABLE 84. MIDDLE EAST AMBIENT INTELLIGENCE MARKET, BY END USER, 2022-2032 ($MILLION)
TABLE 85. AFRICA AMBIENT INTELLIGENCE MARKET, BY COMPONENT, 2022-2032 ($MILLION)
TABLE 86. AFRICA AMBIENT INTELLIGENCE MARKET, BY TECHNOLOGY, 2022-2032 ($MILLION)
TABLE 87. AFRICA AMBIENT INTELLIGENCE MARKET, BY END USER, 2022-2032 ($MILLION)
TABLE 88. SCHNEIDER ELECTRIC: KEY EXECUTIVES
TABLE 89. SCHNEIDER ELECTRIC: COMPANY SNAPSHOT
TABLE 90. SCHNEIDER ELECTRIC: PRODUCT SEGMENTS
TABLE 91. SCHNEIDER ELECTRIC: PRODUCT PORTFOLIO
TABLE 92. SCHNEIDER ELECTRIC: KEY STRATERGIES
TABLE 93. SIEMENS AG: KEY EXECUTIVES
TABLE 94. SIEMENS AG: COMPANY SNAPSHOT
TABLE 95. SIEMENS AG: PRODUCT SEGMENTS
TABLE 96. SIEMENS AG: PRODUCT PORTFOLIO
TABLE 97. SIEMENS AG: KEY STRATERGIES
TABLE 98. ABB GROUP: KEY EXECUTIVES
TABLE 99. ABB GROUP: COMPANY SNAPSHOT
TABLE 100. ABB GROUP: SERVICE SEGMENTS
TABLE 101. ABB GROUP: PRODUCT PORTFOLIO
TABLE 102. ABB GROUP: KEY STRATERGIES
TABLE 103. JOHNSON CONTROLS: KEY EXECUTIVES
TABLE 104. JOHNSON CONTROLS: COMPANY SNAPSHOT
TABLE 105. JOHNSON CONTROLS: SERVICE SEGMENTS
TABLE 106. JOHNSON CONTROLS: PRODUCT PORTFOLIO
TABLE 107. JOHNSON CONTROLS: KEY STRATERGIES
TABLE 108. INFOSYS: KEY EXECUTIVES
TABLE 109. INFOSYS: COMPANY SNAPSHOT
TABLE 110. INFOSYS: PRODUCT SEGMENTS
TABLE 111. INFOSYS: PRODUCT PORTFOLIO
TABLE 112. INFOSYS: KEY STRATERGIES
TABLE 113. HONEYWELL INTERNATIONAL, INC.: KEY EXECUTIVES
TABLE 114. HONEYWELL INTERNATIONAL, INC.: COMPANY SNAPSHOT
TABLE 115. HONEYWELL INTERNATIONAL, INC.: SERVICE SEGMENTS
TABLE 116. HONEYWELL INTERNATIONAL, INC.: PRODUCT PORTFOLIO
TABLE 117. HONEYWELL INTERNATIONAL, INC.: KEY STRATERGIES
TABLE 118. BIOINTELLISENSE, INC.: KEY EXECUTIVES
TABLE 119. BIOINTELLISENSE, INC.: COMPANY SNAPSHOT
TABLE 120. BIOINTELLISENSE, INC.: PRODUCT SEGMENTS
TABLE 121. BIOINTELLISENSE, INC.: PRODUCT PORTFOLIO
TABLE 122. BIOINTELLISENSE, INC.: KEY STRATERGIES
TABLE 123. NUANCE COMMUNICATIONS, INC.: KEY EXECUTIVES
TABLE 124. NUANCE COMMUNICATIONS, INC.: COMPANY SNAPSHOT
TABLE 125. NUANCE COMMUNICATIONS, INC.: PRODUCT SEGMENTS
TABLE 126. NUANCE COMMUNICATIONS, INC.: PRODUCT PORTFOLIO
TABLE 127. NUANCE COMMUNICATIONS, INC.: KEY STRATERGIES
TABLE 128. EYERIS TECHNOLOGIES, INC.: KEY EXECUTIVES
TABLE 129. EYERIS TECHNOLOGIES, INC.: COMPANY SNAPSHOT
TABLE 130. EYERIS TECHNOLOGIES, INC.: SERVICE SEGMENTS
TABLE 131. EYERIS TECHNOLOGIES, INC.: PRODUCT PORTFOLIO
TABLE 132. EYERIS TECHNOLOGIES, INC.: KEY STRATERGIES
TABLE 133. ACCEL ROBOTICS: KEY EXECUTIVES
TABLE 134. ACCEL ROBOTICS: COMPANY SNAPSHOT
TABLE 135. ACCEL ROBOTICS: PRODUCT SEGMENTS
TABLE 136. ACCEL ROBOTICS: PRODUCT PORTFOLIO
TABLE 137. ACCEL ROBOTICS: KEY STRATERGIES LIST OF FIGURES
FIGURE 01. AMBIENT INTELLIGENCE MARKET, 2022-2032
FIGURE 02. SEGMENTATION OF AMBIENT INTELLIGENCE MARKET,2022-2032
FIGURE 03. TOP IMPACTING FACTORS IN AMBIENT INTELLIGENCE MARKET
FIGURE 04. TOP INVESTMENT POCKETS IN AMBIENT INTELLIGENCE MARKET (2023-2032)
FIGURE 05. LOW BARGAINING POWER OF SUPPLIERS
FIGURE 06. LOW THREAT OF NEW ENTRANTS
FIGURE 07. LOW THREAT OF SUBSTITUTES
FIGURE 08. LOW INTENSITY OF RIVALRY
FIGURE 09. LOW BARGAINING POWER OF BUYERS
FIGURE 10. GLOBAL AMBIENT INTELLIGENCE MARKET:DRIVERS, RESTRAINTS AND OPPORTUNITIES
FIGURE 11. AMBIENT INTELLIGENCE MARKET, BY COMPONENT, 2022 AND 2032(%)
FIGURE 12. COMPARATIVE SHARE ANALYSIS OF AMBIENT INTELLIGENCE MARKET FOR HARDWARE, BY COUNTRY 2022 AND 2032(%)
FIGURE 13. COMPARATIVE SHARE ANALYSIS OF AMBIENT INTELLIGENCE MARKET FOR SOFTWARE, BY COUNTRY 2022 AND 2032(%)
FIGURE 14. COMPARATIVE SHARE ANALYSIS OF AMBIENT INTELLIGENCE MARKET FOR SERVICE, BY COUNTRY 2022 AND 2032(%)
FIGURE 15. AMBIENT INTELLIGENCE MARKET, BY TECHNOLOGY, 2022 AND 2032(%)
FIGURE 16. COMPARATIVE SHARE ANALYSIS OF AMBIENT INTELLIGENCE MARKET FOR BLUETOOTH LOW ENERGY, BY COUNTRY 2022 AND 2032(%)
FIGURE 17. COMPARATIVE SHARE ANALYSIS OF AMBIENT INTELLIGENCE MARKET FOR RFID, BY COUNTRY 2022 AND 2032(%)
FIGURE 18. COMPARATIVE SHARE ANALYSIS OF AMBIENT INTELLIGENCE MARKET FOR AMBIENT LIGHT SENSOR, BY COUNTRY 2022 AND 2032(%)
FIGURE 19. COMPARATIVE SHARE ANALYSIS OF AMBIENT INTELLIGENCE MARKET FOR SOFTWARE AGENTS, BY COUNTRY 2022 AND 2032(%)
FIGURE 20. COMPARATIVE SHARE ANALYSIS OF AMBIENT INTELLIGENCE MARKET FOR AFFECTIVE COMPUTING, BY COUNTRY 2022 AND 2032(%)
FIGURE 21. COMPARATIVE SHARE ANALYSIS OF AMBIENT INTELLIGENCE MARKET FOR BIOMETRICS, BY COUNTRY 2022 AND 2032(%)
FIGURE 22. COMPARATIVE SHARE ANALYSIS OF AMBIENT INTELLIGENCE MARKET FOR OTHERS, BY COUNTRY 2022 AND 2032(%)
FIGURE 23. AMBIENT INTELLIGENCE MARKET, BY END USER, 2022 AND 2032(%)
FIGURE 24. COMPARATIVE SHARE ANALYSIS OF AMBIENT INTELLIGENCE MARKET FOR RESIDENTIAL, BY COUNTRY 2022 AND 2032(%)
FIGURE 25. COMPARATIVE SHARE ANALYSIS OF AMBIENT INTELLIGENCE MARKET FOR RETAIL, BY COUNTRY 2022 AND 2032(%)
FIGURE 26. COMPARATIVE SHARE ANALYSIS OF AMBIENT INTELLIGENCE MARKET FOR HEALTHCARE, BY COUNTRY 2022 AND 2032(%)
FIGURE 27. COMPARATIVE SHARE ANALYSIS OF AMBIENT INTELLIGENCE MARKET FOR OFFICE BUILDING, BY COUNTRY 2022 AND 2032(%)
FIGURE 28. COMPARATIVE SHARE ANALYSIS OF AMBIENT INTELLIGENCE MARKET FOR AUTOMOTIVE, BY COUNTRY 2022 AND 2032(%)
FIGURE 29. COMPARATIVE SHARE ANALYSIS OF AMBIENT INTELLIGENCE MARKET FOR OTHERS, BY COUNTRY 2022 AND 2032(%)
FIGURE 30. AMBIENT INTELLIGENCE MARKET BY REGION, 2022 AND 2032(%)
FIGURE 31. U.S. AMBIENT INTELLIGENCE MARKET, 2022-2032 ($MILLION)
FIGURE 32. CANADA AMBIENT INTELLIGENCE MARKET, 2022-2032 ($MILLION)
FIGURE 33. UK AMBIENT INTELLIGENCE MARKET, 2022-2032 ($MILLION)
FIGURE 34. GERMANY AMBIENT INTELLIGENCE MARKET, 2022-2032 ($MILLION)
FIGURE 35. FRANCE AMBIENT INTELLIGENCE MARKET, 2022-2032 ($MILLION)
FIGURE 36. ITALY AMBIENT INTELLIGENCE MARKET, 2022-2032 ($MILLION)
FIGURE 37. SPAIN AMBIENT INTELLIGENCE MARKET, 2022-2032 ($MILLION)
FIGURE 38. REST OF EUROPE AMBIENT INTELLIGENCE MARKET, 2022-2032 ($MILLION)
FIGURE 39. CHINA AMBIENT INTELLIGENCE MARKET, 2022-2032 ($MILLION)
FIGURE 40. JAPAN AMBIENT INTELLIGENCE MARKET, 2022-2032 ($MILLION)
FIGURE 41. INDIA AMBIENT INTELLIGENCE MARKET, 2022-2032 ($MILLION)
FIGURE 42. AUSTRALIA AMBIENT INTELLIGENCE MARKET, 2022-2032 ($MILLION)
FIGURE 43. SOUTH KOREA AMBIENT INTELLIGENCE MARKET, 2022-2032 ($MILLION)
FIGURE 44. REST OF ASIA-PACIFIC AMBIENT INTELLIGENCE MARKET, 2022-2032 ($MILLION)
FIGURE 45. LATIN AMERICA AMBIENT INTELLIGENCE MARKET, 2022-2032 ($MILLION)
FIGURE 46. MIDDLE EAST AMBIENT INTELLIGENCE MARKET, 2022-2032 ($MILLION)
FIGURE 47. AFRICA AMBIENT INTELLIGENCE MARKET, 2022-2032 ($MILLION)
FIGURE 48. TOP WINNING STRATEGIES, BY YEAR (2020-2023)
FIGURE 49. TOP WINNING STRATEGIES, BY DEVELOPMENT (2020-2023)
FIGURE 50. TOP WINNING STRATEGIES, BY COMPANY (2020-2023)
FIGURE 51. PRODUCT MAPPING OF TOP 10 PLAYERS
FIGURE 52. COMPETITIVE DASHBOARD
FIGURE 53. COMPETITIVE HEATMAP: AMBIENT INTELLIGENCE MARKET
FIGURE 54. TOP PLAYER POSITIONING, 2022
FIGURE 55. SCHNEIDER ELECTRIC: NET REVENUE, 2020-2022 ($BILLION)
FIGURE 56. SCHNEIDER ELECTRIC: RESEARCH & DEVELOPMENT EXPENDITURE, 2020-2022 ($MILLION)
FIGURE 57. SCHNEIDER ELECTRIC: REVENUE SHARE BY REGION, 2022 (%)
FIGURE 58. SCHNEIDER ELECTRIC: REVENUE SHARE BY SEGMENT, 2022 (%)
FIGURE 59. SIEMENS AG: NET REVENUE, 2020-2022 ($MILLION)
FIGURE 60. SIEMENS AG: RESEARCH & DEVELOPMENT EXPENDITURE, 2020-2022 ($MILLION)
FIGURE 61. SIEMENS AG: REVENUE SHARE BY SEGMENT, 2022 (%)
FIGURE 62. SIEMENS AG: REVENUE SHARE BY REGION, 2022 (%)
FIGURE 63. ABB GROUP: NET REVENUE, 2020-2022 ($MILLION)
FIGURE 64. ABB GROUP: REVENUE SHARE BY REGION, 2022 (%)
FIGURE 65. JOHNSON CONTROLS: NET REVENUE, 2020-2022 ($MILLION)
FIGURE 66. JOHNSON CONTROLS: RESEARCH & DEVELOPMENT EXPENDITURE, 2020-2022 ($MILLION)
FIGURE 67. JOHNSON CONTROLS: REVENUE SHARE BY SEGMENT, 2022 (%)
FIGURE 68. JOHNSON CONTROLS: REVENUE SHARE BY REGION, 2022 (%)
FIGURE 69. INFOSYS: NET SALES, 2020-2022 ($MILLION)
FIGURE 70. INFOSYS: RESEARCH & DEVELOPMENT EXPENDITURE, 2020-2022 ($MILLION)
FIGURE 71. INFOSYS: REVENUE SHARE BY SEGMENT, 2022 (%)
FIGURE 72. INFOSYS: REVENUE SHARE BY REGION, 2022 (%)
FIGURE 73. HONEYWELL INTERNATIONAL, INC.: NET SALES, 2020-2022 ($MILLION)
FIGURE 74. HONEYWELL INTERNATIONAL, INC.: RESEARCH & DEVELOPMENT EXPENDITURE, 2020-2022 ($MILLION)
FIGURE 75. HONEYWELL INTERNATIONAL, INC.: REVENUE SHARE BY SEGMENT, 2022 (%)
FIGURE 76. HONEYWELL INTERNATIONAL, INC.: REVENUE SHARE BY REGION, 2022 (%)
FIGURE 77. NUANCE COMMUNICATIONS, INC.: NET REVENUE, 2020-2022 ($MILLION)
FIGURE 78. NUANCE COMMUNICATIONS, INC.: RESEARCH & DEVELOPMENT EXPENDITURE, 2020-2022 ($MILLION)
FIGURE 79. NUANCE COMMUNICATIONS, INC.: REVENUE SHARE BY SEGMENT, 2022 (%)
FIGURE 80. NUANCE COMMUNICATIONS, INC.: REVENUE SHARE BY REGION, 2022 (%
SELECT A FORMAT
Added to Cart
Electronic (PDF)

$5730

This license allows only one user to access the PDF.
Electronic (PDF)

$6450

This license allows 1 - 5 user to access the PDF, license is suitable for small groups of 5 users working together
Electronic (PDF)

$9600

This license allows users/teams in a same Enterprise to use this report, various departments within an enterpise can use this report
Electronic (PDF)

$3840

This license just provides quantitative data in a excel sheet
Add to Cart
Buy Now (15% Discount)

OUR CUSTOMER

Accenture

SIMILAR REPORTS


RELATED REPORTS

Global All-In-One (AIO) Liquid Cpu Coolers Market Research Report 2025

120 Pages
Type: Report
Code: QYRE-Auto-18Q8612
Fri Mar 21 00:00:00 UTC 2025

Add to Cart

Global Camera Sales Market Report, Competitive Analysis and Regional Opportunities 2025-2031

120 Pages
Type: Report
Code: QYRE-Auto-22S4164
Fri Mar 21 00:00:00 UTC 2025

Add to Cart

Global Tunneling Magnetoresistance (TMR) Sensors Market Research Report 2025

120 Pages
Type: Report
Code: QYRE-Auto-16C7884
Fri Mar 21 00:00:00 UTC 2025

Add to Cart

Global Wearable Barcode Scanners Market Research Report 2025

120 Pages
Type: Report
Code: QYRE-Auto-11M18715
Fri Mar 21 00:00:00 UTC 2025

Add to Cart