0
U.S. (TOLL FREE)
+1 (315) 215-3225
Automative

0
U.S. (TOLL FREE)
+1 (315) 215-3225
E-Coat Market By Type (Cathodic Epoxy, Cathodic Acrylic, Anodic), By Application (Passenger Cars, Commercial Vehicles, Automotive Parts and Accessories, Heavy-duty Equipment, Others): Global Opportunity Analysis and Industry Forecast, 2023-2032
Published Date: August 2023
|
Report Code: ALLI-Auto-4Z722
Home | Market Reports | Business & Industrial| Chemicals Industry
E Coat Market By Type Cathodic Epoxy Cathodic Acrylic Anodic By Application Passenger Cars Commercial Vehicles Automotive Parts and Accessories Heavy duty Equipment Others Global Opportunity Analysis and Industry Forecast 2023 2032
BUY CHAPTERS

E-Coat Market By Type (Cathodic Epoxy, Cathodic Acrylic, Anodic), By Application (Passenger Cars, Commercial Vehicles, Automotive Parts and Accessories, Heavy-duty Equipment, Others): Global Opportunity Analysis and Industry Forecast, 2023-2032

Code: ALLI-Auto-4Z722
Report
August 2023
Pages:349
Allied Market Research
Buy Now with 15% Discount
DESCRIPTION
TABLE OF CONTENT
TABLES & FIGURES

E-Coat Market Size

According to a new report published by , titled, “E-Coat Market," The e-coat market was valued at $2.3 billion in 2022, and is estimated to reach $3.7 billion by 2032, growing at a CAGR of 5.1% from 2023 to 2032.

E-Coat Market

E-Coat Market

E-coat, short for "electrocoat" or "electrophoretic coating," is a painting or coating process that uses electrical current to deposit a protective layer of paint or other coatings onto a conductive surface. This process is widely used in various industries to provide a uniform and durable finish to metal objects and components. The e-coating process offers numerous advantages, including excellent corrosion resistance, consistent coating thickness, and the ability to coat complex shapes and hard-to-reach areas.
Development and improvement of road networks, highways, and transportation infrastructure contribute to the convenience and accessibility of passenger cars. Better infrastructure encourages car ownership and usage. Passenger cars offer convenience and flexibility, allowing individuals and families to travel comfortably and at their own pace. This is especially important as people seek to balance work, leisure, and family needs. E-coating is employed to protect frame components and suspension parts, such as control arms and stabilizer bars. These parts are critical for the vehicle's performance and safety, and e-coating helps maintain their integrity under varying driving conditions.
Growing population base has led to rapid urbanization in both developed and developing economies such as the U.S., China, India, and others. This has increased government spending on the building & construction sector to develop various upcoming infrastructure projects. For instance, according to a report published by the National Investment Promotion and Facilitation Agency, infrastructure activities accounted for 13% share of the total foreign direct investment (FDI) inflows in 2021. Furthermore, rapid development of water supply, sanitation, urban transport, schools, and healthcare are aiding the growth of the building & construction sector. E-coating is employed in the construction industry for coating metal components used in architectural elements, structural frameworks, and building facades. The corrosion resistance offered by e-coating is especially important in environments where buildings are exposed to harsh weather conditions. These factors are anticipated to fuel the demand for E-coats in the growing building & construction sector.
The initial costs associated with establishing an e-coating facility can be relatively high due to the need for specialized equipment and infrastructure. This can be a barrier for smaller manufacturers or businesses with limited resources. E-coating involves multiple stages, including cleaning, coating deposition, and curing. The curing process, often involving high-temperature ovens, can consume a significant amount of energy, contributing to operational costs and environmental impact. Furthermore, prior e-coating, parts need to go through a thorough cleaning and pre-treatment process to ensure proper adhesion of the coating. This pre-treatment can be complex, involving multiple chemical baths and steps. This factor is projected to hamper the market growth during the forecast period.
Sustainability has become a prominent trend across industries. E-coating is well-positioned to capitalize on this trend due to its lower environmental impact compared to many other coating methods. Manufacturers are increasingly seeking environmentally friendly coating solutions that reduce VOC emissions and minimize waste generation. Furthermore, development of advanced coating formulations, including high-performance primers and clear coats, offers opportunities to enhance the protective qualities of e-coating. These formulations can provide improved corrosion resistance, UV protection, and resistance to harsh chemicals.
The automotive industry is a significant driver for cathodic epoxy-based e-coat. As vehicles continue to evolve, incorporating more advanced materials and designs, the demand for effective corrosion protection becomes even more important. Cathodic epoxy e-coat is well-suited to provide the required level of protection for automotive components. Furthermore, increasing environmental regulations have led industries to seek out more environmentally friendly coating solutions with reduced volatile organic compounds (VOCs) emissions. Cathodic epoxy-based e-coat, being water-based and low in VOCs, aligns well with these regulations.
The E-coat market is segmented on the basis of type, application, and region. On the basis of type, the market is categorized into cathodic epoxy, cathodic acrylic, anodic. On the basis of application, it is divided into passenger cars, commercial vehicles, automotive parts and accessories, heavy duty equipment, and others. Region-wise, the market is studied across North America, Europe, Asia-Pacific, and LAMEA.
The global E-coat market profiles leading players that include PPG Industries, Inc., BASF SE, Nippon Paint Holdings Co., Ltd., Kansai Paint Co., Ltd, AXALTA COATING SYSTEMS, LTD, B.L DOWNEY COMPANY LLC., KCC Corporation, The Sherwin-Williams Company, TATUNG FINE CHEMICALS CO., and Parker Trutec, Inc. The global E-coat market report provides in-depth competitive analysis as well as profiles of these major players.
 The growth drivers, restraints, and opportunities are explained in the report to better understand the market dynamics. This report further highlights the key areas of investment. In addition, it includes Porter’s five forces analysis to understand the competitive scenario of the industry and role of each stakeholder. The report features strategies adopted by key market players to maintain their foothold in the market. Furthermore, it highlights the competitive landscape of key players to increase their market share and sustain intense competition in the industry.  The report covers the strategies adopted by key players in the market to sustain the competitive environment and increase their market share. 

Overview

The global e-coat market was valued at $2.3 billion in 2022, and is projected to reach $3.7 billion by 2032, growing at a CAGR of 5.1% from 2023 to 2032.
E-coat, short for "electrocoat" or "electrophoretic coating," is a painting or coating process that uses electrical current to deposit a protective layer of paint or other coatings onto a conductive surface. This process is widely used in various industries to provide a uniform and durable finish to metal objects and components. The e-coating process offers numerous advantages, including excellent corrosion resistance, consistent coating thickness, and the ability to coat complex shapes and hard-to-reach areas.
E-coat possess favorable properties such as high tensile strength and greater design flexibility, which make it a preferred solution for manufacturers involved in manufacturing automotive components, such as door module, chassis, bumper beams, hoods, wheels, front gearings, and engines. These automotive components are used by original equipment manufacturers (OEMs), which thereby creates high demand in the aftermarket. Use of E-coats results in higher weight saving and improves the fuel economy than the traditional materials such as steel and aluminum. The U.S. Department of Energy (DOE) announced an investment of $19.7 million for the Vehicle Technologies Office to support R&D of advanced vehicle technologies, including batteries and lightweight & low-cost E-coat for the development of energy-efficient automobiles.   Increased demand for eco-friendly and low volatile organic compounds (VOCs) products in vehicles enhances the need for E-coat products in the automotive industry. It is mandatory for vehicle manufacturers to reduce the emission and use of toxic coatings, which can be overcome by use of E-coat products. These factors are expected to drive the market growth in the automotive industry during the forecast period.  
The initial costs associated with establishing an e-coating facility can be relatively high due to the need for specialized equipment and infrastructure. This can be a barrier for smaller manufacturers or businesses with limited resources. E-coating involves multiple stages, including cleaning, coating deposition, and curing. The curing process, often involving high-temperature ovens, can consume a significant amount of energy, contributing to operational costs and environmental impact. Furthermore, prior e-coating, parts need to go through a thorough cleaning and pre-treatment process to ensure proper adhesion of the coating. This pre-treatment can be complex, involving multiple chemical baths and steps. This factor is projected to hamper the market growth during the forecast period.
Sustainability has become a prominent trend across industries. E-coating is well-positioned to capitalize on this trend due to its lower environmental impact compared to many other coating methods. Manufacturers are increasingly seeking environmentally friendly coating solutions that reduce VOC emissions and minimize waste generation. Furthermore, development of advanced coating formulations, including high-performance primers and clear coats, offers opportunities to enhance the protective qualities of e-coating. These formulations can provide improved corrosion resistance, UV protection, and resistance to harsh chemicals.

Key Benefits For Stakeholders

●This report provides a quantitative analysis of the market segments, current trends, estimations, and dynamics of the e-coat market analysis from 2022 to 2032 to identify the prevailing e-coat market opportunities.
●The market research is offered along with information related to key drivers, restraints, and opportunities.
●Porter's five forces analysis highlights the potency of buyers and suppliers to enable stakeholders make profit-oriented business decisions and strengthen their supplier-buyer network.
●In-depth analysis of the e-coat market segmentation assists to determine the prevailing market opportunities.
●Major countries in each region are mapped according to their revenue contribution to the global market.
●Market player positioning facilitates benchmarking and provides a clear understanding of the present position of the market players.
●The report includes the analysis of the regional as well as global e-coat market trends, key players, market segments, application areas, and market growth strategies.

Additional benefits you will get with this purchase are:

● Quarterly Update and* (only available with a corporate license, on listed price)
● 5 additional Company Profile of client Choice pre- or Post-purchase, as a free update.
● Free Upcoming Version on the Purchase of Five and Enterprise User License.
● 16 analyst hours of support* (post-purchase, if you find additional data requirements upon review of the report, you may receive support amounting to 16 analyst hours to solve questions, and post-sale queries)
● 15% Free Customization* (in case the scope or segment of the report does not match your requirements, 20% is equivalent to 3 working days of free work, applicable once)
● Free data Pack on the Five and Enterprise User License. (Excel version of the report)
● Free Updated report if the report is 6-12 months old or older.
● 24-hour priority response*
● Free Industry updates and white papers.
Possible Customization with this report (with additional cost and timeline talk to the sales executive to know more)
● End user preferences and pain points
● Investment Opportunities
● Product Benchmarking / Product specification and applications
● Product Life Cycles
● Patient/epidemiology data at country, region, global level
● Regulatory Guidelines
● Strategic Recommedations
● Key player details (including location, contact details, supplier/vendor network etc. in excel format)
● Per Capita Consumption Trends
● Product Consumption Analysis
● SWOT Analysis
● Volume Market Size and Forecast
Key Market Segments
○ The Sherwin-Williams Compan

Scope of E-Coat Market Report

Report Metric Details
Report Name E-Coat Market
Accounted market size in 2022 $ 2.3 in billion
Forecasted market size in 2032 $ 3.7 billion
CAGR 5.1%
Base Year 2022
Forecasted years 2024 - 2032
By Type ● Cathodic Epoxy
● Cathodic Acrylic
● Anodic
By Application ● Passenger Cars
● Commercial Vehicles
● Automotive Parts and Accessories
● Heavy-duty Equipment
● Others
By Region
  • North America (United States, Canada)
  • Europe (Germany, France, UK, Italy, Russia) Rest of Europe
  • Nordic Countries
  • Asia-Pacific (China, Japan, South Korea)
  • Southeast Asia (India, Australia)
  • Rest of Asia
  • Latin America (Mexico, Brazil)
  • Rest of Latin America
  • Middle East & Africa (Turkey, Saudi Arabia, UAE, Rest of MEA)
Forecast units USD million in value
Report coverage Revenue and volume forecast, company share, competitive landscape, growth factors and trends

FAQ for this report

How fast is E-Coat Market growing?

Ans: The E-Coat Market witnessing a CAGR of 5.1% during the forecast period 2024-2032.

What is the E-Coat Market size in 2032?

Ans: The E-Coat Market size in 2032 will be $ 3.7 billion.

What are the Application segmentation covered in the E-Coat Market report?

Ans: The Applications covered in the E-Coat Market report are ● Passenger Cars, ● Commercial Vehicles, ● Automotive Parts and Accessories, ● Heavy-duty Equipment, ● Others

What are the Type segmentation covered in the E-Coat Market report?

Ans: The Types covered in the E-Coat Market report are ● Cathodic Epoxy, ● Cathodic Acrylic, ● Anodic

CHAPTER 1: INTRODUCTION
1.1. Report description
1.2. Key market segments
1.3. Key benefits to the stakeholders
1.4. Research Methodology
1.4.1. Primary research
1.4.2. Secondary research
1.4.3. Analyst tools and models
CHAPTER 2: EXECUTIVE SUMMARY
2.1. CXO Perspective
CHAPTER 3: MARKET OVERVIEW
3.1. Market definition and scope
3.2. Key findings
3.2.1. Top impacting factors
3.2.2. Top investment pockets
3.3. Porter’s five forces analysis
3.3.1. High bargaining power of suppliers
3.3.2. Moderate threat of new entrants
3.3.3. High threat of substitutes
3.3.4. High intensity of rivalry
3.3.5. High bargaining power of buyers
3.4. Market dynamics
3.4.1. Drivers
3.4.1.1. Increase in penetration of E-coat components in automotive industry
3.4.1.2. Robust demand from building and construction industry
3.4.2. Restraints
3.4.2.1. High cost and complex pre-treatment
3.4.3. Opportunities
3.4.3.1. Green and sustainable coatings and emergence of advance coating formulation
3.5. Value Chain Analysis
3.6. Pricing Analysis
3.7. Key Regulation Analysis
3.8. Patent Landscape
3.9. Regulatory Guidelines
CHAPTER 4: E-COAT MARKET, BY TYPE
4.1. Overview
4.1.1. Market size and forecast
4.2. Cathodic Epoxy
4.2.1. Key market trends, growth factors and opportunities
4.2.2. Market size and forecast, by region
4.2.3. Market share analysis by country
4.3. Cathodic Acrylic
4.3.1. Key market trends, growth factors and opportunities
4.3.2. Market size and forecast, by region
4.3.3. Market share analysis by country
4.4. Anodic
4.4.1. Key market trends, growth factors and opportunities
4.4.2. Market size and forecast, by region
4.4.3. Market share analysis by country
CHAPTER 5: E-COAT MARKET, BY APPLICATION
5.1. Overview
5.1.1. Market size and forecast
5.2. Passenger Cars
5.2.1. Key market trends, growth factors and opportunities
5.2.2. Market size and forecast, by region
5.2.3. Market share analysis by country
5.3. Commercial Vehicles
5.3.1. Key market trends, growth factors and opportunities
5.3.2. Market size and forecast, by region
5.3.3. Market share analysis by country
5.4. Automotive Parts and Accessories
5.4.1. Key market trends, growth factors and opportunities
5.4.2. Market size and forecast, by region
5.4.3. Market share analysis by country
5.5. Heavy-duty Equipment
5.5.1. Key market trends, growth factors and opportunities
5.5.2. Market size and forecast, by region
5.5.3. Market share analysis by country
5.6. Others
5.6.1. Key market trends, growth factors and opportunities
5.6.2. Market size and forecast, by region
5.6.3. Market share analysis by country
CHAPTER 6: E-COAT MARKET, BY REGION
6.1. Overview
6.1.1. Market size and forecast By Region
6.2. North America
6.2.1. Key market trends, growth factors and opportunities
6.2.2. Market size and forecast, by Type
6.2.3. Market size and forecast, by Application
6.2.4. Market size and forecast, by country
6.2.4.1. U.S.
6.2.4.1.1. Market size and forecast, by Type
6.2.4.1.2. Market size and forecast, by Application
6.2.4.2. Canada
6.2.4.2.1. Market size and forecast, by Type
6.2.4.2.2. Market size and forecast, by Application
6.2.4.3. Mexico
6.2.4.3.1. Market size and forecast, by Type
6.2.4.3.2. Market size and forecast, by Application
6.3. Europe
6.3.1. Key market trends, growth factors and opportunities
6.3.2. Market size and forecast, by Type
6.3.3. Market size and forecast, by Application
6.3.4. Market size and forecast, by country
6.3.4.1. Germany
6.3.4.1.1. Market size and forecast, by Type
6.3.4.1.2. Market size and forecast, by Application
6.3.4.2. UK
6.3.4.2.1. Market size and forecast, by Type
6.3.4.2.2. Market size and forecast, by Application
6.3.4.3. France
6.3.4.3.1. Market size and forecast, by Type
6.3.4.3.2. Market size and forecast, by Application
6.3.4.4. Spain
6.3.4.4.1. Market size and forecast, by Type
6.3.4.4.2. Market size and forecast, by Application
6.3.4.5. Italy
6.3.4.5.1. Market size and forecast, by Type
6.3.4.5.2. Market size and forecast, by Application
6.3.4.6. Russia
6.3.4.6.1. Market size and forecast, by Type
6.3.4.6.2. Market size and forecast, by Application
6.3.4.7. Rest of Europe
6.3.4.7.1. Market size and forecast, by Type
6.3.4.7.2. Market size and forecast, by Application
6.4. Asia-Pacific
6.4.1. Key market trends, growth factors and opportunities
6.4.2. Market size and forecast, by Type
6.4.3. Market size and forecast, by Application
6.4.4. Market size and forecast, by country
6.4.4.1. China
6.4.4.1.1. Market size and forecast, by Type
6.4.4.1.2. Market size and forecast, by Application
6.4.4.2. India
6.4.4.2.1. Market size and forecast, by Type
6.4.4.2.2. Market size and forecast, by Application
6.4.4.3. Japan
6.4.4.3.1. Market size and forecast, by Type
6.4.4.3.2. Market size and forecast, by Application
6.4.4.4. South Korea
6.4.4.4.1. Market size and forecast, by Type
6.4.4.4.2. Market size and forecast, by Application
6.4.4.5. Australia
6.4.4.5.1. Market size and forecast, by Type
6.4.4.5.2. Market size and forecast, by Application
6.4.4.6. Thailand
6.4.4.6.1. Market size and forecast, by Type
6.4.4.6.2. Market size and forecast, by Application
6.4.4.7. Indonesia
6.4.4.7.1. Market size and forecast, by Type
6.4.4.7.2. Market size and forecast, by Application
6.4.4.8. Malaysia
6.4.4.8.1. Market size and forecast, by Type
6.4.4.8.2. Market size and forecast, by Application
6.4.4.9. Rest of Asia-Pacific
6.4.4.9.1. Market size and forecast, by Type
6.4.4.9.2. Market size and forecast, by Application
6.5. LAMEA
6.5.1. Key market trends, growth factors and opportunities
6.5.2. Market size and forecast, by Type
6.5.3. Market size and forecast, by Application
6.5.4. Market size and forecast, by country
6.5.4.1. Brazil
6.5.4.1.1. Market size and forecast, by Type
6.5.4.1.2. Market size and forecast, by Application
6.5.4.2. Saudi Arabia
6.5.4.2.1. Market size and forecast, by Type
6.5.4.2.2. Market size and forecast, by Application
6.5.4.3. South Africa
6.5.4.3.1. Market size and forecast, by Type
6.5.4.3.2. Market size and forecast, by Application
6.5.4.4. Argentina
6.5.4.4.1. Market size and forecast, by Type
6.5.4.4.2. Market size and forecast, by Application
6.5.4.5. UAE
6.5.4.5.1. Market size and forecast, by Type
6.5.4.5.2. Market size and forecast, by Application
6.5.4.6. Rest of LAMEA
6.5.4.6.1. Market size and forecast, by Type
6.5.4.6.2. Market size and forecast, by Application
CHAPTER 7: COMPETITIVE LANDSCAPE
7.1. Introduction
7.2. Top winning strategies
7.3. Product Mapping of Top 10 Player
7.4. Competitive Dashboard
7.5. Competitive Heatmap
7.6. Top player positioning, 2022
CHAPTER 8: COMPANY PROFILES
8.1. PPG Industries, Inc.
8.1.1. Company overview
8.1.2. Key Executives
8.1.3. Company snapshot
8.1.4. Operating business segments
8.1.5. Product portfolio
8.1.6. Business performance
8.2. AXALTA COATING SYSTEMS, LTD
8.2.1. Company overview
8.2.2. Key Executives
8.2.3. Company snapshot
8.2.4. Operating business segments
8.2.5. Product portfolio
8.2.6. Business performance
8.3. BASF SE
8.3.1. Company overview
8.3.2. Key Executives
8.3.3. Company snapshot
8.3.4. Operating business segments
8.3.5. Product portfolio
8.3.6. Business performance
8.4. Nippon Paint Holdings Co., Ltd.
8.4.1. Company overview
8.4.2. Key Executives
8.4.3. Company snapshot
8.4.4. Operating business segments
8.4.5. Product portfolio
8.4.6. Business performance
8.5. The Sherwin-Williams Company
8.5.1. Company overview
8.5.2. Key Executives
8.5.3. Company snapshot
8.5.4. Operating business segments
8.5.5. Product portfolio
8.5.6. Business performance
8.6. KCC CORPORATION.
8.6.1. Company overview
8.6.2. Key Executives
8.6.3. Company snapshot
8.6.4. Operating business segments
8.6.5. Product portfolio
8.6.6. Business performance
8.7. TATUNG FINE CHEMICALS CO.
8.7.1. Company overview
8.7.2. Key Executives
8.7.3. Company snapshot
8.7.4. Operating business segments
8.7.5. Product portfolio
8.8. Kansai Paint Co., Ltd.
8.8.1. Company overview
8.8.2. Key Executives
8.8.3. Company snapshot
8.8.4. Operating business segments
8.8.5. Product portfolio
8.8.6. Business performance
8.9. B.L DOWNEY COMPANY LLC.
8.9.1. Company overview
8.9.2. Key Executives
8.9.3. Company snapshot
8.9.4. Operating business segments
8.9.5. Product portfolio
8.10. Parker Trutec, Inc.
8.10.1. Company overview
8.10.2. Key Executives
8.10.3. Company snapshot
8.10.4. Operating business segments
8.10.5. Product portfoli
LIST OF TABLES
TABLE 01. GLOBAL E-COAT MARKET, BY TYPE, 2022-2032 ($MILLION)
TABLE 02. GLOBAL E-COAT MARKET, BY TYPE, 2022-2032 (TONS)
TABLE 03. E-COAT MARKET FOR CATHODIC EPOXY, BY REGION, 2022-2032 ($MILLION)
TABLE 04. E-COAT MARKET FOR CATHODIC EPOXY, BY REGION, 2022-2032 (TONS)
TABLE 05. E-COAT MARKET FOR CATHODIC ACRYLIC, BY REGION, 2022-2032 ($MILLION)
TABLE 06. E-COAT MARKET FOR CATHODIC ACRYLIC, BY REGION, 2022-2032 (TONS)
TABLE 07. E-COAT MARKET FOR ANODIC, BY REGION, 2022-2032 ($MILLION)
TABLE 08. E-COAT MARKET FOR ANODIC, BY REGION, 2022-2032 (TONS)
TABLE 09. GLOBAL E-COAT MARKET, BY APPLICATION, 2022-2032 ($MILLION)
TABLE 10. GLOBAL E-COAT MARKET, BY APPLICATION, 2022-2032 (TONS)
TABLE 11. E-COAT MARKET FOR PASSENGER CARS, BY REGION, 2022-2032 ($MILLION)
TABLE 12. E-COAT MARKET FOR PASSENGER CARS, BY REGION, 2022-2032 (TONS)
TABLE 13. E-COAT MARKET FOR COMMERCIAL VEHICLES, BY REGION, 2022-2032 ($MILLION)
TABLE 14. E-COAT MARKET FOR COMMERCIAL VEHICLES, BY REGION, 2022-2032 (TONS)
TABLE 15. E-COAT MARKET FOR AUTOMOTIVE PARTS AND ACCESSORIES, BY REGION, 2022-2032 ($MILLION)
TABLE 16. E-COAT MARKET FOR AUTOMOTIVE PARTS AND ACCESSORIES, BY REGION, 2022-2032 (TONS)
TABLE 17. E-COAT MARKET FOR HEAVY-DUTY EQUIPMENT, BY REGION, 2022-2032 ($MILLION)
TABLE 18. E-COAT MARKET FOR HEAVY-DUTY EQUIPMENT, BY REGION, 2022-2032 (TONS)
TABLE 19. E-COAT MARKET FOR OTHERS, BY REGION, 2022-2032 ($MILLION)
TABLE 20. E-COAT MARKET FOR OTHERS, BY REGION, 2022-2032 (TONS)
TABLE 21. E-COAT MARKET, BY REGION, 2022-2032 ($MILLION)
TABLE 22. E-COAT MARKET, BY REGION, 2022-2032 (TONS)
TABLE 23. NORTH AMERICA E-COAT MARKET, BY TYPE, 2022-2032 ($MILLION)
TABLE 24. NORTH AMERICA E-COAT MARKET, BY TYPE, 2022-2032 (TONS)
TABLE 25. NORTH AMERICA E-COAT MARKET, BY APPLICATION, 2022-2032 ($MILLION)
TABLE 26. NORTH AMERICA E-COAT MARKET, BY APPLICATION, 2022-2032 (TONS)
TABLE 27. NORTH AMERICA E-COAT MARKET, BY COUNTRY, 2022-2032 ($MILLION)
TABLE 28. NORTH AMERICA E-COAT MARKET, BY COUNTRY, 2022-2032 (TONS)
TABLE 29. U.S. E-COAT MARKET, BY TYPE, 2022-2032 ($MILLION)
TABLE 30. U.S. E-COAT MARKET, BY TYPE, 2022-2032 (TONS)
TABLE 31. U.S. E-COAT MARKET, BY APPLICATION, 2022-2032 ($MILLION)
TABLE 32. U.S. E-COAT MARKET, BY APPLICATION, 2022-2032 (TONS)
TABLE 33. CANADA E-COAT MARKET, BY TYPE, 2022-2032 ($MILLION)
TABLE 34. CANADA E-COAT MARKET, BY TYPE, 2022-2032 (TONS)
TABLE 35. CANADA E-COAT MARKET, BY APPLICATION, 2022-2032 ($MILLION)
TABLE 36. CANADA E-COAT MARKET, BY APPLICATION, 2022-2032 (TONS)
TABLE 37. MEXICO E-COAT MARKET, BY TYPE, 2022-2032 ($MILLION)
TABLE 38. MEXICO E-COAT MARKET, BY TYPE, 2022-2032 (TONS)
TABLE 39. MEXICO E-COAT MARKET, BY APPLICATION, 2022-2032 ($MILLION)
TABLE 40. MEXICO E-COAT MARKET, BY APPLICATION, 2022-2032 (TONS)
TABLE 41. EUROPE E-COAT MARKET, BY TYPE, 2022-2032 ($MILLION)
TABLE 42. EUROPE E-COAT MARKET, BY TYPE, 2022-2032 (TONS)
TABLE 43. EUROPE E-COAT MARKET, BY APPLICATION, 2022-2032 ($MILLION)
TABLE 44. EUROPE E-COAT MARKET, BY APPLICATION, 2022-2032 (TONS)
TABLE 45. EUROPE E-COAT MARKET, BY COUNTRY, 2022-2032 ($MILLION)
TABLE 46. EUROPE E-COAT MARKET, BY COUNTRY, 2022-2032 (TONS)
TABLE 47. GERMANY E-COAT MARKET, BY TYPE, 2022-2032 ($MILLION)
TABLE 48. GERMANY E-COAT MARKET, BY TYPE, 2022-2032 (TONS)
TABLE 49. GERMANY E-COAT MARKET, BY APPLICATION, 2022-2032 ($MILLION)
TABLE 50. GERMANY E-COAT MARKET, BY APPLICATION, 2022-2032 (TONS)
TABLE 51. UK E-COAT MARKET, BY TYPE, 2022-2032 ($MILLION)
TABLE 52. UK E-COAT MARKET, BY TYPE, 2022-2032 (TONS)
TABLE 53. UK E-COAT MARKET, BY APPLICATION, 2022-2032 ($MILLION)
TABLE 54. UK E-COAT MARKET, BY APPLICATION, 2022-2032 (TONS)
TABLE 55. FRANCE E-COAT MARKET, BY TYPE, 2022-2032 ($MILLION)
TABLE 56. FRANCE E-COAT MARKET, BY TYPE, 2022-2032 (TONS)
TABLE 57. FRANCE E-COAT MARKET, BY APPLICATION, 2022-2032 ($MILLION)
TABLE 58. FRANCE E-COAT MARKET, BY APPLICATION, 2022-2032 (TONS)
TABLE 59. SPAIN E-COAT MARKET, BY TYPE, 2022-2032 ($MILLION)
TABLE 60. SPAIN E-COAT MARKET, BY TYPE, 2022-2032 (TONS)
TABLE 61. SPAIN E-COAT MARKET, BY APPLICATION, 2022-2032 ($MILLION)
TABLE 62. SPAIN E-COAT MARKET, BY APPLICATION, 2022-2032 (TONS)
TABLE 63. ITALY E-COAT MARKET, BY TYPE, 2022-2032 ($MILLION)
TABLE 64. ITALY E-COAT MARKET, BY TYPE, 2022-2032 (TONS)
TABLE 65. ITALY E-COAT MARKET, BY APPLICATION, 2022-2032 ($MILLION)
TABLE 66. ITALY E-COAT MARKET, BY APPLICATION, 2022-2032 (TONS)
TABLE 67. RUSSIA E-COAT MARKET, BY TYPE, 2022-2032 ($MILLION)
TABLE 68. RUSSIA E-COAT MARKET, BY TYPE, 2022-2032 (TONS)
TABLE 69. RUSSIA E-COAT MARKET, BY APPLICATION, 2022-2032 ($MILLION)
TABLE 70. RUSSIA E-COAT MARKET, BY APPLICATION, 2022-2032 (TONS)
TABLE 71. REST OF EUROPE E-COAT MARKET, BY TYPE, 2022-2032 ($MILLION)
TABLE 72. REST OF EUROPE E-COAT MARKET, BY TYPE, 2022-2032 (TONS)
TABLE 73. REST OF EUROPE E-COAT MARKET, BY APPLICATION, 2022-2032 ($MILLION)
TABLE 74. REST OF EUROPE E-COAT MARKET, BY APPLICATION, 2022-2032 (TONS)
TABLE 75. ASIA-PACIFIC E-COAT MARKET, BY TYPE, 2022-2032 ($MILLION)
TABLE 76. ASIA-PACIFIC E-COAT MARKET, BY TYPE, 2022-2032 (TONS)
TABLE 77. ASIA-PACIFIC E-COAT MARKET, BY APPLICATION, 2022-2032 ($MILLION)
TABLE 78. ASIA-PACIFIC E-COAT MARKET, BY APPLICATION, 2022-2032 (TONS)
TABLE 79. ASIA-PACIFIC E-COAT MARKET, BY COUNTRY, 2022-2032 ($MILLION)
TABLE 80. ASIA-PACIFIC E-COAT MARKET, BY COUNTRY, 2022-2032 (TONS)
TABLE 81. CHINA E-COAT MARKET, BY TYPE, 2022-2032 ($MILLION)
TABLE 82. CHINA E-COAT MARKET, BY TYPE, 2022-2032 (TONS)
TABLE 83. CHINA E-COAT MARKET, BY APPLICATION, 2022-2032 ($MILLION)
TABLE 84. CHINA E-COAT MARKET, BY APPLICATION, 2022-2032 (TONS)
TABLE 85. INDIA E-COAT MARKET, BY TYPE, 2022-2032 ($MILLION)
TABLE 86. INDIA E-COAT MARKET, BY TYPE, 2022-2032 (TONS)
TABLE 87. INDIA E-COAT MARKET, BY APPLICATION, 2022-2032 ($MILLION)
TABLE 88. INDIA E-COAT MARKET, BY APPLICATION, 2022-2032 (TONS)
TABLE 89. JAPAN E-COAT MARKET, BY TYPE, 2022-2032 ($MILLION)
TABLE 90. JAPAN E-COAT MARKET, BY TYPE, 2022-2032 (TONS)
TABLE 91. JAPAN E-COAT MARKET, BY APPLICATION, 2022-2032 ($MILLION)
TABLE 92. JAPAN E-COAT MARKET, BY APPLICATION, 2022-2032 (TONS)
TABLE 93. SOUTH KOREA E-COAT MARKET, BY TYPE, 2022-2032 ($MILLION)
TABLE 94. SOUTH KOREA E-COAT MARKET, BY TYPE, 2022-2032 (TONS)
TABLE 95. SOUTH KOREA E-COAT MARKET, BY APPLICATION, 2022-2032 ($MILLION)
TABLE 96. SOUTH KOREA E-COAT MARKET, BY APPLICATION, 2022-2032 (TONS)
TABLE 97. AUSTRALIA E-COAT MARKET, BY TYPE, 2022-2032 ($MILLION)
TABLE 98. AUSTRALIA E-COAT MARKET, BY TYPE, 2022-2032 (TONS)
TABLE 99. AUSTRALIA E-COAT MARKET, BY APPLICATION, 2022-2032 ($MILLION)
TABLE 100. AUSTRALIA E-COAT MARKET, BY APPLICATION, 2022-2032 (TONS)
TABLE 101. THAILAND E-COAT MARKET, BY TYPE, 2022-2032 ($MILLION)
TABLE 102. THAILAND E-COAT MARKET, BY TYPE, 2022-2032 (TONS)
TABLE 103. THAILAND E-COAT MARKET, BY APPLICATION, 2022-2032 ($MILLION)
TABLE 104. THAILAND E-COAT MARKET, BY APPLICATION, 2022-2032 (TONS)
TABLE 105. INDONESIA E-COAT MARKET, BY TYPE, 2022-2032 ($MILLION)
TABLE 106. INDONESIA E-COAT MARKET, BY TYPE, 2022-2032 (TONS)
TABLE 107. INDONESIA E-COAT MARKET, BY APPLICATION, 2022-2032 ($MILLION)
TABLE 108. INDONESIA E-COAT MARKET, BY APPLICATION, 2022-2032 (TONS)
TABLE 109. MALAYSIA E-COAT MARKET, BY TYPE, 2022-2032 ($MILLION)
TABLE 110. MALAYSIA E-COAT MARKET, BY TYPE, 2022-2032 (TONS)
TABLE 111. MALAYSIA E-COAT MARKET, BY APPLICATION, 2022-2032 ($MILLION)
TABLE 112. MALAYSIA E-COAT MARKET, BY APPLICATION, 2022-2032 (TONS)
TABLE 113. REST OF ASIA-PACIFIC E-COAT MARKET, BY TYPE, 2022-2032 ($MILLION)
TABLE 114. REST OF ASIA-PACIFIC E-COAT MARKET, BY TYPE, 2022-2032 (TONS)
TABLE 115. REST OF ASIA-PACIFIC E-COAT MARKET, BY APPLICATION, 2022-2032 ($MILLION)
TABLE 116. REST OF ASIA-PACIFIC E-COAT MARKET, BY APPLICATION, 2022-2032 (TONS)
TABLE 117. LAMEA E-COAT MARKET, BY TYPE, 2022-2032 ($MILLION)
TABLE 118. LAMEA E-COAT MARKET, BY TYPE, 2022-2032 (TONS)
TABLE 119. LAMEA E-COAT MARKET, BY APPLICATION, 2022-2032 ($MILLION)
TABLE 120. LAMEA E-COAT MARKET, BY APPLICATION, 2022-2032 (TONS)
TABLE 121. LAMEA E-COAT MARKET, BY COUNTRY, 2022-2032 ($MILLION)
TABLE 122. LAMEA E-COAT MARKET, BY COUNTRY, 2022-2032 (TONS)
TABLE 123. BRAZIL E-COAT MARKET, BY TYPE, 2022-2032 ($MILLION)
TABLE 124. BRAZIL E-COAT MARKET, BY TYPE, 2022-2032 (TONS)
TABLE 125. BRAZIL E-COAT MARKET, BY APPLICATION, 2022-2032 ($MILLION)
TABLE 126. BRAZIL E-COAT MARKET, BY APPLICATION, 2022-2032 (TONS)
TABLE 127. SAUDI ARABIA E-COAT MARKET, BY TYPE, 2022-2032 ($MILLION)
TABLE 128. SAUDI ARABIA E-COAT MARKET, BY TYPE, 2022-2032 (TONS)
TABLE 129. SAUDI ARABIA E-COAT MARKET, BY APPLICATION, 2022-2032 ($MILLION)
TABLE 130. SAUDI ARABIA E-COAT MARKET, BY APPLICATION, 2022-2032 (TONS)
TABLE 131. SOUTH AFRICA E-COAT MARKET, BY TYPE, 2022-2032 ($MILLION)
TABLE 132. SOUTH AFRICA E-COAT MARKET, BY TYPE, 2022-2032 (TONS)
TABLE 133. SOUTH AFRICA E-COAT MARKET, BY APPLICATION, 2022-2032 ($MILLION)
TABLE 134. SOUTH AFRICA E-COAT MARKET, BY APPLICATION, 2022-2032 (TONS)
TABLE 135. ARGENTINA E-COAT MARKET, BY TYPE, 2022-2032 ($MILLION)
TABLE 136. ARGENTINA E-COAT MARKET, BY TYPE, 2022-2032 (TONS)
TABLE 137. ARGENTINA E-COAT MARKET, BY APPLICATION, 2022-2032 ($MILLION)
TABLE 138. ARGENTINA E-COAT MARKET, BY APPLICATION, 2022-2032 (TONS)
TABLE 139. UAE E-COAT MARKET, BY TYPE, 2022-2032 ($MILLION)
TABLE 140. UAE E-COAT MARKET, BY TYPE, 2022-2032 (TONS)
TABLE 141. UAE E-COAT MARKET, BY APPLICATION, 2022-2032 ($MILLION)
TABLE 142. UAE E-COAT MARKET, BY APPLICATION, 2022-2032 (TONS)
TABLE 143. REST OF LAMEA E-COAT MARKET, BY TYPE, 2022-2032 ($MILLION)
TABLE 144. REST OF LAMEA E-COAT MARKET, BY TYPE, 2022-2032 (TONS)
TABLE 145. REST OF LAMEA E-COAT MARKET, BY APPLICATION, 2022-2032 ($MILLION)
TABLE 146. REST OF LAMEA E-COAT MARKET, BY APPLICATION, 2022-2032 (TONS)
TABLE 147. PPG INDUSTRIES, INC.: KEY EXECUTIVES
TABLE 148. PPG INDUSTRIES, INC.: COMPANY SNAPSHOT
TABLE 149. PPG INDUSTRIES, INC.: SERVICE SEGMENTS
TABLE 150. PPG INDUSTRIES, INC.: PRODUCT PORTFOLIO
TABLE 151. AXALTA COATING SYSTEMS, LTD: KEY EXECUTIVES
TABLE 152. AXALTA COATING SYSTEMS, LTD: COMPANY SNAPSHOT
TABLE 153. AXALTA COATING SYSTEMS, LTD: PRODUCT SEGMENTS
TABLE 154. AXALTA COATING SYSTEMS, LTD: PRODUCT PORTFOLIO
TABLE 155. BASF SE: KEY EXECUTIVES
TABLE 156. BASF SE: COMPANY SNAPSHOT
TABLE 157. BASF SE: PRODUCT SEGMENTS
TABLE 158. BASF SE: PRODUCT PORTFOLIO
TABLE 159. NIPPON PAINT HOLDINGS CO., LTD.: KEY EXECUTIVES
TABLE 160. NIPPON PAINT HOLDINGS CO., LTD.: COMPANY SNAPSHOT
TABLE 161. NIPPON PAINT HOLDINGS CO., LTD.: PRODUCT SEGMENTS
TABLE 162. NIPPON PAINT HOLDINGS CO., LTD.: PRODUCT PORTFOLIO
TABLE 163. THE SHERWIN-WILLIAMS COMPANY: KEY EXECUTIVES
TABLE 164. THE SHERWIN-WILLIAMS COMPANY: COMPANY SNAPSHOT
TABLE 165. THE SHERWIN-WILLIAMS COMPANY: PRODUCT SEGMENTS
TABLE 166. THE SHERWIN-WILLIAMS COMPANY: PRODUCT PORTFOLIO
TABLE 167. KCC CORPORATION.: KEY EXECUTIVES
TABLE 168. KCC CORPORATION.: COMPANY SNAPSHOT
TABLE 169. KCC CORPORATION.: PRODUCT SEGMENTS
TABLE 170. KCC CORPORATION.: PRODUCT PORTFOLIO
TABLE 171. TATUNG FINE CHEMICALS CO.: KEY EXECUTIVES
TABLE 172. TATUNG FINE CHEMICALS CO.: COMPANY SNAPSHOT
TABLE 173. TATUNG FINE CHEMICALS CO.: PRODUCT SEGMENTS
TABLE 174. TATUNG FINE CHEMICALS CO.: PRODUCT PORTFOLIO
TABLE 175. KANSAI PAINT CO., LTD.: KEY EXECUTIVES
TABLE 176. KANSAI PAINT CO., LTD.: COMPANY SNAPSHOT
TABLE 177. KANSAI PAINT CO., LTD.: PRODUCT SEGMENTS
TABLE 178. KANSAI PAINT CO., LTD.: SERVICE SEGMENTS
TABLE 179. KANSAI PAINT CO., LTD.: PRODUCT PORTFOLIO
TABLE 180. B.L DOWNEY COMPANY LLC.: KEY EXECUTIVES
TABLE 181. B.L DOWNEY COMPANY LLC.: COMPANY SNAPSHOT
TABLE 182. B.L DOWNEY COMPANY LLC.: PRODUCT SEGMENTS
TABLE 183. B.L DOWNEY COMPANY LLC.: PRODUCT PORTFOLIO
TABLE 184. PARKER TRUTEC, INC.: KEY EXECUTIVES
TABLE 185. PARKER TRUTEC, INC.: COMPANY SNAPSHOT
TABLE 186. PARKER TRUTEC, INC.: PRODUCT SEGMENTS
TABLE 187. PARKER TRUTEC, INC.: PRODUCT PORTFOLIO LIST OF FIGURES
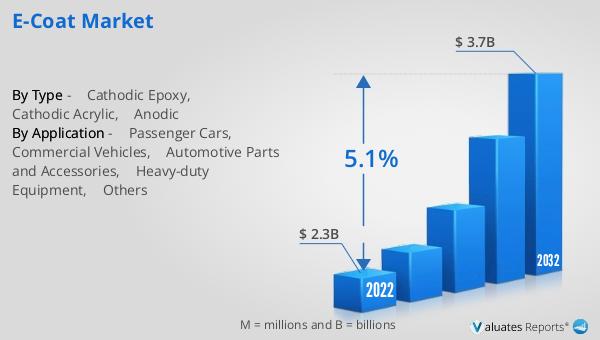
FIGURE 01. E-COAT MARKET, 2022-2032
FIGURE 02. SEGMENTATION OF E-COAT MARKET,2022-2032
FIGURE 03. TOP INVESTMENT POCKETS IN E-COAT MARKET (2023-2032)
FIGURE 04. HIGH BARGAINING POWER OF SUPPLIERS
FIGURE 05. MODERATE THREAT OF NEW ENTRANTS
FIGURE 06. HIGH THREAT OF SUBSTITUTES
FIGURE 07. HIGH INTENSITY OF RIVALRY
FIGURE 08. HIGH BARGAINING POWER OF BUYERS
FIGURE 09. GLOBAL E-COAT MARKET:DRIVERS, RESTRAINTS AND OPPORTUNITIES
FIGURE 10. PRICING ANALYSIS: E-COAT MARKET 2022 AND 2032
FIGURE 11. IMPACT OF KEY REGULATION: E-COAT MARKET
FIGURE 12. PATENT ANALYSIS BY COMPANY
FIGURE 13. PATENT ANALYSIS BY COUNTRY
FIGURE 14. REGULATORY GUIDELINES: E-COAT MARKET
FIGURE 15. E-COAT MARKET, BY TYPE, 2022 AND 2032(%)
FIGURE 16. COMPARATIVE SHARE ANALYSIS OF E-COAT MARKET FOR CATHODIC EPOXY, BY COUNTRY 2022 AND 2032(%)
FIGURE 17. COMPARATIVE SHARE ANALYSIS OF E-COAT MARKET FOR CATHODIC ACRYLIC, BY COUNTRY 2022 AND 2032(%)
FIGURE 18. COMPARATIVE SHARE ANALYSIS OF E-COAT MARKET FOR ANODIC, BY COUNTRY 2022 AND 2032(%)
FIGURE 19. E-COAT MARKET, BY APPLICATION, 2022 AND 2032(%)
FIGURE 20. COMPARATIVE SHARE ANALYSIS OF E-COAT MARKET FOR PASSENGER CARS, BY COUNTRY 2022 AND 2032(%)
FIGURE 21. COMPARATIVE SHARE ANALYSIS OF E-COAT MARKET FOR COMMERCIAL VEHICLES, BY COUNTRY 2022 AND 2032(%)
FIGURE 22. COMPARATIVE SHARE ANALYSIS OF E-COAT MARKET FOR AUTOMOTIVE PARTS AND ACCESSORIES, BY COUNTRY 2022 AND 2032(%)
FIGURE 23. COMPARATIVE SHARE ANALYSIS OF E-COAT MARKET FOR HEAVY-DUTY EQUIPMENT, BY COUNTRY 2022 AND 2032(%)
FIGURE 24. COMPARATIVE SHARE ANALYSIS OF E-COAT MARKET FOR OTHERS, BY COUNTRY 2022 AND 2032(%)
FIGURE 25. E-COAT MARKET BY REGION, 2022 AND 2032(%)
FIGURE 26. U.S. E-COAT MARKET, 2022-2032 ($MILLION)
FIGURE 27. CANADA E-COAT MARKET, 2022-2032 ($MILLION)
FIGURE 28. MEXICO E-COAT MARKET, 2022-2032 ($MILLION)
FIGURE 29. GERMANY E-COAT MARKET, 2022-2032 ($MILLION)
FIGURE 30. UK E-COAT MARKET, 2022-2032 ($MILLION)
FIGURE 31. FRANCE E-COAT MARKET, 2022-2032 ($MILLION)
FIGURE 32. SPAIN E-COAT MARKET, 2022-2032 ($MILLION)
FIGURE 33. ITALY E-COAT MARKET, 2022-2032 ($MILLION)
FIGURE 34. RUSSIA E-COAT MARKET, 2022-2032 ($MILLION)
FIGURE 35. REST OF EUROPE E-COAT MARKET, 2022-2032 ($MILLION)
FIGURE 36. CHINA E-COAT MARKET, 2022-2032 ($MILLION)
FIGURE 37. INDIA E-COAT MARKET, 2022-2032 ($MILLION)
FIGURE 38. JAPAN E-COAT MARKET, 2022-2032 ($MILLION)
FIGURE 39. SOUTH KOREA E-COAT MARKET, 2022-2032 ($MILLION)
FIGURE 40. AUSTRALIA E-COAT MARKET, 2022-2032 ($MILLION)
FIGURE 41. THAILAND E-COAT MARKET, 2022-2032 ($MILLION)
FIGURE 42. INDONESIA E-COAT MARKET, 2022-2032 ($MILLION)
FIGURE 43. MALAYSIA E-COAT MARKET, 2022-2032 ($MILLION)
FIGURE 44. REST OF ASIA-PACIFIC E-COAT MARKET, 2022-2032 ($MILLION)
FIGURE 45. BRAZIL E-COAT MARKET, 2022-2032 ($MILLION)
FIGURE 46. SAUDI ARABIA E-COAT MARKET, 2022-2032 ($MILLION)
FIGURE 47. SOUTH AFRICA E-COAT MARKET, 2022-2032 ($MILLION)
FIGURE 48. ARGENTINA E-COAT MARKET, 2022-2032 ($MILLION)
FIGURE 49. UAE E-COAT MARKET, 2022-2032 ($MILLION)
FIGURE 50. REST OF LAMEA E-COAT MARKET, 2022-2032 ($MILLION)
FIGURE 51. TOP WINNING STRATEGIES, BY YEAR
FIGURE 52. TOP WINNING STRATEGIES, BY DEVELOPMENT
FIGURE 53. TOP WINNING STRATEGIES, BY COMPANY
FIGURE 54. PRODUCT MAPPING OF TOP 10 PLAYERS
FIGURE 55. COMPETITIVE DASHBOARD
FIGURE 56. COMPETITIVE HEATMAP: E-COAT MARKET
FIGURE 57. TOP PLAYER POSITIONING, 2022
FIGURE 58. PPG INDUSTRIES, INC.: NET REVENUE, 2020-2022 ($MILLION)
FIGURE 59. PPG INDUSTRIES, INC.: REVENUE SHARE BY SEGMENT, 2021 (%)
FIGURE 60. PPG INDUSTRIES, INC.: REVENUE SHARE BY REGION, 2022 (%)
FIGURE 61. AXALTA COATING SYSTEMS, LTD: NET REVENUE, 2020-2022 ($MILLION)
FIGURE 62. AXALTA COATING SYSTEMS, LTD: REVENUE SHARE BY REGION, 2022 (%)
FIGURE 63. AXALTA COATING SYSTEMS, LTD: REVENUE SHARE BY SEGMENT, 2022 (%)
FIGURE 64. BASF SE: NET SALES, 2020-2022 ($MILLION)
FIGURE 65. BASF SE: RESEARCH & DEVELOPMENT EXPENDITURE, 2020-2022 ($MILLION)
FIGURE 66. BASF SE: REVENUE SHARE BY SEGMENT, 2022 (%)
FIGURE 67. BASF SE: REVENUE SHARE BY REGION, 2022 (%)
FIGURE 68. NIPPON PAINT HOLDINGS CO., LTD.: NET REVENUE, 2020-2022 ($MILLION)
FIGURE 69. NIPPON PAINT HOLDINGS CO., LTD.: REVENUE SHARE BY SEGMENT, 2022 (%)
FIGURE 70. THE SHERWIN-WILLIAMS COMPANY: NET REVENUE, 2020-2022 ($MILLION)
FIGURE 71. THE SHERWIN-WILLIAMS COMPANY: REVENUE SHARE BY SEGMENT, 2022 (%)
FIGURE 72. KCC CORPORATION.: NET REVENUE, 2020-2022 ($MILLION)
FIGURE 73. KANSAI PAINT CO., LTD.: NET REVENUE, 2020-2022 ($MILLION)
FIGURE 74. KANSAI PAINT CO., LTD.: REVENUE SHARE BY REGION, 2022 (%
SELECT A FORMAT
Added to Cart
Electronic (PDF)

$5730

This license allows only one user to access the PDF.
Electronic (PDF)

$6450

This license allows 1 - 5 user to access the PDF, license is suitable for small groups of 5 users working together
Electronic (PDF)

$9600

This license allows users/teams in a same Enterprise to use this report, various departments within an enterpise can use this report
Electronic (PDF)

$3840

This license just provides quantitative data in a excel sheet
Add to Cart
Buy Now (15% Discount)

OUR CUSTOMER

Novocure

SIMILAR REPORTS