0
U.S. (TOLL FREE)
+1 (315) 215-3225
Automative

0
U.S. (TOLL FREE)
+1 (315) 215-3225
Cloud Artificial Intelligence Market by Component (Solution, Service), by Technology (Deep Learning, Machine Learning (ML), Natural Language Processing (NLP), Others), by Industry Vertical (IT and Telecommunication, BFSI, Retail and E-commerce, Healthcare, Automotive and Transportation, Government and Defense, Others): Global Opportunity Analysis and Industry Forecast, 2023-2032
Published Date: October 2023
|
Report Code: ALLI-Manu-0E92
Home | Market Reports | Computers & Electronics| Software| Internet Software
Cloud Artificial Intelligence Market
BUY CHAPTERS

Cloud Artificial Intelligence Market by Component (Solution, Service), by Technology (Deep Learning, Machine Learning (ML), Natural Language Processing (NLP), Others), by Industry Vertical (IT and Telecommunication, BFSI, Retail and E-commerce, Healthcare, Automotive and Transportation, Government and Defense, Others): Global Opportunity Analysis and Industry Forecast, 2023-2032

Code: ALLI-Manu-0E92
Report
October 2023
Pages:289
Allied Market Research
Buy Now with 15% Discount
DESCRIPTION
TABLE OF CONTENT
TABLES & FIGURES

Cloud AI Market 

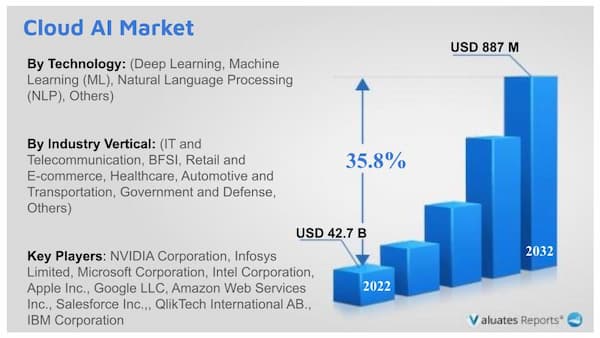
The global cloud artificial intelligence market was valued at USD 42.7 Billion in 2022, and is projected to reach USD 887 Billion by 2032, growing at a CAGR of 35.8% from 2023 to 2032. 

Businesses can build, use, and innovate AI to solve business challenges more swiftly thanks to sophisticated cloud-based AI technologies. Cloud-based artificial intelligence technology has the potential to reduce costs for organizations while increasing productivity and efficiency. Additionally, it can provide customers greater convenience and an enhanced user experience. A further driving force behind the global market's expansion is the increasing need across several sectors to handle massive volumes of data for seamless data accessibility. These enhanced qualities ought to offer lucrative opportunities for market growth during the forecast timeframe.

Cloud AI Market Size

Cloud AI Market Trends

The rapidly expanding number of cloud-based AI services is largely responsible for the growth of the cloud artificial intelligence industry. Because it provides the basic architecture and resources needed to give digitalization to end users, cloud computing is an essential enabler for enterprises. This can be explained by the increasing number of countries pledging to use artificial intelligence solutions based in the cloud. Furthermore, policymakers have increased their efforts to use state-of-the-art technology and have plans to include a new digital solution. Moreover, cloud-based AI systems utilize the economies of scale provided by cloud computing. The upfront costs of purchasing and maintaining hardware infrastructure on-site may be avoided by businesses. 

The growing use of mobile and Internet devices is predicted to provide development opportunities for the worldwide cloud AI industry. The growth of mobile devices and increasing connectivity has led to a desire for advanced technical services, which in turn has boosted end users' need for cloud AI solutions. The growing usage of mobile devices and the internet can help organizations embrace more cloud AI solutions. Cloud-based AI users may securely access apps and data from their personal devices. Productivity and work-life balance are improved when companies are able to support company operations efficiently. The aforementioned variables have a significant impact on the cloud artificial intelligence market forecast's vast potential for growth and development.

Because cloud computing AI ushers in a new era of possibilities, the benefits of cloud-based AI are magnified in the domain of business transformation. One of the main advantages of this fusion is its unparalleled scalability and adaptability. Imagine a scenario where a large retailer anticipates a spike in online orders over the holiday season. The company can simply deploy extra computer capacity to manage the unexpected rise in orders by implementing AI-powered cloud computing, ensuring smooth operations and satisfied customers. Think of a recent software startup with a large user base. The company saves money by avoiding the need to purchase pricey on-premises equipment by using AI cloud technology to dynamically adjust resources based on demand. 

The corporate evolution environment has made it imperative to fully utilize cloud-based AI, which is altering the way businesses operate. Among these advantages, cost savings—a consequence of AI use in cloud computing—stand out for their effectiveness. Consider a manufacturing corporation aiming to increase productivity. They maximize machinery efficiency, minimize downtime, optimize resource allocation using real-time data, and conserve energy by utilizing AI cloud solutions. Additionally, the company can foresee maintenance needs and prevent costly problems by utilizing AI and cloud computing.

Cloud AI Market Share

North America held a dominant market share for cloud AI in 2022. This is due to the fact that in order to improve customer experience and businesses, more money is being spent on cutting-edge technologies including cloud-based services, artificial intelligence (AI), machine learning (ML), business analytics software, and the Internet of Things (IoT). It is anticipated that these investments will stimulate the cloud artificial intelligence market. However, it is projected that Asia-Pacific will expand the quickest throughout the duration of the prediction. This may be related to the market's expected lucrative growth potential in the area as a result of the growing use of contemporary technologies and the spread of digitalization.

Scope of Cloud AI Market Report

Report Metric Details
Report Name Global Cloud AI Market
Base Year 2023
Forecasted years 2023-2032
By Company NVIDIA Corporation, Infosys Limited, Microsoft Corporation, Intel Corporation, Apple Inc., Google LLC, Amazon Web Services Inc., Salesforce Inc.,, QlikTech International AB., IBM Corporation
Segment by Component
  • Solution 
  • Service
Segment by Technology
  • Deep Learning
  • Machine Learning (ML)
  • Natural Language Processing (NLP)
Segment by Industry Vertical
  • IT and Telecommunication
  • BFSI
  • Retail and E-commerce
  • Healthcare
  • Automotive and Transportation
  • Government and Defense
Consumption by Region
  • North America (United States, Canada)
  • Europe (Germany, France, UK, Italy, Russia)
  • Asia-Pacific (China, Japan, South Korea, Taiwan)
  • Southeast Asia (India)
  • Latin America (Mexico, Brazil)
Forecast units USD million in value
Report coverage Revenue and volume forecast, company share, competitive landscape, growth factors and trends
  • CHAPTER 1: INTRODUCTION

    • 1.1. Report description

    • 1.2. Key market segments

    • 1.3. Key benefits to the stakeholders

    • 1.4. Research methodology

      • 1.4.1. Primary research

      • 1.4.2. Secondary research

      • 1.4.3. Analyst tools and models

  • CHAPTER 2: EXECUTIVE SUMMARY

    • 2.1. CXO Perspective

  • CHAPTER 3: MARKET OVERVIEW

    • 3.1. Market definition and scope

    • 3.2. Key findings

      • 3.2.1. Top impacting factors

      • 3.2.2. Top investment pockets

    • 3.3. Porter’s five forces analysis

      • 3.3.1. Moderate-to-high bargaining power of suppliers

      • 3.3.2. Low-to-high threat of new entrants

      • 3.3.3. Low threat of substitutes

      • 3.3.4. Low-to-high intensity of rivalry

      • 3.3.5. Modearate bargaining power of buyers

    • 3.4. Market dynamics

      • 3.4.1. Drivers

        • 3.4.1.1. Increase in availability of cloud-based AI services
        • 3.4.1.2. Surge in usage of mobile devices
        • 3.4.1.3. Surge in technological advancements
      • 3.4.2. Restraints

        • 3.4.2.1. Data privacy and security concerns
        • 3.4.2.2. Costs and budget constraints
      • 3.4.3. Opportunities

        • 3.4.3.1. Rise in integration of industry 4.0
    • 3.5. Key Regulation Analysis

  • CHAPTER 4: CLOUD ARTIFICIAL INTELLIGENCE MARKET, BY COMPONENT

    • 4.1. Overview

      • 4.1.1. Market size and forecast

    • 4.2. Solution

      • 4.2.1. Key market trends, growth factors and opportunities

      • 4.2.2. Market size and forecast, by region

      • 4.2.3. Market share analysis by country

    • 4.3. Service

      • 4.3.1. Key market trends, growth factors and opportunities

      • 4.3.2. Market size and forecast, by region

      • 4.3.3. Market share analysis by country

  • CHAPTER 5: CLOUD ARTIFICIAL INTELLIGENCE MARKET, BY TECHNOLOGY

    • 5.1. Overview

      • 5.1.1. Market size and forecast

    • 5.2. Deep Learning

      • 5.2.1. Key market trends, growth factors and opportunities

      • 5.2.2. Market size and forecast, by region

      • 5.2.3. Market share analysis by country

    • 5.3. Machine Learning (ML)

      • 5.3.1. Key market trends, growth factors and opportunities

      • 5.3.2. Market size and forecast, by region

      • 5.3.3. Market share analysis by country

    • 5.4. Natural Language Processing (NLP)

      • 5.4.1. Key market trends, growth factors and opportunities

      • 5.4.2. Market size and forecast, by region

      • 5.4.3. Market share analysis by country

    • 5.5. Others

      • 5.5.1. Key market trends, growth factors and opportunities

      • 5.5.2. Market size and forecast, by region

      • 5.5.3. Market share analysis by country

  • CHAPTER 6: CLOUD ARTIFICIAL INTELLIGENCE MARKET, BY INDUSTRY VERTICAL

    • 6.1. Overview

      • 6.1.1. Market size and forecast

    • 6.2. IT and Telecommunication

      • 6.2.1. Key market trends, growth factors and opportunities

      • 6.2.2. Market size and forecast, by region

      • 6.2.3. Market share analysis by country

    • 6.3. BFSI

      • 6.3.1. Key market trends, growth factors and opportunities

      • 6.3.2. Market size and forecast, by region

      • 6.3.3. Market share analysis by country

    • 6.4. Retail and E-commerce

      • 6.4.1. Key market trends, growth factors and opportunities

      • 6.4.2. Market size and forecast, by region

      • 6.4.3. Market share analysis by country

    • 6.5. Healthcare

      • 6.5.1. Key market trends, growth factors and opportunities

      • 6.5.2. Market size and forecast, by region

      • 6.5.3. Market share analysis by country

    • 6.6. Automotive and Transportation

      • 6.6.1. Key market trends, growth factors and opportunities

      • 6.6.2. Market size and forecast, by region

      • 6.6.3. Market share analysis by country

    • 6.7. Government and Defense

      • 6.7.1. Key market trends, growth factors and opportunities

      • 6.7.2. Market size and forecast, by region

      • 6.7.3. Market share analysis by country

    • 6.8. Others

      • 6.8.1. Key market trends, growth factors and opportunities

      • 6.8.2. Market size and forecast, by region

      • 6.8.3. Market share analysis by country

  • CHAPTER 7: CLOUD ARTIFICIAL INTELLIGENCE MARKET, BY REGION

    • 7.1. Overview

      • 7.1.1. Market size and forecast By Region

    • 7.2. North America

      • 7.2.1. Key market trends, growth factors and opportunities

      • 7.2.2. Market size and forecast, by Component

      • 7.2.3. Market size and forecast, by Technology

      • 7.2.4. Market size and forecast, by Industry Vertical

      • 7.2.5. Market size and forecast, by country

        • 7.2.5.1. U.S.
          • 7.2.5.1.1. Market size and forecast, by Component
          • 7.2.5.1.2. Market size and forecast, by Technology
          • 7.2.5.1.3. Market size and forecast, by Industry Vertical
        • 7.2.5.2. Canada
          • 7.2.5.2.1. Market size and forecast, by Component
          • 7.2.5.2.2. Market size and forecast, by Technology
          • 7.2.5.2.3. Market size and forecast, by Industry Vertical
    • 7.3. Europe

      • 7.3.1. Key market trends, growth factors and opportunities

      • 7.3.2. Market size and forecast, by Component

      • 7.3.3. Market size and forecast, by Technology

      • 7.3.4. Market size and forecast, by Industry Vertical

      • 7.3.5. Market size and forecast, by country

        • 7.3.5.1. UK
          • 7.3.5.1.1. Market size and forecast, by Component
          • 7.3.5.1.2. Market size and forecast, by Technology
          • 7.3.5.1.3. Market size and forecast, by Industry Vertical
        • 7.3.5.2. Germany
          • 7.3.5.2.1. Market size and forecast, by Component
          • 7.3.5.2.2. Market size and forecast, by Technology
          • 7.3.5.2.3. Market size and forecast, by Industry Vertical
        • 7.3.5.3. France
          • 7.3.5.3.1. Market size and forecast, by Component
          • 7.3.5.3.2. Market size and forecast, by Technology
          • 7.3.5.3.3. Market size and forecast, by Industry Vertical
        • 7.3.5.4. Italy
          • 7.3.5.4.1. Market size and forecast, by Component
          • 7.3.5.4.2. Market size and forecast, by Technology
          • 7.3.5.4.3. Market size and forecast, by Industry Vertical
        • 7.3.5.5. Spain
          • 7.3.5.5.1. Market size and forecast, by Component
          • 7.3.5.5.2. Market size and forecast, by Technology
          • 7.3.5.5.3. Market size and forecast, by Industry Vertical
        • 7.3.5.6. Rest of Europe
          • 7.3.5.6.1. Market size and forecast, by Component
          • 7.3.5.6.2. Market size and forecast, by Technology
          • 7.3.5.6.3. Market size and forecast, by Industry Vertical
    • 7.4. Asia-Pacific

      • 7.4.1. Key market trends, growth factors and opportunities

      • 7.4.2. Market size and forecast, by Component

      • 7.4.3. Market size and forecast, by Technology

      • 7.4.4. Market size and forecast, by Industry Vertical

      • 7.4.5. Market size and forecast, by country

        • 7.4.5.1. China
          • 7.4.5.1.1. Market size and forecast, by Component
          • 7.4.5.1.2. Market size and forecast, by Technology
          • 7.4.5.1.3. Market size and forecast, by Industry Vertical
        • 7.4.5.2. Japan
          • 7.4.5.2.1. Market size and forecast, by Component
          • 7.4.5.2.2. Market size and forecast, by Technology
          • 7.4.5.2.3. Market size and forecast, by Industry Vertical
        • 7.4.5.3. India
          • 7.4.5.3.1. Market size and forecast, by Component
          • 7.4.5.3.2. Market size and forecast, by Technology
          • 7.4.5.3.3. Market size and forecast, by Industry Vertical
        • 7.4.5.4. Australia
          • 7.4.5.4.1. Market size and forecast, by Component
          • 7.4.5.4.2. Market size and forecast, by Technology
          • 7.4.5.4.3. Market size and forecast, by Industry Vertical
        • 7.4.5.5. South Korea
          • 7.4.5.5.1. Market size and forecast, by Component
          • 7.4.5.5.2. Market size and forecast, by Technology
          • 7.4.5.5.3. Market size and forecast, by Industry Vertical
        • 7.4.5.6. Rest of Asia-Pacific
          • 7.4.5.6.1. Market size and forecast, by Component
          • 7.4.5.6.2. Market size and forecast, by Technology
          • 7.4.5.6.3. Market size and forecast, by Industry Vertical
    • 7.5. LAMEA

      • 7.5.1. Key market trends, growth factors and opportunities

      • 7.5.2. Market size and forecast, by Component

      • 7.5.3. Market size and forecast, by Technology

      • 7.5.4. Market size and forecast, by Industry Vertical

      • 7.5.5. Market size and forecast, by country

        • 7.5.5.1. Latin America
          • 7.5.5.1.1. Market size and forecast, by Component
          • 7.5.5.1.2. Market size and forecast, by Technology
          • 7.5.5.1.3. Market size and forecast, by Industry Vertical
        • 7.5.5.2. Middle East
          • 7.5.5.2.1. Market size and forecast, by Component
          • 7.5.5.2.2. Market size and forecast, by Technology
          • 7.5.5.2.3. Market size and forecast, by Industry Vertical
        • 7.5.5.3. Africa
          • 7.5.5.3.1. Market size and forecast, by Component
          • 7.5.5.3.2. Market size and forecast, by Technology
          • 7.5.5.3.3. Market size and forecast, by Industry Vertical
  • CHAPTER 8: COMPETITIVE LANDSCAPE

    • 8.1. Introduction

    • 8.2. Top winning strategies

    • 8.3. Product mapping of top 10 player

    • 8.4. Competitive dashboard

    • 8.5. Competitive heatmap

    • 8.6. Top player positioning, 2022

  • CHAPTER 9: COMPANY PROFILES

    • 9.1. Apple Inc.

      • 9.1.1. Company overview

      • 9.1.2. Key executives

      • 9.1.3. Company snapshot

      • 9.1.4. Operating business segments

      • 9.1.5. Product portfolio

      • 9.1.6. Business performance

      • 9.1.7. Key strategic moves and developments

    • 9.2. Google LLC

      • 9.2.1. Company overview

      • 9.2.2. Key executives

      • 9.2.3. Company snapshot

      • 9.2.4. Operating business segments

      • 9.2.5. Product portfolio

      • 9.2.6. Business performance

      • 9.2.7. Key strategic moves and developments

    • 9.3. IBM Corporation

      • 9.3.1. Company overview

      • 9.3.2. Key executives

      • 9.3.3. Company snapshot

      • 9.3.4. Operating business segments

      • 9.3.5. Product portfolio

      • 9.3.6. Business performance

      • 9.3.7. Key strategic moves and developments

    • 9.4. Intel Corporation

      • 9.4.1. Company overview

      • 9.4.2. Key executives

      • 9.4.3. Company snapshot

      • 9.4.4. Operating business segments

      • 9.4.5. Product portfolio

      • 9.4.6. Business performance

      • 9.4.7. Key strategic moves and developments

    • 9.5. Microsoft Corporation

      • 9.5.1. Company overview

      • 9.5.2. Key executives

      • 9.5.3. Company snapshot

      • 9.5.4. Operating business segments

      • 9.5.5. Product portfolio

      • 9.5.6. Business performance

      • 9.5.7. Key strategic moves and developments

    • 9.6. NVIDIA Corporation

      • 9.6.1. Company overview

      • 9.6.2. Key executives

      • 9.6.3. Company snapshot

      • 9.6.4. Operating business segments

      • 9.6.5. Product portfolio

      • 9.6.6. Business performance

      • 9.6.7. Key strategic moves and developments

    • 9.7. Salesforce Inc.,

      • 9.7.1. Company overview

      • 9.7.2. Key executives

      • 9.7.3. Company snapshot

      • 9.7.4. Operating business segments

      • 9.7.5. Product portfolio

      • 9.7.6. Business performance

      • 9.7.7. Key strategic moves and developments

    • 9.8. Amazon Web Services Inc.

      • 9.8.1. Company overview

      • 9.8.2. Key executives

      • 9.8.3. Company snapshot

      • 9.8.4. Operating business segments

      • 9.8.5. Product portfolio

      • 9.8.6. Business performance

      • 9.8.7. Key strategic moves and developments

    • 9.9. Infosys Limited

      • 9.9.1. Company overview

      • 9.9.2. Key executives

      • 9.9.3. Company snapshot

      • 9.9.4. Operating business segments

      • 9.9.5. Product portfolio

      • 9.9.6. Business performance

      • 9.9.7. Key strategic moves and developments

    • 9.10. QlikTech International AB.

      • 9.10.1. Company overview

      • 9.10.2. Key executives

      • 9.10.3. Company snapshot

      • 9.10.4. Operating business segments

      • 9.10.5. Product portfolio

      • 9.10.6. Key strategic moves and developments

  • LIST OF TABLES

  • TABLE 01. GLOBAL CLOUD ARTIFICIAL INTELLIGENCE MARKET, BY COMPONENT, 2022-2032 ($MILLION)
    TABLE 02. CLOUD ARTIFICIAL INTELLIGENCE MARKET FOR SOLUTION, BY REGION, 2022-2032 ($MILLION)
    TABLE 03. CLOUD ARTIFICIAL INTELLIGENCE MARKET FOR SERVICE, BY REGION, 2022-2032 ($MILLION)
    TABLE 04. GLOBAL CLOUD ARTIFICIAL INTELLIGENCE MARKET, BY TECHNOLOGY, 2022-2032 ($MILLION)
    TABLE 05. CLOUD ARTIFICIAL INTELLIGENCE MARKET FOR DEEP LEARNING, BY REGION, 2022-2032 ($MILLION)
    TABLE 06. CLOUD ARTIFICIAL INTELLIGENCE MARKET FOR MACHINE LEARNING (ML), BY REGION, 2022-2032 ($MILLION)
    TABLE 07. CLOUD ARTIFICIAL INTELLIGENCE MARKET FOR NATURAL LANGUAGE PROCESSING (NLP), BY REGION, 2022-2032 ($MILLION)
    TABLE 08. CLOUD ARTIFICIAL INTELLIGENCE MARKET FOR OTHERS, BY REGION, 2022-2032 ($MILLION)
    TABLE 09. GLOBAL CLOUD ARTIFICIAL INTELLIGENCE MARKET, BY INDUSTRY VERTICAL, 2022-2032 ($MILLION)
    TABLE 10. CLOUD ARTIFICIAL INTELLIGENCE MARKET FOR IT AND TELECOMMUNICATION, BY REGION, 2022-2032 ($MILLION)
    TABLE 11. CLOUD ARTIFICIAL INTELLIGENCE MARKET FOR BFSI, BY REGION, 2022-2032 ($MILLION)
    TABLE 12. CLOUD ARTIFICIAL INTELLIGENCE MARKET FOR RETAIL AND E-COMMERCE, BY REGION, 2022-2032 ($MILLION)
    TABLE 13. CLOUD ARTIFICIAL INTELLIGENCE MARKET FOR HEALTHCARE, BY REGION, 2022-2032 ($MILLION)
    TABLE 14. CLOUD ARTIFICIAL INTELLIGENCE MARKET FOR AUTOMOTIVE AND TRANSPORTATION, BY REGION, 2022-2032 ($MILLION)
    TABLE 15. CLOUD ARTIFICIAL INTELLIGENCE MARKET FOR GOVERNMENT AND DEFENSE, BY REGION, 2022-2032 ($MILLION)
    TABLE 16. CLOUD ARTIFICIAL INTELLIGENCE MARKET FOR OTHERS, BY REGION, 2022-2032 ($MILLION)
    TABLE 17. CLOUD ARTIFICIAL INTELLIGENCE MARKET, BY REGION, 2022-2032 ($MILLION)
    TABLE 18. NORTH AMERICA CLOUD ARTIFICIAL INTELLIGENCE MARKET, BY COMPONENT, 2022-2032 ($MILLION)
    TABLE 19. NORTH AMERICA CLOUD ARTIFICIAL INTELLIGENCE MARKET, BY TECHNOLOGY, 2022-2032 ($MILLION)
    TABLE 20. NORTH AMERICA CLOUD ARTIFICIAL INTELLIGENCE MARKET, BY INDUSTRY VERTICAL, 2022-2032 ($MILLION)
    TABLE 21. NORTH AMERICA CLOUD ARTIFICIAL INTELLIGENCE MARKET, BY COUNTRY, 2022-2032 ($MILLION)
    TABLE 22. U.S. CLOUD ARTIFICIAL INTELLIGENCE MARKET, BY COMPONENT, 2022-2032 ($MILLION)
    TABLE 23. U.S. CLOUD ARTIFICIAL INTELLIGENCE MARKET, BY TECHNOLOGY, 2022-2032 ($MILLION)
    TABLE 24. U.S. CLOUD ARTIFICIAL INTELLIGENCE MARKET, BY INDUSTRY VERTICAL, 2022-2032 ($MILLION)
    TABLE 25. CANADA CLOUD ARTIFICIAL INTELLIGENCE MARKET, BY COMPONENT, 2022-2032 ($MILLION)
    TABLE 26. CANADA CLOUD ARTIFICIAL INTELLIGENCE MARKET, BY TECHNOLOGY, 2022-2032 ($MILLION)
    TABLE 27. CANADA CLOUD ARTIFICIAL INTELLIGENCE MARKET, BY INDUSTRY VERTICAL, 2022-2032 ($MILLION)
    TABLE 28. EUROPE CLOUD ARTIFICIAL INTELLIGENCE MARKET, BY COMPONENT, 2022-2032 ($MILLION)
    TABLE 29. EUROPE CLOUD ARTIFICIAL INTELLIGENCE MARKET, BY TECHNOLOGY, 2022-2032 ($MILLION)
    TABLE 30. EUROPE CLOUD ARTIFICIAL INTELLIGENCE MARKET, BY INDUSTRY VERTICAL, 2022-2032 ($MILLION)
    TABLE 31. EUROPE CLOUD ARTIFICIAL INTELLIGENCE MARKET, BY COUNTRY, 2022-2032 ($MILLION)
    TABLE 32. UK CLOUD ARTIFICIAL INTELLIGENCE MARKET, BY COMPONENT, 2022-2032 ($MILLION)
    TABLE 33. UK CLOUD ARTIFICIAL INTELLIGENCE MARKET, BY TECHNOLOGY, 2022-2032 ($MILLION)
    TABLE 34. UK CLOUD ARTIFICIAL INTELLIGENCE MARKET, BY INDUSTRY VERTICAL, 2022-2032 ($MILLION)
    TABLE 35. GERMANY CLOUD ARTIFICIAL INTELLIGENCE MARKET, BY COMPONENT, 2022-2032 ($MILLION)
    TABLE 36. GERMANY CLOUD ARTIFICIAL INTELLIGENCE MARKET, BY TECHNOLOGY, 2022-2032 ($MILLION)
    TABLE 37. GERMANY CLOUD ARTIFICIAL INTELLIGENCE MARKET, BY INDUSTRY VERTICAL, 2022-2032 ($MILLION)
    TABLE 38. FRANCE CLOUD ARTIFICIAL INTELLIGENCE MARKET, BY COMPONENT, 2022-2032 ($MILLION)
    TABLE 39. FRANCE CLOUD ARTIFICIAL INTELLIGENCE MARKET, BY TECHNOLOGY, 2022-2032 ($MILLION)
    TABLE 40. FRANCE CLOUD ARTIFICIAL INTELLIGENCE MARKET, BY INDUSTRY VERTICAL, 2022-2032 ($MILLION)
    TABLE 41. ITALY CLOUD ARTIFICIAL INTELLIGENCE MARKET, BY COMPONENT, 2022-2032 ($MILLION)
    TABLE 42. ITALY CLOUD ARTIFICIAL INTELLIGENCE MARKET, BY TECHNOLOGY, 2022-2032 ($MILLION)
    TABLE 43. ITALY CLOUD ARTIFICIAL INTELLIGENCE MARKET, BY INDUSTRY VERTICAL, 2022-2032 ($MILLION)
    TABLE 44. SPAIN CLOUD ARTIFICIAL INTELLIGENCE MARKET, BY COMPONENT, 2022-2032 ($MILLION)
    TABLE 45. SPAIN CLOUD ARTIFICIAL INTELLIGENCE MARKET, BY TECHNOLOGY, 2022-2032 ($MILLION)
    TABLE 46. SPAIN CLOUD ARTIFICIAL INTELLIGENCE MARKET, BY INDUSTRY VERTICAL, 2022-2032 ($MILLION)
    TABLE 47. REST OF EUROPE CLOUD ARTIFICIAL INTELLIGENCE MARKET, BY COMPONENT, 2022-2032 ($MILLION)
    TABLE 48. REST OF EUROPE CLOUD ARTIFICIAL INTELLIGENCE MARKET, BY TECHNOLOGY, 2022-2032 ($MILLION)
    TABLE 49. REST OF EUROPE CLOUD ARTIFICIAL INTELLIGENCE MARKET, BY INDUSTRY VERTICAL, 2022-2032 ($MILLION)
    TABLE 50. ASIA-PACIFIC CLOUD ARTIFICIAL INTELLIGENCE MARKET, BY COMPONENT, 2022-2032 ($MILLION)
    TABLE 51. ASIA-PACIFIC CLOUD ARTIFICIAL INTELLIGENCE MARKET, BY TECHNOLOGY, 2022-2032 ($MILLION)
    TABLE 52. ASIA-PACIFIC CLOUD ARTIFICIAL INTELLIGENCE MARKET, BY INDUSTRY VERTICAL, 2022-2032 ($MILLION)
    TABLE 53. ASIA-PACIFIC CLOUD ARTIFICIAL INTELLIGENCE MARKET, BY COUNTRY, 2022-2032 ($MILLION)
    TABLE 54. CHINA CLOUD ARTIFICIAL INTELLIGENCE MARKET, BY COMPONENT, 2022-2032 ($MILLION)
    TABLE 55. CHINA CLOUD ARTIFICIAL INTELLIGENCE MARKET, BY TECHNOLOGY, 2022-2032 ($MILLION)
    TABLE 56. CHINA CLOUD ARTIFICIAL INTELLIGENCE MARKET, BY INDUSTRY VERTICAL, 2022-2032 ($MILLION)
    TABLE 57. JAPAN CLOUD ARTIFICIAL INTELLIGENCE MARKET, BY COMPONENT, 2022-2032 ($MILLION)
    TABLE 58. JAPAN CLOUD ARTIFICIAL INTELLIGENCE MARKET, BY TECHNOLOGY, 2022-2032 ($MILLION)
    TABLE 59. JAPAN CLOUD ARTIFICIAL INTELLIGENCE MARKET, BY INDUSTRY VERTICAL, 2022-2032 ($MILLION)
    TABLE 60. INDIA CLOUD ARTIFICIAL INTELLIGENCE MARKET, BY COMPONENT, 2022-2032 ($MILLION)
    TABLE 61. INDIA CLOUD ARTIFICIAL INTELLIGENCE MARKET, BY TECHNOLOGY, 2022-2032 ($MILLION)
    TABLE 62. INDIA CLOUD ARTIFICIAL INTELLIGENCE MARKET, BY INDUSTRY VERTICAL, 2022-2032 ($MILLION)
    TABLE 63. AUSTRALIA CLOUD ARTIFICIAL INTELLIGENCE MARKET, BY COMPONENT, 2022-2032 ($MILLION)
    TABLE 64. AUSTRALIA CLOUD ARTIFICIAL INTELLIGENCE MARKET, BY TECHNOLOGY, 2022-2032 ($MILLION)
    TABLE 65. AUSTRALIA CLOUD ARTIFICIAL INTELLIGENCE MARKET, BY INDUSTRY VERTICAL, 2022-2032 ($MILLION)
    TABLE 66. SOUTH KOREA CLOUD ARTIFICIAL INTELLIGENCE MARKET, BY COMPONENT, 2022-2032 ($MILLION)
    TABLE 67. SOUTH KOREA CLOUD ARTIFICIAL INTELLIGENCE MARKET, BY TECHNOLOGY, 2022-2032 ($MILLION)
    TABLE 68. SOUTH KOREA CLOUD ARTIFICIAL INTELLIGENCE MARKET, BY INDUSTRY VERTICAL, 2022-2032 ($MILLION)
    TABLE 69. REST OF ASIA-PACIFIC CLOUD ARTIFICIAL INTELLIGENCE MARKET, BY COMPONENT, 2022-2032 ($MILLION)
    TABLE 70. REST OF ASIA-PACIFIC CLOUD ARTIFICIAL INTELLIGENCE MARKET, BY TECHNOLOGY, 2022-2032 ($MILLION)
    TABLE 71. REST OF ASIA-PACIFIC CLOUD ARTIFICIAL INTELLIGENCE MARKET, BY INDUSTRY VERTICAL, 2022-2032 ($MILLION)
    TABLE 72. LAMEA CLOUD ARTIFICIAL INTELLIGENCE MARKET, BY COMPONENT, 2022-2032 ($MILLION)
    TABLE 73. LAMEA CLOUD ARTIFICIAL INTELLIGENCE MARKET, BY TECHNOLOGY, 2022-2032 ($MILLION)
    TABLE 74. LAMEA CLOUD ARTIFICIAL INTELLIGENCE MARKET, BY INDUSTRY VERTICAL, 2022-2032 ($MILLION)
    TABLE 75. LAMEA CLOUD ARTIFICIAL INTELLIGENCE MARKET, BY COUNTRY, 2022-2032 ($MILLION)
    TABLE 76. LATIN AMERICA CLOUD ARTIFICIAL INTELLIGENCE MARKET, BY COMPONENT, 2022-2032 ($MILLION)
    TABLE 77. LATIN AMERICA CLOUD ARTIFICIAL INTELLIGENCE MARKET, BY TECHNOLOGY, 2022-2032 ($MILLION)
    TABLE 78. LATIN AMERICA CLOUD ARTIFICIAL INTELLIGENCE MARKET, BY INDUSTRY VERTICAL, 2022-2032 ($MILLION)
    TABLE 79. MIDDLE EAST CLOUD ARTIFICIAL INTELLIGENCE MARKET, BY COMPONENT, 2022-2032 ($MILLION)
    TABLE 80. MIDDLE EAST CLOUD ARTIFICIAL INTELLIGENCE MARKET, BY TECHNOLOGY, 2022-2032 ($MILLION)
    TABLE 81. MIDDLE EAST CLOUD ARTIFICIAL INTELLIGENCE MARKET, BY INDUSTRY VERTICAL, 2022-2032 ($MILLION)
    TABLE 82. AFRICA CLOUD ARTIFICIAL INTELLIGENCE MARKET, BY COMPONENT, 2022-2032 ($MILLION)
    TABLE 83. AFRICA CLOUD ARTIFICIAL INTELLIGENCE MARKET, BY TECHNOLOGY, 2022-2032 ($MILLION)
    TABLE 84. AFRICA CLOUD ARTIFICIAL INTELLIGENCE MARKET, BY INDUSTRY VERTICAL, 2022-2032 ($MILLION)
    TABLE 85. APPLE INC.: KEY EXECUTIVES
    TABLE 86. APPLE INC.: COMPANY SNAPSHOT
    TABLE 87. APPLE INC.: PRODUCT SEGMENTS
    TABLE 88. APPLE INC.: SERVICE SEGMENTS
    TABLE 89. APPLE INC.: PRODUCT PORTFOLIO
    TABLE 90. APPLE INC.: KEY STRATERGIES
    TABLE 91. GOOGLE LLC: KEY EXECUTIVES
    TABLE 92. GOOGLE LLC: COMPANY SNAPSHOT
    TABLE 93. GOOGLE LLC: SERVICE SEGMENTS
    TABLE 94. GOOGLE LLC: PRODUCT PORTFOLIO
    TABLE 95. GOOGLE LLC: KEY STRATERGIES
    TABLE 96. IBM CORPORATION: KEY EXECUTIVES
    TABLE 97. IBM CORPORATION: COMPANY SNAPSHOT
    TABLE 98. IBM CORPORATION: SERVICE SEGMENTS
    TABLE 99. IBM CORPORATION: PRODUCT PORTFOLIO
    TABLE 100. IBM CORPORATION: KEY STRATERGIES
    TABLE 101. INTEL CORPORATION: KEY EXECUTIVES
    TABLE 102. INTEL CORPORATION: COMPANY SNAPSHOT
    TABLE 103. INTEL CORPORATION: PRODUCT SEGMENTS
    TABLE 104. INTEL CORPORATION: PRODUCT PORTFOLIO
    TABLE 105. INTEL CORPORATION: KEY STRATERGIES
    TABLE 106. MICROSOFT CORPORATION: KEY EXECUTIVES
    TABLE 107. MICROSOFT CORPORATION: COMPANY SNAPSHOT
    TABLE 108. MICROSOFT CORPORATION: SERVICE SEGMENTS
    TABLE 109. MICROSOFT CORPORATION: PRODUCT PORTFOLIO
    TABLE 110. MICROSOFT CORPORATION: KEY STRATERGIES
    TABLE 111. NVIDIA CORPORATION: KEY EXECUTIVES
    TABLE 112. NVIDIA CORPORATION: COMPANY SNAPSHOT
    TABLE 113. NVIDIA CORPORATION: PRODUCT SEGMENTS
    TABLE 114. NVIDIA CORPORATION: PRODUCT PORTFOLIO
    TABLE 115. NVIDIA CORPORATION: KEY STRATERGIES
    TABLE 116. SALESFORCE INC.,: KEY EXECUTIVES
    TABLE 117. SALESFORCE INC.,: COMPANY SNAPSHOT
    TABLE 118. SALESFORCE INC.,: SERVICE SEGMENTS
    TABLE 119. SALESFORCE INC.,: PRODUCT PORTFOLIO
    TABLE 120. SALESFORCE INC.,: KEY STRATERGIES
    TABLE 121. AMAZON WEB SERVICES INC.: KEY EXECUTIVES
    TABLE 122. AMAZON WEB SERVICES INC.: COMPANY SNAPSHOT
    TABLE 123. AMAZON WEB SERVICES INC.: SERVICE SEGMENTS
    TABLE 124. AMAZON WEB SERVICES INC.: PRODUCT PORTFOLIO
    TABLE 125. AMAZON WEB SERVICES INC.: KEY STRATERGIES
    TABLE 126. INFOSYS LIMITED: KEY EXECUTIVES
    TABLE 127. INFOSYS LIMITED: COMPANY SNAPSHOT
    TABLE 128. INFOSYS LIMITED: SERVICE SEGMENTS
    TABLE 129. INFOSYS LIMITED: PRODUCT PORTFOLIO
    TABLE 130. INFOSYS LIMITED: KEY STRATERGIES
    TABLE 131. QLIKTECH INTERNATIONAL AB.: KEY EXECUTIVES
    TABLE 132. QLIKTECH INTERNATIONAL AB.: COMPANY SNAPSHOT
    TABLE 133. QLIKTECH INTERNATIONAL AB.: SERVICE SEGMENTS
    TABLE 134. QLIKTECH INTERNATIONAL AB.: PRODUCT PORTFOLIO
    TABLE 135. QLIKTECH INTERNATIONAL AB.: KEY STRATERGIES
  • LIST OF FIGURES

  • FIGURE 01. CLOUD ARTIFICIAL INTELLIGENCE MARKET, 2022-2032
    FIGURE 02. SEGMENTATION OF CLOUD ARTIFICIAL INTELLIGENCE MARKET,2022-2032
    FIGURE 03. TOP IMPACTING FACTORS IN CLOUD ARTIFICIAL INTELLIGENCE MARKET (2022 TO 2032)
    FIGURE 04. TOP INVESTMENT POCKETS IN CLOUD ARTIFICIAL INTELLIGENCE MARKET (2023-2032)
    FIGURE 05. MODERATE-TO-HIGH BARGAINING POWER OF SUPPLIERS
    FIGURE 06. LOW-TO-HIGH THREAT OF NEW ENTRANTS
    FIGURE 07. LOW THREAT OF SUBSTITUTES
    FIGURE 08. LOW-TO-HIGH INTENSITY OF RIVALRY
    FIGURE 09. MODEARATE BARGAINING POWER OF BUYERS
    FIGURE 10. GLOBAL CLOUD ARTIFICIAL INTELLIGENCE MARKET:DRIVERS, RESTRAINTS AND OPPORTUNITIES
    FIGURE 11. IMPACT OF KEY REGULATION: CLOUD ARTIFICIAL INTELLIGENCE MARKET
    FIGURE 12. CLOUD ARTIFICIAL INTELLIGENCE MARKET, BY COMPONENT, 2022 AND 2032(%)
    FIGURE 13. COMPARATIVE SHARE ANALYSIS OF CLOUD ARTIFICIAL INTELLIGENCE MARKET FOR SOLUTION, BY COUNTRY 2022 AND 2032(%)
    FIGURE 14. COMPARATIVE SHARE ANALYSIS OF CLOUD ARTIFICIAL INTELLIGENCE MARKET FOR SERVICE, BY COUNTRY 2022 AND 2032(%)
    FIGURE 15. CLOUD ARTIFICIAL INTELLIGENCE MARKET, BY TECHNOLOGY, 2022 AND 2032(%)
    FIGURE 16. COMPARATIVE SHARE ANALYSIS OF CLOUD ARTIFICIAL INTELLIGENCE MARKET FOR DEEP LEARNING, BY COUNTRY 2022 AND 2032(%)
    FIGURE 17. COMPARATIVE SHARE ANALYSIS OF CLOUD ARTIFICIAL INTELLIGENCE MARKET FOR MACHINE LEARNING (ML), BY COUNTRY 2022 AND 2032(%)
    FIGURE 18. COMPARATIVE SHARE ANALYSIS OF CLOUD ARTIFICIAL INTELLIGENCE MARKET FOR NATURAL LANGUAGE PROCESSING (NLP), BY COUNTRY 2022 AND 2032(%)
    FIGURE 19. COMPARATIVE SHARE ANALYSIS OF CLOUD ARTIFICIAL INTELLIGENCE MARKET FOR OTHERS, BY COUNTRY 2022 AND 2032(%)
    FIGURE 20. CLOUD ARTIFICIAL INTELLIGENCE MARKET, BY INDUSTRY VERTICAL, 2022 AND 2032(%)
    FIGURE 21. COMPARATIVE SHARE ANALYSIS OF CLOUD ARTIFICIAL INTELLIGENCE MARKET FOR IT AND TELECOMMUNICATION, BY COUNTRY 2022 AND 2032(%)
    FIGURE 22. COMPARATIVE SHARE ANALYSIS OF CLOUD ARTIFICIAL INTELLIGENCE MARKET FOR BFSI, BY COUNTRY 2022 AND 2032(%)
    FIGURE 23. COMPARATIVE SHARE ANALYSIS OF CLOUD ARTIFICIAL INTELLIGENCE MARKET FOR RETAIL AND E-COMMERCE, BY COUNTRY 2022 AND 2032(%)
    FIGURE 24. COMPARATIVE SHARE ANALYSIS OF CLOUD ARTIFICIAL INTELLIGENCE MARKET FOR HEALTHCARE, BY COUNTRY 2022 AND 2032(%)
    FIGURE 25. COMPARATIVE SHARE ANALYSIS OF CLOUD ARTIFICIAL INTELLIGENCE MARKET FOR AUTOMOTIVE AND TRANSPORTATION, BY COUNTRY 2022 AND 2032(%)
    FIGURE 26. COMPARATIVE SHARE ANALYSIS OF CLOUD ARTIFICIAL INTELLIGENCE MARKET FOR GOVERNMENT AND DEFENSE, BY COUNTRY 2022 AND 2032(%)
    FIGURE 27. COMPARATIVE SHARE ANALYSIS OF CLOUD ARTIFICIAL INTELLIGENCE MARKET FOR OTHERS, BY COUNTRY 2022 AND 2032(%)
    FIGURE 28. CLOUD ARTIFICIAL INTELLIGENCE MARKET BY REGION, 2022 AND 2032(%)
    FIGURE 29. U.S. CLOUD ARTIFICIAL INTELLIGENCE MARKET, 2022-2032 ($MILLION)
    FIGURE 30. CANADA CLOUD ARTIFICIAL INTELLIGENCE MARKET, 2022-2032 ($MILLION)
    FIGURE 31. UK CLOUD ARTIFICIAL INTELLIGENCE MARKET, 2022-2032 ($MILLION)
    FIGURE 32. GERMANY CLOUD ARTIFICIAL INTELLIGENCE MARKET, 2022-2032 ($MILLION)
    FIGURE 33. FRANCE CLOUD ARTIFICIAL INTELLIGENCE MARKET, 2022-2032 ($MILLION)
    FIGURE 34. ITALY CLOUD ARTIFICIAL INTELLIGENCE MARKET, 2022-2032 ($MILLION)
    FIGURE 35. SPAIN CLOUD ARTIFICIAL INTELLIGENCE MARKET, 2022-2032 ($MILLION)
    FIGURE 36. REST OF EUROPE CLOUD ARTIFICIAL INTELLIGENCE MARKET, 2022-2032 ($MILLION)
    FIGURE 37. CHINA CLOUD ARTIFICIAL INTELLIGENCE MARKET, 2022-2032 ($MILLION)
    FIGURE 38. JAPAN CLOUD ARTIFICIAL INTELLIGENCE MARKET, 2022-2032 ($MILLION)
    FIGURE 39. INDIA CLOUD ARTIFICIAL INTELLIGENCE MARKET, 2022-2032 ($MILLION)
    FIGURE 40. AUSTRALIA CLOUD ARTIFICIAL INTELLIGENCE MARKET, 2022-2032 ($MILLION)
    FIGURE 41. SOUTH KOREA CLOUD ARTIFICIAL INTELLIGENCE MARKET, 2022-2032 ($MILLION)
    FIGURE 42. REST OF ASIA-PACIFIC CLOUD ARTIFICIAL INTELLIGENCE MARKET, 2022-2032 ($MILLION)
    FIGURE 43. LATIN AMERICA CLOUD ARTIFICIAL INTELLIGENCE MARKET, 2022-2032 ($MILLION)
    FIGURE 44. MIDDLE EAST CLOUD ARTIFICIAL INTELLIGENCE MARKET, 2022-2032 ($MILLION)
    FIGURE 45. AFRICA CLOUD ARTIFICIAL INTELLIGENCE MARKET, 2022-2032 ($MILLION)
    FIGURE 46. TOP WINNING STRATEGIES, BY YEAR (2020-2023)
    FIGURE 47. TOP WINNING STRATEGIES, BY DEVELOPMENT (2020-2023)
    FIGURE 48. TOP WINNING STRATEGIES, BY COMPANY (2020-2023)
    FIGURE 49. PRODUCT MAPPING OF TOP 10 PLAYERS
    FIGURE 50. COMPETITIVE DASHBOARD
    FIGURE 51. COMPETITIVE HEATMAP: CLOUD ARTIFICIAL INTELLIGENCE MARKET
    FIGURE 52. TOP PLAYER POSITIONING, 2022
    FIGURE 53. APPLE INC.: NET REVENUE, 2020-2022 ($MILLION)
    FIGURE 54. APPLE INC.: RESEARCH & DEVELOPMENT EXPENDITURE, 2020-2022 ($MILLION)
    FIGURE 55. APPLE INC.: REVENUE SHARE BY SEGMENT, 2022 (%)
    FIGURE 56. APPLE INC.: REVENUE SHARE BY REGION, 2022 (%)
    FIGURE 57. GOOGLE LLC: NET REVENUE, 2020-2022 ($MILLION)
    FIGURE 58. GOOGLE LLC: RESEARCH & DEVELOPMENT EXPENDITURE, 2020-2022 ($MILLION)
    FIGURE 59. GOOGLE LLC: REVENUE SHARE BY SEGMENT, 2022 (%)
    FIGURE 60. GOOGLE LLC: REVENUE SHARE BY REGION, 2022 (%)
    FIGURE 61. IBM CORPORATION: NET REVENUE, 2019-2021 ($MILLION)
    FIGURE 62. IBM CORPORATION: RESEARCH & DEVELOPMENT EXPENDITURE, 2019-2021 ($MILLION)
    FIGURE 63. IBM CORPORATION: REVENUE SHARE BY SEGMENT, 2022 (%)
    FIGURE 64. IBM CORPORATION: REVENUE SHARE BY REGION, 2022 (%)
    FIGURE 65. INTEL CORPORATION: NET REVENUE, 2020-2022 ($MILLION)
    FIGURE 66. INTEL CORPORATION: RESEARCH & DEVELOPMENT EXPENDITURE, 2020-2022 ($MILLION)
    FIGURE 67. INTEL CORPORATION: REVENUE SHARE BY REGION, 2022 (%)
    FIGURE 68. INTEL CORPORATION: REVENUE SHARE BY SEGMENT, 2022 (%)
    FIGURE 69. MICROSOFT CORPORATION: NET REVENUE, 2020-2022 ($MILLION)
    FIGURE 70. MICROSOFT CORPORATION: RESEARCH & DEVELOPMENT EXPENDITURE, 2020-2022 ($MILLION)
    FIGURE 71. MICROSOFT CORPORATION: REVENUE SHARE BY SEGMENT, 2022 (%)
    FIGURE 72. MICROSOFT CORPORATION: REVENUE SHARE BY REGION, 2022 (%)
    FIGURE 73. NVIDIA CORPORATION: RESEARCH & DEVELOPMENT EXPENDITURE, 2020-2022 ($MILLION)
    FIGURE 74. NVIDIA CORPORATION: NET REVENUE, 2020-2022 ($MILLION)
    FIGURE 75. NVIDIA CORPORATION: REVENUE SHARE BY SEGMENT, 2022 (%)
    FIGURE 76. NVIDIA CORPORATION: REVENUE SHARE BY REGION, 2021 (%)
    FIGURE 77. SALESFORCE INC.,: RESEARCH & DEVELOPMENT EXPENDITURE, 2020-2022 ($MILLION)
    FIGURE 78. SALESFORCE INC.,: NET REVENUE, 2020-2022 ($MILLION)
    FIGURE 79. SALESFORCE INC.,: REVENUE SHARE BY SEGMENT, 2022 (%)
    FIGURE 80. SALESFORCE INC.,: REVENUE SHARE BY REGION, 2022 (%)
    FIGURE 81. AMAZON WEB SERVICES INC.: NET SALES, 2020-2022 ($MILLION)
    FIGURE 82. AMAZON WEB SERVICES INC.: REVENUE SHARE BY SEGMENT, 2021 (%)
    FIGURE 83. AMAZON WEB SERVICES INC.: REVENUE SHARE BY SEGMENT, 2022 (%)
    FIGURE 84. AMAZON WEB SERVICES INC.: REVENUE SHARE BY REGION, 2022 (%)
    FIGURE 85. INFOSYS LIMITED: NET REVENUE, 2020-2022 ($MILLION)
    FIGURE 86. INFOSYS LIMITED: REVENUE SHARE BY SEGMENT, 2022 (%)
    FIGURE 87. INFOSYS LIMITED: REVENUE SHARE BY REGION, 2022 (%)
SELECT A FORMAT
Added to Cart
Electronic (PDF)

$5730

This license allows only one user to access the PDF.
Electronic (PDF)

$9600

This license allows users/teams in a same Enterprise to use this report, various departments within an enterpise can use this report
Add to Cart
Buy Now (15% Discount)

OUR CUSTOMER

Samsung SD

SIMILAR REPORTS


RELATED REPORTS

Global Rotating Proxy Service Market Research Report 2024

120 Pages
Type: Report
Code: QYRE-Auto-26Y11409
Fri Apr 19 00:00:00 UTC 2024

Add to Cart

Global Proxy Services and Software Market Research Report 2024

120 Pages
Type: Report
Code: QYRE-Auto-21Y11631
Fri Apr 19 00:00:00 UTC 2024

Add to Cart

Global Proxy Software Market Research Report 2024

120 Pages
Type: Report
Code: QYRE-Auto-17V11764
Fri Apr 19 00:00:00 UTC 2024

Add to Cart

Internet Browsers - Global Market Share and Ranking, Overall Sales and Demand Forecast 2024-2030

120 Pages
Type: Report
Code: QYRE-Auto-13M9283
Thu Apr 11 00:00:00 UTC 2024

Add to Cart