
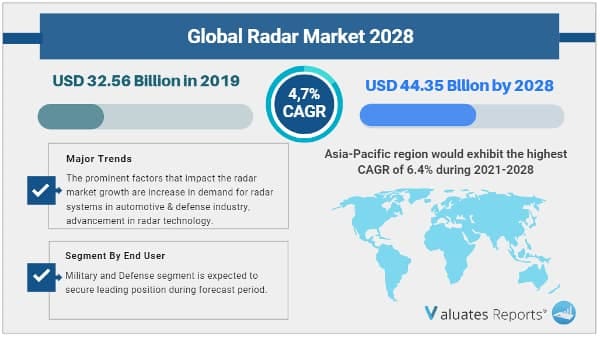
The global radar market size was valued at $32.56 billion in 2019, and is projected to reach $44.35 billion by 2028, registering a CAGR of 4.7% from 2021 to 2028.
Radar is an electromagnetic system, which detects the location and distance of objects and uses radio waves to determine the spread, angle, and speed of an object, which falls within its radius.
Radar comprises a transmitter to produce an electromagnetic signal, which is radiated into space by an antenna. It is used to forecast and detect the spacecraft, aircraft, missiles, weather, and other forms of vehicles. Radar systems are majorly used in industrial applications such speed monitoring, object recognition & tracking, area & distance monitoring, collision avoidance with static & moving objects, owing to their high robustness in measuring of distances, velocities, and angles as compared to optical or ultrasound systems.
Radar was initially developed for defense and military purposes. However, with upcoming technologies and innovation, modern radar system is primarily applicable for air traffic control, radar astronomy, weather formation, and meteorological monitoring. In addition, it is incorporated in air defense systems, anti-missiles systems, and aircraft anti-collision systems.
Furthermore, radar system is widely used in the automotive industry, which has enhanced safety features in passenger cars and other transport systems. Radar deployed in automotive assist in lane changing, aids in cruise control, which allows adjusting the vehicle speed to maintain a safe distance from vehicles ahead, and delivers collision warning, assisting driver about the possible threats.
Rise in preference of economically emerging nations toward deployment of radar technology in various passenger and commercial vehicles is a key factor that drives the growth of the global radar market. In addition, increase in demand for high-end passenger cars, rise in concerns about vehicle & driver safety, and implementation of safety regulations contribute toward the growth of the global radar industry. Furthermore, the growth of the global radar industry is driven by increase in demand for radar systems and high defense budget due to rise in security-related issues. However, adverse climatic conditions result in the malfunctioning of the radar system, which acts as a major restraint of the radar market.
Highly advanced radar systems are used for digital signal processing and are capable of extracting information from high noise level, which is an internal source of random variations in the signal that is generated by all electronic components. For instance, in the aviation sector, aircraft are equipped with radar systems, which enable the detection of obstacles, help forecast weather information, and provide accurate altitude details to assist the pilot to take necessary actions.
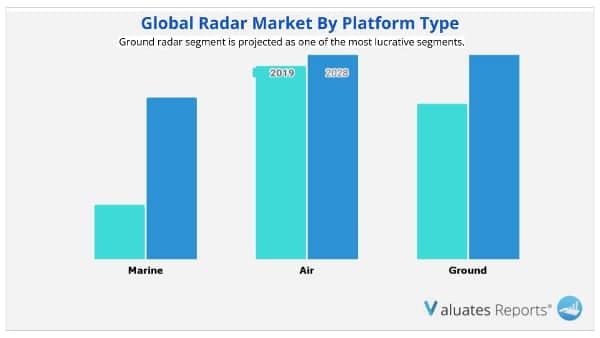
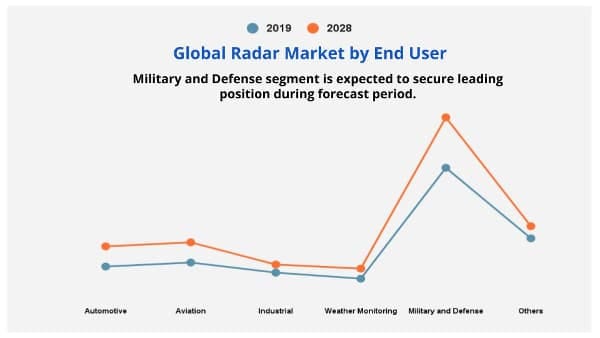
The global radar market is segmented into product type, platform, application, end user, and region. By offering, the market is segmented into hardware, software, and services. The hardware segment is further divided into antenna, receiver, transmitter, duplexer, and others. The service segment is further bifurcated into installation and integration segments. By product type, the market is fragmented into continuous wave radar, pulse radar, and others. On the basis of platform, it is classified into marine, air, ground, and space. The applications covered in the study include air traffic control, remote sensing, ground traffic control, and space navigation & control. Depending on end user, the market is segregated into automotive, aviation, industrial, weather monitoring, military & defense, and others.
Region wise, the radar market trends are analyzed across North America (the U.S., Canada, and Mexico), Europe (the UK, Germany, Italy, France, and rest of Europe), Asia-Pacific (China, Japan, India, South Korea, and rest of Asia-Pacific), and LAMEA (Latin America, the Middle East, and Africa).
The prominent factors that impact the radar market growth are increase in demand for radar systems in automotive & defense industry, advancement in radar technology, and increase in territorial battles. However, adverse climatic conditions restrict the market growth. On the contrary, deployment of lightweight radars in aerial vehicles is expected to create lucrative opportunities for the market. Each of these factors is likely to have a definite impact on the growth of the global radar market during the forecast period.
Competitive analysis and profiles of the major radar market players such as Northrop Grumman Corporation, Lockheed Martin Corporation, SAAB AB, Rockwell Collins Inc., Thales Group, Honeywell International Inc., L-3 Communications Holdings, General Dynamics Corporation, BAE Systems, and Dassault Aviation are provided in this report.
|
Report Metric |
Details |
|
Report Name |
Radar Market |
|
The Market size value in 2019 |
32.56 Billion USD |
|
The Revenue forecast in 2028 |
44.35 Billion USD |
|
Growth Rate |
CAGR of 4.7% from 2020 to 2028 |
|
Base year considered |
2019 |
|
Forecast period |
2020-2028 |
|
Forecast units |
Value (USD) |
|
Segments covered |
By Platforms, By Product Type, By Application and By End User |
|
Report coverage |
Revenue & volume forecast, company share, competitive landscape, growth factors, and trends |
|
Geographic regions covered |
North America, Europe, Asia Pacific, Latin America, Middle East & Africa |
|
Companies covered |
Northrop Grumman Corporation, Lockheed Martin Corporation, SAAB AB, Rockwell Collins Inc., Thales Group, Honeywell International Inc., L-3 Communications Holdings, General Dynamics Corporation, Dassault Aviation, BAE Systems. |
Ans:The global radar market size was valued at $32.56 billion in 2019, and is projected to reach $44.35 billion by 2028, registering a CAGR of 4.7% from 2021 to 2028.
Ans: Some of the major key companies such as Northrop Grumman Corporation, Lockheed Martin Corporation, SAAB AB, Rockwell Collins Inc., Thales Group, Honeywell International Inc., L-3 Communications Holdings, General Dynamics Corporation, Dassault Aviation, BAE Systems.
Ans:Asia-Pacific region would exhibit the highest CAGR of 6.4% during 2021-2028
Chapter 1:Introduction
1.1.Report description
1.2.Key benefits for stakeholders
1.3.Key market segments
1.4.Research methodology
1.4.1.Primary research
1.4.2.Secondary research
1.4.3.Analyst tools and models
Chapter 2:Executive summary
2.1.CXO perspective
Chapter 3:MARKET OVERVIEW
3.1.Market definition and scope
3.2.Key findings
3.2.1.Top impacting factors
3.2.2.Top investment pockets
3.3.Patent analysis
3.3.1.By region, 2019
3.3.2.By applicant, 2019
3.4.Porter’s five forces analysis
3.5.Market dynamics
3.5.1.Drivers
3.5.1.1.Increase in demand for radar systems in automotive and defense industries
3.5.1.2.Advancements in radar technology
3.5.1.3.Increase in territorial battles
3.5.2.Restraint
3.5.2.1.High cost of radar system
3.5.3.Opportunity
3.5.3.1.High investment from developed countries in military sector
3.6.COVID-19 Impact Analysis
Chapter 4:radar MARKET, BY offering
4.1.Overview
4.2.Hardware
4.2.1.Key market trends, growth factors, and opportunities
4.2.2.Market size and forecast, by region
4.2.3.Market size and forecast, by sub type
4.2.3.1.Antenna
4.2.3.1.1.Market size and forecast, by region
4.2.3.1.2.Market size and forecast, by end use
4.2.3.2.Transmitter
4.2.3.2.1.Market size and forecast, by region
4.2.3.2.2.Market size and forecast, by end use
4.2.3.3.Receiver
4.2.3.3.1.Market size and forecast, by region
4.2.3.3.2.Market size and forecast, by end use
4.2.3.4.Duplexer
4.2.3.4.1.Market size and forecast, by region
4.2.3.4.2.Market size and forecast, by end use
4.2.3.5.Others
4.2.3.5.1.Market size and forecast, by region
4.2.3.5.2.Market size and forecast, by end use
4.2.4.Market analysis, by country
4.3.Software
4.3.1.Key market trends, growth factors, and opportunities
4.3.2.Market size and forecast, by region
4.3.3.Market size and forecast, by end use
4.3.4.Market analysis, by country
4.4.Services
4.4.1.Key market trends, growth factors, and opportunities
4.4.2.Market size and forecast, by region
4.4.3.Market size and forecast, by sub type
4.4.3.1.Installation services
4.4.3.2.Integration services
4.4.3.3.Others
4.4.4.Market analysis, by country
Chapter 5:radar MARKET, BY platform
5.1.Overview
5.2.Marine radar
5.2.1.Key market trends, growth factors, and opportunities
5.2.2.Market size and forecast, by region
5.2.3.Market analysis, by country
5.3.Air radar
5.3.1.Key market trends, growth factors, and opportunities
5.3.2.Market size and forecast, by region
5.3.3.Market analysis, by country
5.4.Ground radar
5.4.1.Key market trends, growth factors, and opportunities
5.4.2.Market size and forecast, by region
5.4.3.Market analysis, by country
5.5.Space radar
5.5.1.Key market trends, growth factors, and opportunities
5.5.2.Market size and forecast, by region
5.5.3.Market analysis, by country
Chapter 6:radar market, BY Product type
6.1.Overview
6.2.Continuous wave (CW) radar
6.2.1.Key market trends, growth factors, and opportunities
6.2.1.1.Unmodulated continuous wave radar
6.2.1.2.Frequency modulated continuous wave radar
6.2.2.Market size and forecast, by region
6.2.3.Market analysis, by country
6.3.Pulse radar
6.3.1.Key market trends, growth factors, and opportunities
6.3.1.1.Moving target indication radar
6.3.1.2.High pulse repetition frequency radar
6.3.2.Market size and forecast, by region
6.3.3.Market analysis, by country
6.4.Others
6.4.1.Key market trends, growth factors, and opportunities
6.4.2.Market size and forecast, by region
6.4.3.Market analysis, by country
Chapter 7:radar market, BY application
7.1.Overview
7.2.Air traffic control
7.2.1.Key market trends, growth factors, and opportunities
7.2.2.Market size and forecast, by region
7.2.3.Market analysis, by country
7.3.Remote sensing
7.3.1.Key market trends, growth factors, and opportunities
7.3.2.Market size and forecast, by region
7.3.3.Market analysis, by country
7.4.Ground traffic control
7.4.1.Key market trends, growth factors, and opportunities
7.4.2.Market size and forecast, by region
7.4.3.Market analysis, by country
7.5.Space navigation & control
7.5.1.Key market trends, growth factors, and opportunities
7.5.2.Market size and forecast, by region
7.5.3.Market analysis, by country
Chapter 8:Smartwatch market, BY END User
8.1.Overview
8.2.Automotive
8.2.1.Key market trends, growth factors, and opportunities
8.2.2.Market size and forecast, by region
8.2.3.Market analysis, by country
8.3.Aviation
8.3.1.Key market trends, growth factors, and opportunities
8.3.2.Market size and forecast, by region
8.3.3.Market analysis, by country
8.4.Industrial
8.4.1.Key market trends, growth factors, and opportunities
8.4.2.Market size and forecast, by region
8.4.3.Market analysis, by country
8.5.Weather monitoring
8.5.1.Key market trends, growth factors, and opportunities
8.5.2.Market size and forecast, by region
8.5.3.Market analysis, by country
8.6.Military & defense
8.6.1.Key market trends, growth factors, and opportunities
8.6.2.Market size and forecast, by region
8.6.3.Market analysis, by country
8.7.Others
8.7.1.Key market trends, growth factors, and opportunities
8.7.2.Market size and forecast, by region
8.7.3.Market analysis, by country
Chapter 9:radar MArket, BY Region
9.1.Overview
9.2.North America
9.2.1.Key market trends, growth factors, and opportunities
9.2.2.Market size and forecast, by product type
9.2.3.Market size and forecast, by product type
9.2.4.Market size and forecast, by platform
9.2.5.Market size and forecast, by application
9.2.6.Market size and forecast, by end user
9.2.6.1.U.S.
9.2.6.1.1.Market size and forecast, by offering
9.2.6.1.2.Market size and forecast, by product type
9.2.6.1.3.Market size and forecast, by platform
9.2.6.1.4.Market size and forecast, by application
9.2.6.1.5.Market size and forecast, by end user
9.2.6.2.Canada
9.2.6.2.1.Market size and forecast, by offering
9.2.6.2.2.Market size and forecast, by product type
9.2.6.2.3.Market size and forecast, by platform
9.2.6.2.4.Market size and forecast, by application
9.2.6.2.5.Market size and forecast, by end user
9.2.6.3.Mexico
9.2.6.3.1.Market size and forecast, by offering
9.2.6.3.2.Market size and forecast, by product type
9.2.6.3.3.Market size and forecast, by platform
9.2.6.3.4.Market size and forecast, by application
9.2.6.3.5.Market size and forecast, by end user
9.3.Europe
9.3.1.Key market trends, growth factors, and opportunities
9.3.2.Market size and forecast, by offering
9.3.3.Market size and forecast, by product type
9.3.4.Market size and forecast, by platform
9.3.5.Market size and forecast, by application
9.3.6.Market size and forecast, by end user
9.3.7.Market analysis, by country
9.3.7.1.UK
9.3.7.1.1.Market size and forecast, by offering
9.3.7.1.2.Market size and forecast, by product type
9.3.7.1.3.Market size and forecast, by platform
9.3.7.1.4.Market size and forecast, by application
9.3.7.1.5.Market size and forecast, by end user
9.3.7.2.Russia
9.3.7.2.1.Market size and forecast, by offering
9.3.7.2.2.Market size and forecast, by product type
9.3.7.2.3.Market size and forecast, by platform
9.3.7.2.4.Market size and forecast, by application
9.3.7.2.5.Market size and forecast, by end user
9.3.7.3.France
9.3.7.3.1.Market size and forecast, by offering
9.3.7.3.2.Market size and forecast, by product type
9.3.7.3.3.Market size and forecast, by platform
9.3.7.3.4.Market size and forecast, by application
9.3.7.3.5.Market size and forecast, by end user
9.3.7.4.Italy
9.3.7.4.1.Market size and forecast, by offering
9.3.7.4.2.Market size and forecast, by product type
9.3.7.4.3.Market size and forecast, by platform
9.3.7.4.4.Market size and forecast, by application
9.3.7.4.5.Market size and forecast, by end user
9.3.7.5.Germany
9.3.7.5.1.Market size and forecast, by offering
9.3.7.5.2.Market size and forecast, by product type
9.3.7.5.3.Market size and forecast, by platform
9.3.7.5.4.Market size and forecast, by application
9.3.7.5.5.Market size and forecast, by end user
9.3.7.6.Rest of Europe
9.3.7.6.1.Market size and forecast, by offering
9.3.7.6.2.Market size and forecast, by product type
9.3.7.6.3.Market size and forecast, by platform
9.3.7.6.4.Market size and forecast, by application
9.3.7.6.5.Market size and forecast, by end user
9.4.Asia-Pacific
9.4.1.Key market trends, growth factors, and opportunities
9.4.2.Market size and forecast, by offering
9.4.3.Market size and forecast, by product type
9.4.4.Market size and forecast, by platform
9.4.5.Market size and forecast, by application
9.4.6.Market size and forecast, by end user
9.4.7.Market analysis, by country
9.4.7.1.China
9.4.7.1.1.Market size and forecast, by offering
9.4.7.1.2.Market size and forecast, by product type
9.4.7.1.3.Market size and forecast, by platform
9.4.7.1.4.Market size and forecast, by application
9.4.7.1.5.Market size and forecast, by end user
9.4.7.2.India
9.4.7.2.1.Market size and forecast, by offering
9.4.7.2.2.Market size and forecast, by product type
9.4.7.2.3.Market size and forecast, by platform
9.4.7.2.4.Market size and forecast, by application
9.4.7.2.5.Market size and forecast, by end user
9.4.7.3.Australia
9.4.7.3.1.Market size and forecast, by offering
9.4.7.3.2.Market size and forecast, by product type
9.4.7.3.3.Market size and forecast, by platform
9.4.7.3.4.Market size and forecast, by application
9.4.7.3.5.Market size and forecast, by end user
9.4.7.4.Japan
9.4.7.4.1.Market size and forecast, by offering
9.4.7.4.2.Market size and forecast, by product type
9.4.7.4.3.Market size and forecast, by platform
9.4.7.4.4.Market size and forecast, by application
9.4.7.4.5.Market size and forecast, by end user
9.4.7.5.South Korea
9.4.7.5.1.Market size and forecast, by offering
9.4.7.5.2.Market size and forecast, by product type
9.4.7.5.3.Market size and forecast, by platform
9.4.7.5.4.Market size and forecast, by application
9.4.7.5.5.Market size and forecast, by end user
9.4.7.6.Rest of Asia-Pacific
9.4.7.6.1.Market size and forecast, by offering
9.4.7.6.2.Market size and forecast, by product type
9.4.7.6.3.Market size and forecast, by platform
9.4.7.6.4.Market size and forecast, by application
9.4.7.6.5.Market size and forecast, by end user
9.5.LAMEA
9.5.1.Key market trends, growth factors, and opportunities
9.5.2.Market size and forecast, by offering
9.5.3.Market size and forecast, by product type
9.5.4.Market size and forecast, by platform
9.5.5.Market size and forecast, by application
9.5.6.Market size and forecast, by end user
9.5.7.Market analysis, by country
9.5.7.1.Latin America
9.5.7.1.1.Market size and forecast, by offering
9.5.7.1.2.Market size and forecast, by product type
9.5.7.1.3.Market size and forecast, by platform
9.5.7.1.4.Market size and forecast, by application
9.5.7.1.5.Market size and forecast, by end user
9.5.7.2.Middle East
9.5.7.2.1.Market size and forecast, by offering
9.5.7.2.2.Market size and forecast, by product type
9.5.7.2.3.Market size and forecast, by platform
9.5.7.2.4.Market size and forecast, by application
9.5.7.2.5.Market size and forecast, by end user
9.5.7.3.Africa
9.5.7.3.1.Market size and forecast, by offering
9.5.7.3.2.Market size and forecast, by product type
9.5.7.3.3.Market size and forecast, by platform
9.5.7.3.4.Market size and forecast, by application
9.5.7.3.5.Market size and forecast, by end user
Chapter 10:COMPETITIVE LANDSCAPE
10.1.Introduction
10.1.1.Market player positioning, 2020
10.2.Top winning strategies
10.3.Product mapping of top 10 player
10.4.Competitive dashboard
10.5.Competitive heatmap
Chapter 11:Company Profiles
11.1.BAE SYSTEMS
11.1.1.Company overview
11.1.2.Key executive
11.1.3.Company snapshot
11.1.4.Product portfolio
11.1.5.R&D expenditure
11.1.6.Business performance
11.1.7.Key strategic moves and developments
11.2.DASSAULT AVIATION
11.2.1.Company overview
11.2.2.Key executive
11.2.3.Company snapshot
11.2.4.Product portfolio
11.2.5.R&D expenditure
11.2.6.Business performance
11.3.GENERAL DYNAMICS CORPORATION
11.3.1.Company overview
11.3.2.Key executive
11.3.3.Company snapshot
11.3.4.Product portfolio
11.3.5.R&D expenditure
11.3.6.Business performance
11.3.7.Key strategic moves and developments
11.4.HONEYWELL INTERNATIONAL INC.
11.4.1.Company overview
11.4.2.Key executive
11.4.3.Company snapshot
11.4.4.Operating business segments
11.4.5.Product portfolio
11.4.6.R&D expenditure
11.4.7.Business performance
11.4.8.Key strategic moves and developments
11.5.L3HARRIS TECHNOLOGIES, INC.
11.5.1.Company overview
11.5.2.Key executive
11.5.3.Company snapshot
11.5.4.Operating business segments
11.5.5.Product portfolio
11.5.6.R&D expenditure
11.5.7.Business performance
11.5.8.Key strategic moves and developments
11.6.LOCKHEED MARTIN CORPORATION
11.6.1.Company overview
11.6.2.Key executive
11.6.3.Company snapshot
11.6.4.Operating business segments
11.6.5.Product portfolio
11.6.6.R&D expenditure
11.6.7.Business performance
11.6.8.Key strategic moves and developments
11.7.NORTHROP GRUMMAN CORPORATION
11.7.1.Company overview
11.7.2.Key executive
11.7.3.Company snapshot
11.7.4.Product portfolio
11.7.5.R&D expenditure
11.7.6.Business performance
11.7.7.Key strategic moves and developments
11.8.RAYTHEON TECHNOLOGIES CORPORATION
11.8.1.Company overview
11.8.2.Key executive
11.8.3.Company snapshot
11.8.4.Operating business segments
11.8.5.Product portfolio
11.8.6.R&D expenditure
11.8.7.Business performance
11.8.8.Key strategic moves and developments
11.9.SAAB AB
11.9.1.Company overview
11.9.2.Key executive
11.9.3.Company snapshot
11.9.4.Operating business segments
11.9.5.Product portfolio
11.9.6.R&D expenditure
11.9.7.Business performance
11.9.8.Key strategic moves and developments
11.10.THALES GROUP
11.10.1.Company overview
11.10.2.Key executive
11.10.3.Company snapshot
11.10.4.Product portfolio
11.10.5.R&D expenditure
11.10.6.Business performance
11.10.7.Key strategic moves and developments
LIST OF TABLES
TABLE 01.GLOBAL RADAR MARKET, BY PLATFORM, 2019-2028($MILLION)
TABLE 02.RADAR MARKET REVENUE FOR MARINE RADAR, BY REGION, 2019-2028 ($MILLION)
TABLE 03.RADAR MARKET REVENUE FOR AIR RADAR, BY REGION, 2019-2028 ($MILLION)
TABLE 04.RADAR MARKET REVENUE FOR GROUND RADAR, BY REGION, 2019-2028 ($MILLION)
TABLE 05.RADAR MARKET REVENUE FOR SPACE RADAR, BY REGION, 2019–2028 ($MILLION)
TABLE 06.GLOBAL RADAR MARKET, BY PRODUCT TYPE, 2019–2028 ($MILLION)
TABLE 07.RADAR MARKET REVENUE FOR CONTINUOUS WAVE RADAR, BY REGION, 2019–2028 ($MILLION)
TABLE 08.RADAR MARKET REVENUE FOR PULSE RADAR, BY REGION, 2019-2028 ($MILLION)
TABLE 09.RADAR MARKET REVENUE FOR OTHERS, BY REGION, 2019–2028 ($MILLION)
TABLE 10.GLOBAL RADAR MARKET, BY APPLICATION, 2019–2028 ($MILLION)
TABLE 11.RADAR MARKET REVENUE FOR AIR TRAFFIC CONTROL, BY REGION, 2019–2028 ($MILLION)
TABLE 12.RADAR MARKET REVENUE REMOTE SENSING, BY REGION, 2019-2028 ($MILLION)
TABLE 13.RADAR MARKET REVENUE FOR GROUND TRAFFIC CONTROL, BY REGION, 2019–2028 ($MILLION)
TABLE 14.RADAR SMARTWATCH MARKET REVENUE FOR SPACE NAVIGATION AND CONTROL, BY REGION, 2019–2028 ($MILLION)
TABLE 15.GLOBAL RADAR MARKET, BY END USER, 2019–2028 ($MILLION)
TABLE 16.RADAR MARKET REVENUE FOR AUTOMOTIVE, BY REGION, 2019–2028 ($MILLION)
TABLE 17.RADAR MARKET REVENUE FOR AVIATION, BY REGION, 2019-2028 ($MILLION)
TABLE 18.RADAR MARKET REVENUE FOR INDUSTRIAL, BY REGION, 2019–2028 ($MILLION)
TABLE 19.RADAR MARKET REVENUE FOR WEATHER MONITORING, BY REGION, 2019–2028 ($MILLION)
TABLE 20.RADAR MARKET REVENUE FOR MILITARY & DEFENSE, BY REGION, 2019–2028 ($MILLION)
TABLE 21.RADAR MARKET REVENUE FOR OTHERS, BY REGION, 2019–2028 ($MILLION)
TABLE 22.NORTH AMERICA RADAR MARKET, BY PRODUCT TYPE, 2019–2028 ($MILLION)
TABLE 23.NORTH AMERICA RADAR MARKET, BY PLATFORM, 2019–2028 ($MILLION)
TABLE 24.NORTH AMERICA RADAR MARKET, BY APPLICATION, 2019–2028 ($MILLION)
TABLE 25.NORTH AMERICA RADAR MARKET, BY END USER, 2019–2028 ($MILLION)
TABLE 26.U. S. RADAR MARKET, BY PRODUCT TYPE, 2019–2028 ($MILLION)
TABLE 27.U.S. RADAR MARKET, BY PLATFORM, 2019–2028 ($MILLION)
TABLE 28.U. S. RADAR MARKET, BY APPLICATION, 2019–2028 ($MILLION)
TABLE 29.U. S. RADAR MARKET, BY END USER, 2019–2028 ($MILLION)
TABLE 30.CANADA RADAR MARKET, BY PRODUCT TYPE, 2019–2028 ($MILLION)
TABLE 31.CANADA RADAR MARKET, BY PLATFORM, 2019–2028 ($MILLION)
TABLE 32.CANADA RADAR MARKET, BY APPLICATION, 2019–2028 ($MILLION)
TABLE 33.CANADA RADAR MARKET, BY END USER, 2019–2028 ($MILLION)
TABLE 34.MEXICO RADAR MARKET, BY PRODUCT TYPE, 2019–2028 ($MILLION)
TABLE 35.MEXICO RADAR MARKET, BY PLATFORM, 2019–2028 ($MILLION)
TABLE 36.MEXICO RADAR MARKET, BY APPLICATION, 2019–2028 ($MILLION)
TABLE 37.MEXICO RADAR MARKET, BY END USER, 2019–2028 ($MILLION)
TABLE 38.EUROPE RADAR MARKET, BY PRODUCT TYPE, 2019–2028 ($MILLION)
TABLE 39.EUROPE RADAR MARKET, BY PLATFORM, 2019–2028 ($MILLION)
TABLE 40.EUROPE RADAR MARKET, BY APPLICATION, 2019–2028 ($MILLION)
TABLE 41.EUROPE RADAR MARKET, BY END USER, 2019–2028 ($MILLION)
TABLE 42.UK RADAR MARKET, BY PRODUCT TYPE, 2019–2028 ($MILLION)
TABLE 43.UK RADAR MARKET, BY PLATFORM, 2019–2028 ($MILLION)
TABLE 44.UK RADAR MARKET, BY APPLICATION, 2019–2028 ($MILLION)
TABLE 45.UK RADAR MARKET, BY END USER, 2019–2028 ($MILLION)
TABLE 46.RUSSIA RADAR MARKET, BY PRODUCT TYPE, 2019–2028 ($MILLION)
TABLE 47.RUSSIA RADAR MARKET, BY PLATFORM, 2019–2028 ($MILLION)
TABLE 48.RUSSIA RADAR MARKET, BY APPLICATION, 2019–2028 ($MILLION)
TABLE 49.RUSSIA RADAR MARKET, BY END USER, 2019–2028 ($MILLION)
TABLE 50.FRANCE RADAR MARKET, BY PRODUCT TYPE, 2019–2028 ($MILLION)
TABLE 51.FRANCE RADAR MARKET, BY PLATFORM, 2019–2028 ($MILLION)
TABLE 52.FRANCE RADAR MARKET, BY APPLICATION, 2019–2028 ($MILLION)
TABLE 53.FRANCE RADAR MARKET, BY END USER, 2019–2028 ($MILLION)
TABLE 54.ITALY RADAR MARKET, BY PRODUCT TYPE, 2019–2028 ($MILLION)
TABLE 55.ITALY RADAR MARKET, BY PLATFORM, 2019–2028 ($MILLION)
TABLE 56.ITALY RADAR MARKET, BY APPLICATION, 2019–2028 ($MILLION)
TABLE 57.ITALY RADAR MARKET, BY END USER, 2019–2028 ($MILLION)
TABLE 58.GERMANY RADAR MARKET, BY PRODUCT TYPE, 2019–2028 ($MILLION)
TABLE 59.GERMANY RADAR MARKET, BY PLATFORM, 2019–2028 ($MILLION)
TABLE 60.GERMANY RADAR MARKET, BY APPLICATION, 2019–2028 ($MILLION)
TABLE 61.GERMANY RADAR MARKET, BY END USER, 2019–2028 ($MILLION)
TABLE 62.REST OF EUROPE RADAR MARKET, BY PRODUCT TYPE, 2019–2028 ($MILLION)
TABLE 63.REST OF EUROPE RADAR MARKET, BY PLATFORM, 2019–2028 ($MILLION)
TABLE 64.REST OF EUROPE RADAR MARKET, BY APPLICATION, 2019–2028 ($MILLION)
TABLE 65.REST OF EUROPE RADAR MARKET, BY END USER, 2019–2028 ($MILLION)
TABLE 66.ASIA-PACIFIC RADAR MARKET, BY PRODUCT TYPE, 2019–2028 ($MILLION)
TABLE 67.ASIA-PACIFIC RADAR MARKET, BY PLATFORM, 2019–2028 ($MILLION)
TABLE 68.ASIA-PACIFIC RADAR MARKET, BY APPLICATION, 2019–2028 ($MILLION)
TABLE 69.ASIA-PACIFIC RADAR MARKET, BY END USER, 2019–2028 ($MILLION)
TABLE 70.CHINA RADAR MARKET, BY PRODUCT TYPE, 2019–2028 ($MILLION)
TABLE 71.CHINA RADAR MARKET, BY PLATFORM, 2019–2028 ($MILLION)
TABLE 72.CHINA RADAR MARKET, BY APPLICATION, 2019–2028 ($MILLION)
TABLE 73.CHINA RADAR MARKET, BY END USER, 2019–2028 ($MILLION)
TABLE 74.INDIA RADAR MARKET, BY PRODUCT TYPE, 2019–2028 ($MILLION)
TABLE 75.INDIA RADAR MARKET, BY PLATFORM, 2019–2028 ($MILLION)
TABLE 76.INDIA RADAR MARKET, BY APPLICATION, 2019–2028 ($MILLION)
TABLE 77.INDIA RADAR MARKET, BY END USER, 2019–2028 ($MILLION)
TABLE 78.AUSTRALIA RADAR MARKET, BY PRODUCT TYPE, 2019–2028 ($MILLION)
TABLE 79.AUSTRALIA RADAR MARKET, BY PLATFORM, 2019–2028 ($MILLION)
TABLE 80.AUSTRALIA RADAR MARKET, BY APPLICATION, 2019–2028 ($MILLION)
TABLE 81.AUSTRALIA RADAR MARKET, BY END USER, 2019–2028 ($MILLION)
TABLE 82.JAPAN RADAR MARKET, BY PRODUCT TYPE, 2019–2028 ($MILLION)
TABLE 83.JAPAN RADAR MARKET, BY PLATFORM, 2019–2028 ($MILLION)
TABLE 84.JAPAN RADAR MARKET, BY APPLICATION, 2019–2028 ($MILLION)
TABLE 85.JAPAN RADAR MARKET, BY END USER, 2019–2028 ($MILLION)
TABLE 86.SOUTH KOREA RADAR MARKET, BY PRODUCT TYPE, 2019–2028 ($MILLION)
TABLE 87.SOUTH KOREA RADAR MARKET, BY PLATFORM, 2019–2028 ($MILLION)
TABLE 88.SOUTH KOREA RADAR MARKET, BY APPLICATION, 2019–2028 ($MILLION)
TABLE 89.SOUTH KOREA RADAR MARKET, BY END USER, 2019–2028 ($MILLION)
TABLE 90.REST OF ASIA-PACIFIC RADAR MARKET, BY PRODUCT TYPE, 2019–2028 ($MILLION)
TABLE 91.REST OF ASIA-PACIFIC RADAR MARKET, BY PLATFORM, 2019–2028 ($MILLION)
TABLE 92.REST OF ASIA-PACIFIC RADAR MARKET, BY APPLICATION, 2019–2028 ($MILLION)
TABLE 93.REST OF ASIA-PACIFIC RADAR MARKET, BY END USER, 2019–2028 ($MILLION)
TABLE 94.LAMEA RADAR MARKET, BY PRODUCT TYPE, 2019–2028 ($MILLION)
TABLE 95.LAMEA RADAR MARKET, BY PLATFORM, 2019–2028 ($MILLION)
TABLE 96.LAMEA RADAR MARKET, BY APPLICATION, 2019–2028 ($MILLION)
TABLE 97.LAMEA RADAR MARKET, BY END USER, 2019–2028 ($MILLION)
TABLE 98.LATIN AMERICA RADAR MARKET, BY PRODUCT TYPE, 2019–2028 ($MILLION)
TABLE 99.LATIN AMERICA RADAR MARKET, BY PLATFORM, 2019–2028 ($MILLION)
TABLE 100.LATIN AMERICA RADAR MARKET, BY APPLICATION, 2019–2028 ($MILLION)
TABLE 101.LATIN AMERICA RADAR MARKET, BY END USER, 2019–2028 ($MILLION)
TABLE 102.MIDDLE EAST RADAR MARKET, BY PRODUCT TYPE, 2019–2028 ($MILLION)
TABLE 103.MIDDLE EAST RADAR MARKET, BY PLATFORM, 2019–2028 ($MILLION)
TABLE 104.MIDDLE EAST RADAR MARKET, BY APPLICATION, 2019–2028 ($MILLION)
TABLE 105.MIDDLE EAST RADAR MARKET, BY END USER, 2019–2028 ($MILLION)
TABLE 106.AFRICA RADAR MARKET, BY PRODUCT TYPE, 2019–2028 ($MILLION)
TABLE 107.AFRICA RADAR MARKET, BY PLATFORM, 2019–2028 ($MILLION)
TABLE 108.AFRICA RADAR MARKET, BY APPLICATION, 2019–2028 ($MILLION)
TABLE 109.AFRICA RADAR MARKET, BY END USER, 2019–2028 ($MILLION)
TABLE 110.BAE SYSTEMS: KEY EXECUTIVE
TABLE 111.BAE SYSTEMS: COMPANY SNAPSHOT
TABLE 112.BAE SYSTEMS: PRODUCT PORTFOLIO
TABLE 113.BAE SYSTEMS: R&D EXPENDITURE, 2018–2020 ($MILLION)
TABLE 114.BAE SYSTEMS: NET SALES, 2018–2020 ($MILLION)
TABLE 115.DASSAULT AVIATION: KEY EXECUTIVE
TABLE 116.DASSAULT AVIATION: COMPANY SNAPSHOT
TABLE 117.DASSAULT AVIATION: PRODUCT PORTFOLIO
TABLE 118.DASSAULT AVIATION: R&D EXPENDITURE, 2018–2020 ($MILLION)
TABLE 119.DASSAULT AVIATION: NET SALES, 2018–2020 ($MILLION)
TABLE 120.GENERAL DYNAMICS CORPORATION: KEY EXECUTIVE
TABLE 121.GENERAL DYNAMICS CORPORATION: COMPANY SNAPSHOT
TABLE 122.GENERAL DYNAMICS CORPORATION: PRODUCT PORTFOLIO
TABLE 123.GENERAL DYNAMICS CORPORATION: R&D EXPENDITURE, 2018–2020 ($MILLION)
TABLE 124.GENERAL DYNAMICS CORPORATION: NET SALES, 2018–2020 ($MILLION)
TABLE 125.HONEYWELL: KEY EXECUTIVE
TABLE 126.HONEYWELL: COMPANY SNAPSHOT
TABLE 127.HONEYWELL: OPERATING SEGMENTS
TABLE 128.HONEYWELL: PRODUCT PORTFOLIO
TABLE 129.HONEYWELL: R&D EXPENDITURE, 2018–2020 ($MILLION)
TABLE 130.LOCKHEED MARTIN CORPORATION: KEY EXECUTIVE
TABLE 131.LOCKHEED MARTIN CORPORATION: COMPANY SNAPSHOT
TABLE 132.LOCKHEED MARTIN CORPORATION: OPERATING SEGMENTS
TABLE 133.LOCKHEED MARTIN CORPORATION: PRODUCT PORTFOLIO
TABLE 134.L3 TECHNOLOGIES, INC.: KEY EXECUTIVE
TABLE 135.L3 TECHNOLOGIES, INC.: COMPANY SNAPSHOT
TABLE 136.L3 TECHNOLOGIES, INC.: OPERATING SEGMENTS
TABLE 137.L3 TECHNOLOGIES, INC.: PRODUCT PORTFOLIO
TABLE 138.L3 TECHNOLOGIES, INC.: R&D EXPENDITURE, 2018–2020 ($MILLION)
TABLE 139.L3 TECHNOLOGIES, INC.: NET SALES, 2018–2020 ($MILLION)
TABLE 140.NORTHROP GRUMMAN CORPORATION: KEY EXECUTIVE
TABLE 141.NORTHROP GRUMMAN CORPORATION: COMPANY SNAPSHOT
TABLE 142.NORTHROP GRUMMAN CORPORATION: PRODUCT PORTFOLIO
TABLE 143.NORTHROP GRUMMAN CORPORATION: R&D EXPENDITURE, 2018–2020 ($MILLION)
TABLE 144.NORTHROP GRUMMAN CORPORATION: NET SALES, 2018–2020 ($MILLION)
TABLE 145.NORTHROP GRUMMAN CORPORATION: KEY STRATEGIC MOVES AND DEVELOPMENTS
TABLE 146.ROCKWELL COLLINS, INC: KEY EXECUTIVE
TABLE 147.ROCKWELL COLLINS, INC.: COMPANY SNAPSHOT
TABLE 148.ROCKWELL COLLINS, INC: PRODUCT PORTFOLIO
TABLE 149.SAAB AB: KEY EXECUTIVE
TABLE 150.SAAB AB: COMPANY SNAPSHOT
TABLE 151.SAAB AB: OPERATING SEGMENTS
TABLE 152.SAAB AB: PRODUCT PORTFOLIO
TABLE 153.SAAB AB: R&D EXPENDITURE, 2018–2020 ($MILLION)
TABLE 154.SAAB AB: REVENUE, 2018–2020 ($MILLION)
TABLE 155.SAAB AB: KEY STRATEGIC MOVES AND DEVELOPMENTS
TABLE 156.THALES GROUP: KEY EXECUTIVE
TABLE 157.THALES GROUP: COMPANY SNAPSHOT
TABLE 158.THALES GROUP: PRODUCT PORTFOLIO
TABLE 159.THALES GROUP: R&D EXPENDITURE, 2018–2020 ($MILLION)
TABLE 160.THALES GROUP: NET SALES, 2018–2020 ($MILLION)
LIST OF FIGURES
FIGURE 01.KEY MARKET SEGMENTS
FIGURE 02.GLOBAL RADAR MARKET, BY SEGMENT
FIGURE 03.RADAR MARKET, BY REGION
FIGURE 04.TOP IMPACTING FACTORS
FIGURE 05.TOP INVESTMENT POCKETS
FIGURE 06.PATENT ANALYSIS, BY COUNTRY
FIGURE 07.PATENT ANALYSIS, BY APPLICANT
FIGURE 08.TOP WINNING STRATEGIES, BY YEAR, 2017–2021*
FIGURE 09.TOP WINNING STRATEGIES, BY DEVELOPMENT, 2017–2021*
FIGURE 10.TOP WINNING STRATEGIES, BY COMPANY, 2017–2021*
FIGURE 11.MODERATE-TO-HIGH BARGAINING POWER OF SUPPLIERS
FIGURE 12.MODERATE THREAT OF NEW ENTRANTS
FIGURE 13.LOW-TO-MODERATE THREAT OF SUBSTITUTES
FIGURE 14.MODERATE INTENSITY OF RIVALRY
FIGURE 15.LOW-TO-MODERATE BARGAINING POWER OF BUYERS
FIGURE 16.GLOBAL RADAR MARKET SHARE, BY PLATFORM, 2019–2028 (%)
FIGURE 17.COMPARATIVE SHARE ANALYSIS OF RADAR MARKET FOR MARINE RADAR, BY COUNTRY, 2019 & 2028 (%)
FIGURE 18.COMPARATIVE SHARE ANALYSIS OF RADAR MARKET FOR AIR RADAR, BY COUNTRY, 2019 & 2028 (%)
FIGURE 19.COMPARATIVE SHARE ANALYSIS OF RADAR MARKET FOR GROUND RADAR, BY COUNTRY, 2019 & 2028 (%)
FIGURE 20.COMPARATIVE SHARE ANALYSIS OF RADAR FOR SPACE RADAR, BY COUNTRY, 2019 & 2028 (%)
FIGURE 21.GLOBAL RADAR MARKET SHARE, BY PRODUCT TYPE, 2019–2028 (%)
FIGURE 22.COMPARATIVE SHARE ANALYSIS OF RADAR MARKET FOR CONTINUOUS WAVE RADAR, BY COUNTRY, 2019 & 2028 (%)
FIGURE 23.COMPARATIVE SHARE ANALYSIS OF RADAR MARKET FOR PULSE RADAR, BY COUNTRY, 2019 & 2028 (%)
FIGURE 24.COMPARATIVE SHARE ANALYSIS OF RADAR MARKET FOR OTHERS, BY COUNTRY, 2019 & 2028 (%)
FIGURE 25.GLOBAL RADAR MARKET SHARE, BY APPLICATION, 2019–2028 (%)
FIGURE 26.COMPARATIVE SHARE ANALYSIS OF RADAR MARKET FOR AIR TRAFFIC CONTROL, BY COUNTRY, 2019 & 2028 (%)
FIGURE 27.COMPARATIVE SHARE ANALYSIS OF RADAR MARKET FOR REMOTE SENSING, BY COUNTRY, 2019 & 2028 (%)
FIGURE 28.COMPARATIVE SHARE ANALYSIS OF RADAR MARKET FOR GROUND TRAFFIC CONTROL, BY COUNTRY, 2019 & 2028 (%)
FIGURE 29.COMPARATIVE SHARE ANALYSIS OF SMARTWATCH FOR SPACE NAVIGATION AND CONTROL, BY COUNTRY, 2019 & 2028 (%)
FIGURE 30.GLOBAL RADAR MARKET SHARE, BY END USER, 2019–2028 (%)
FIGURE 31.COMPARATIVE SHARE ANALYSIS OF RADAR MARKET FOR AUTOMOTIVE, BY COUNTRY, 2019 & 2028 (%)
FIGURE 32.COMPARATIVE SHARE ANALYSIS OF RADAR MARKET FOR AVIATION, BY COUNTRY, 2019 & 2028 (%)
FIGURE 33.COMPARATIVE SHARE ANALYSIS OF RADAR MARKET FOR INDUSTRIAL, BY COUNTRY, 2019 & 2028 (%)
FIGURE 34.COMPARATIVE SHARE ANALYSIS OF RADAR MARKET FOR WEATHER MONITORING, BY COUNTRY, 2019 & 2028 (%)
FIGURE 35.COMPARATIVE SHARE ANALYSIS OF RADAR MARKET FOR MILITARY & DEFENSE, BY COUNTRY, 2019 & 2028 (%)
FIGURE 36.COMPARATIVE SHARE ANALYSIS OF RADAR MARKET FOR OTHERS, BY COUNTRY, 2019 & 2028 (%)
FIGURE 37.RADAR MARKET, BY REGION, 2019-2028 (%)
FIGURE 38.COMPARATIVE SHARE ANALYSIS OF NORTH AMERICA RADAR MARKET, BY COUNTRY, 2019–2028 (%)
FIGURE 39.U. S. RADAR MARKET, 2019–2028 ($MILLION)
FIGURE 40.CANADA RADAR MARKET, 2019–2028 ($MILLION)
FIGURE 41.MEXICO RADAR MARKET, 2019–2028 ($MILLION)
FIGURE 42.COMPARATIVE SHARE ANALYSIS OF EUROPE RADAR MARKET, BY COUNTRY, 2019–2028 (%)
FIGURE 43.UK RADAR MARKET, 2019–2028 ($MILLION)
FIGURE 44.RUSSIA RADAR MARKET, 2019–2028 ($MILLION)
FIGURE 45.FRANCE RADAR MARKET, 2019–2028 ($MILLION)
FIGURE 46.ITALY RADAR MARKET, 2019–2028 ($MILLION)
FIGURE 47.GERMANY RADAR MARKET, 2019–2028 ($MILLION)
FIGURE 48.REST OF EUROPE RADAR MARKET, 2019–2028 ($MILLION)
FIGURE 49.COMPARATIVE SHARE ANALYSIS OF ASIA-PACIFIC RADAR MARKET, BY COUNTRY, 2019–2028 (%)
FIGURE 50.CHINA RADAR MARKET, 2019–2028 ($MILLION)
FIGURE 51.INDIA RADAR MARKET, 2019–2028 ($MILLION)
FIGURE 52.AUSTRALIA RADAR MARKET, 2019–2028 ($MILLION)
FIGURE 53.JAPAN RADAR MARKET, 2019–2028 ($MILLION)
FIGURE 54.SOUTH KOREA RADAR MARKET, 2019–2028 ($MILLION)
FIGURE 55.REST OF ASIA-PACIFIC RADAR MARKET, 2019–2028 ($MILLION)
FIGURE 56.COMPARATIVE SHARE ANALYSIS OF LAMEA RADAR MARKET, BY COUNTRY, 2019–2028 (%)
FIGURE 57.LATIN AMERICA RADAR MARKET, 2019–2028 ($MILLION)
FIGURE 58.MIDDLE EAST RADAR MARKET, 2019–2028 ($MILLION)
FIGURE 59.AFRICA RADAR MARKET, 2019–2028 ($MILLION)
FIGURE 60.MARKET PLAYER POSITIONING, 2020
FIGURE 61.PRODUCT MAPPING OF TOP 10 PLAYERS
FIGURE 62.COMPETITIVE DASHBOARD OF KEY PLAYER
FIGURE 63.COMPETITIVE HEATMAP OF KEY PLAYERS
FIGURE 64.BAE SYSTEMS: R&D EXPENDITURE, 2018–2020 ($MILLION)
FIGURE 65.BAE SYSTEMS: REVENUE, 2018-2020 (($MILLION)
FIGURE 66.BAE SYSTEMS: REVENUE SHARE BY SEGMENT, 2020 (%)
FIGURE 67.BAE SYSTEMS: REVENUE SHARE BY REGION, 2020 (%)
FIGURE 68.DASSAULT AVIATION: R&D EXPENDITURE, 2018–2020 ($MILLION)
FIGURE 69.DASSAULT AVIATION: REVENUE, 2018-2020 (($MILLION)
FIGURE 70.DASSAULT AVIATION: REVENUE SHARE BY SEGMENT, 2020 (%)
FIGURE 71.DASSAULT AVIATION: REVENUE SHARE BY REGION, 2020 (%)
FIGURE 72.GENERAL DYNAMICS CORPORATION: R&D EXPENDITURE, 2018–2020 ($MILLION)
FIGURE 73.GENERAL DYNAMICS CORPORATION: REVENUE, 2018-2020 (($MILLION)
FIGURE 74.GENERAL DYNAMICS CORPORATION: REVENUE SHARE BY SEGMENT, 2020 (%)
FIGURE 75.GENERAL DYNAMICS CORPORATION: REVENUE SHARE BY REGION, 2020 (%)
FIGURE 76.HONEYWELL: R&D EXPENDITURE, 2018–2020 ($MILLION)
FIGURE 77.HONEYWELL: NET SALES, 2018–2020 ($MILLION)
FIGURE 78.HONEYWELL: REVENUE SHARE BY SEGMENT, 2020 (%)
FIGURE 79.HONEYWELL: REVENUE SHARE BY GEOGRAPHY, 2020 (%)
FIGURE 80.R&D EXPENDITURE, 2018–2020 ($MILLION)
FIGURE 81.LOCKHEED MARTIN CORPORATION: REVENUE, 2018–2020 ($MILLION)
FIGURE 82.LOCKHEED MARTIN CORPORATION: REVENUE SHARE BY SEGMENT, 2020 (%)
FIGURE 83.LOCKHEED MARTIN CORPORATION: REVENUE SHARE BY REGION, 2020 (%)
FIGURE 84.L3 TECHNOLOGIES, INC.: R&D EXPENDITURE, 2018–2020 ($MILLION)
FIGURE 85.L3 TECHNOLOGIES, INC.: REVENUE, 2018-2020 (($MILLION)
FIGURE 86.L3 TECHNOLOGIES, INC.: REVENUE SHARE BY SEGMENT, 2020 (%)
FIGURE 87.L3 TECHNOLOGIES, INC.: REVENUE SHARE BY REGION, 2020 (%)
FIGURE 88.NORTHROP GRUMMAN CORPORATION: R&D EXPENDITURE, 2018–2020 ($MILLION)
FIGURE 89.NORTHROP GRUMMAN CORPORATION: NET SALES, 2018–2020 ($MILLION)
FIGURE 90.NORTHROP GRUMMAN CORPORATION: REVENUE SHARE BY SEGMENT, 2020 (%)
FIGURE 91.NORTHROP GRUMMAN CORPORATION: REVENUE SHARE BY REGION, 2020 (%)
FIGURE 92.ROCKWELL COLLINS, INC: R&D EXPENDITURE, 2018–2020 ($MILLION)
FIGURE 93.ROCKWELL COLLINS, INC: REVENUE, 2018–2020 ($MILLION)
FIGURE 94.ROCKWELL COLLINS, INC: REVENUE SHARE BY SEGMENT, 2020 (%)
FIGURE 95.ROCKWELL COLLINS, INC: REVENUE SHARE BY REGION, 2020 (%)
FIGURE 96.SAAB AB: R&D EXPENDITURE, 2018–2020 ($MILLION)
FIGURE 97.SAAB AB: REVENUE, 2018–2020 ($MILLION)
FIGURE 98.SAAB AB: REVENUE SHARE BY SEGMENT, 2020 (%)
FIGURE 99.SAAB AB: REVENUE SHARE BY REGION, 2020 (%)
FIGURE 100.THALES GROUP: R&D EXPENDITURE, 2018–2020 ($MILLION)
FIGURE 101.THALES GROUP: REVENUE, 2018-2020 (($MILLION)
FIGURE 102.THALES GROUP: REVENUE SHARE BY SEGMENT, 2020 (%)
FIGURE 103.THALES GROUP: REVENUE SHARE BY REGION, 2020 (%)
$5770
$6930
$10665
HAVE A QUERY?
OUR CUSTOMER

SIMILAR REPORTS