
The global thermoplastic composites market size was valued at USD 15.2 billion in 2019, and is projected to reach USD 22.8 billion by 2027, growing at a CAGR of 6.1% from 2020 to 2027. The COVID-19 pandemic has negatively affected the key sectors such as automotive, aerospace, construction, and wind energy. This is expected to hamper the growth of the global thermoplastic composites market. Composite materials are formed by combining a resin matrix, armature and operational additives. There are two types of composites – thermoset and thermoplastic composites. Thermoplastic composites developed from structural polymer composites. They are solidified through a reversible thermal curing process. In terms of physical properties, thermoplastic composites include low density, better insulation, environmental resistance, better mechanical properties, and they can be chemically unstable. Further, they are thermoformable, heat-weldable and recyclable.
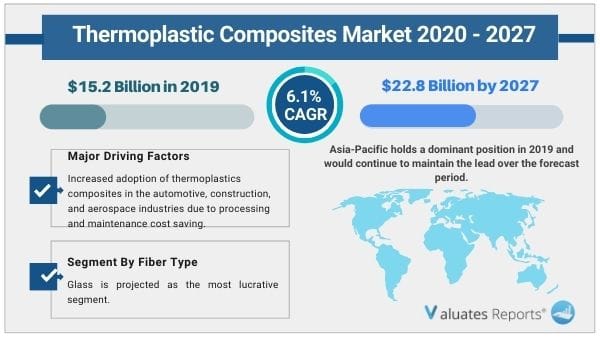
The global thermoplastic Composites market is presently driven by the automotive, construction and aerospace industries. In the aerospace & defense industry, the use of thermoplastic composites is primarily intended to minimize the total weight and corrosion in the aircraft structure. In addition, maintenance costs for aircraft produced using composites have significantly decreased compared with maintenance costs for aircraft produced using conventional materials. Thermoplastic composites have various properties including insubstantial weight, superior strength, weather-resistant finish, and various surface textures. Which in turn, the demand for thermoplastic composites in the aerospace industry is expected to grow with significant CAGR.
By 2020, the carbon emissions cap for new cars in the European Union will drop from 130 grams to 95 grams per kilometer. To achieve this target, carmakers are designing lighter vehicles by replacing metal with composites. Increase in demand in the automotive sector for high-quality composite materials is expected to direct investments in developing new manufacturing technologies. Companies such as Toray, Teijin Limited, Hexcel Corporation, and SGL Group use their proprietary composite manufacturing technologies. SGL Group cooperated with numerous research centers and academic institutions in the production and testing of thermoplastic composites.
Rise in fuel prices have prompted the need for vehicles that are fuel efficient. Thermoplastic composites are most commonly used as replacements for aluminum, wood, and steel due to their higher strength-to-weight ratio. The introduction of stringent environmental legislation in Europe compelled auto makers to use composites in the production of cars. Regulations are forcing OEMs globally, particularly in Europe, to drastically reduce the carbon dioxide (CO2) emissions from vehicles. The proposed regulations are also required in countries to increase the market for the products from this sector.
The global thermoplastic composites market is segmented into product type, fiber type, resin type, applications, and region. On the basis of fiber type, the thermoplastic composites market is divided into carbon, glass, minerals, and others. Based on product type, the market is bifurcated into glass mat thermoplastics (GMT) and advanced thermoplastic composites (ATC). By resin type, the thermoplastic composites market is divided into PA, PP, PEEK, Hybrid, and others. Based on application, the market is fragmented into oil and gas, aerospace & defense, marine, construction, military, and others. Region-wise, the market is studied across North America, Europe, Asia-Pacific, and LAMEA. Presently, North America accounts for the largest share of the market, followed by Europe and Asia-Pacific.
The global Thermoplastic Composites market is moderately consolidated, with players such as BASF SE, Celanese Corporation, DSM, DuPont, Hanwha, laxness, Mitsubishi Chemical Advanced Materials, PPG Industries, SABIC, and Solvay S.A. The global Thermoplastic Composites market report provides in-depth competitive analysis as well as profiles of these major players.
Asia-Pacific accounted for the largest revenue share in 2019, owing to the presence of well-established automotive, construction, and aerospace industries in countries such as China, India and japan.
The glass mat thermoplastics held the largest revenue share in the global thermoplastic composites market in 2019. GMTs are thermoplastic composites that are superior mechanically to injection-molded reinforced thermoplastics. They are used extensively in aerospace & defense, automotive, sporting goods, and wind turbine blades.
The glass segment held the largest revenue share in the global thermoplastic composites market in 2019. Glass fiber-based thermoplastic composites are used extensively in aerospace & defense, automotive, sporting goods, and wind turbine blades.
Based on resin type, the PEEK segment is expected to grow with healthy CAGR during the forecast period. PEEK resin based composites are increasingly being used in the civilian and military aerospace industries. Compared to other resin types, PEEK offers excellent thermal stability; hence- they are used for high temperature applications.
The aerospace and defense segment held the largest revenue share in the global thermoplastic composites market. When thermoplastic composites are mixed, the materials create a hybrid material with better structural properties, which can be used for the production of components in the aerospace industry.
Some of the major economies suffering the COVID-19 crises include Germany, France, Italy, Spain, the UK, Norway, and others. The virus outbreak has caused many industries to shut down due to lack of raw material availability and disruptions in the supply chain. The worldwide lockdown has suspended the activities of construction and many other industries which results in declining the demand for thermoplastic composite.
For many countries the economy has dropped due to the halt of several industries, especially transport and supply chain. The product’s upcoming demand is hindered, as there is no development. The demand-supply gap, disruptions in raw material procurement, price volatility, and many other factors are expected to hamper the growth of the chemical industry during the COVID-19 pandemic.
Gaps in demand-supply, price volatility, and changing government policy will affect the growth of the various end-use industries. In terms of its immediate and long-term effect on industry and consumers, the COVID-19 pandemic has outpaced any headwind ever encountered. The world economy of thermoplastic composite industries has been experiencing a rapid slowdown due to the constraints of the COVID-19 pandemic on economic activity.
Advanced materials such as carbon fiber composites and glass fiber composites are used in the production of medical devices and other equipment. Thermoplastic composite are primarily used in manufacturing, aerospace & defense, automotive, and wind energy; and as a reaction to the national lockdown, these sectors were experiencing a sudden decline in growth rates. The COVID-19 crisis has affected the chemical industry supply chain to a major extent; thus, having a major impact on raw material procurement.
|
Report Metric |
Details |
|
Report Name |
Thermoplastic Composites Market |
|
The Market size value in 2019 |
15.2 Billion USD |
|
The Revenue forecast in 2027 |
22.8 Billion USD |
|
Growth Rate |
CAGR of 6.1% from 2020 to 2027 |
|
Base year considered |
2019 |
|
Forecast period |
2020-2027 |
|
Forecast units |
Value (USD) |
|
Segments covered |
Type, End-User, Offerings, and Region |
|
Report coverage |
Revenue & volume forecast, company share, competitive landscape, growth factors, and trends |
|
Geographic regions covered |
North America, Europe, Asia Pacific, Latin America, Middle East & Africa |
|
Companies covered |
BASF SE, Celanese Corporation, DSM, DuPont, Hanwha, laxness, Mitsubishi Chemical Advanced Materials, PPG Industries, SABIC, and Solvay S.A. |
Ans. The global thermoplastic composites market size was valued at USD 15.2 billion in 2019, and is projected to reach USD 22.8 billion by 2027.
Ans. The global thermoplastic composites market is expected to grow at a compound annual growth rate of 6.1% from 2020 to 2027.
Ans. The Major key players covered are BASF SE, Celanese Corporation, DSM, DuPont, Hanwha, laxness, Mitsubishi Chemical Advanced Materials, PPG Industries, SABIC, and Solvay S.A.
CHAPTER 1:INTRODUCTION
1.1.Report description
1.2.Key benefits for stakeholders
1.3.Key market segments
1.4.Research methodology
1.4.1.Secondary research
1.4.2.Primary research
1.5.Analyst tools and models
CHAPTER 2:EXECUTIVE SUMMARY
2.1.Key findings of the study
2.2.CXO perspective
CHAPTER 3:MARKET OVERVIEW
3.1.Market definition and scope
3.2.Key findings
3.2.1.Top investment pockets
3.3.Porter’s five forces analysis
3.4.Market dynamics
3.4.1.Drivers
3.4.1.1.Rise in demand from the transportation industry to drive the demand for composites
3.4.1.2.Emerging end-use applications of fiber composites
3.4.2.Restraint
3.4.2.1.High cost of raw materials
3.4.3.Opportunity
3.4.3.1.Growing market for electric vehicles
3.5.Patent analysis, 2015–2020
3.5.1.Patent analysis, by country
3.6.Impact of government rules and regulations
3.7.Impact of Corona (COVID 19) outbreak on the thermoplastic composites market
3.8.Pricing analysis
CHAPTER 4:THERMOPLASTIC COMPOSITES MARKET, BY FIBER TYPE
4.1.Overview
4.1.1.Market size and forecast
4.2.Glass
4.2.1.Key market trends, growth factors, and opportunities
4.2.2.Market size and forecast, by region
4.2.3.Market share analysis, by country
4.3.Carbon
4.3.1.Key market trends, growth factors, and opportunities
4.3.2.Market size and forecast, by region
4.3.3.Market share analysis, by country
4.4.Mineral
4.4.1.Key market trends, growth factors, and opportunities
4.4.2.Market size and forecast, by region
4.4.3.Market share analysis, by country
4.5.Others
4.5.1.Key market trends, growth factors, and opportunities
4.5.2.Market size and forecast, by region
4.5.3.Market share analysis, by country
CHAPTER 5:THERMOPLASTIC COMPOSITES MARKET, BY PRODUCT TYPE
5.1.Overview
5.1.1.Market size and forecast
5.2.Glass mat thermoplastics (GMT)
5.2.1.Key market trends, growth factors, and opportunities
5.2.2.Market size and forecast, by region
5.2.3.Market share analysis, by country
5.3.Advanced thermoplastic composites (ATC)
5.3.1.Key market trends, growth factors, and opportunities
5.3.2.Market size and forecast, by region
5.3.3.Market share analysis, by country
CHAPTER 6:THERMOPLASTIC COMPOSITES MARKET, BY RESIN TYPE
6.1.Overview
6.1.1.Market size and forecast
6.2.PA
6.2.1.Key market trends, growth factors, and opportunities
6.2.2.Market size and forecast, by region
6.2.3.Market share analysis, by country
6.3.PP
6.3.1.Key market trends, growth factors, and opportunities
6.3.2.Market size and forecast, by region
6.3.3.Market share analysis, by country
6.4.PEEK
6.4.1.Key market trends, growth factors, and opportunities
6.4.2.Market size and forecast, by region
6.4.3.Market share analysis, by country
6.5.Hybrid
6.5.1.Key market trends, growth factors, and opportunities
6.5.2.Market size and forecast, by region
6.5.3.Market share analysis, by country
6.6.Others
6.6.1.Key market trends, growth factors, and opportunities
6.6.2.Market size and forecast, by region
6.6.3.Market share analysis, by country
CHAPTER 7:THERMOPLASTIC COMPOSITES MARKET, BY APPLICATIONS
7.1.Overview
7.1.1.Market size and forecast
7.2.Oil and gas
7.2.1.Key market trends, growth factors, and opportunities
7.2.2.Market size and forecast, by region
7.2.3.Market share analysis, by country
7.3.Aerospace and defense
7.3.1.Key market trends, growth factors, and opportunities
7.3.2.Market size and forecast, by region
7.3.3.Market share analysis, by country
7.4.Marine
7.4.1.Key market trends, growth factors, and opportunities
7.4.2.Market size and forecast, by region
7.4.3.Market share analysis, by country
7.5.Construction
7.5.1.Key market trends, growth factors, and opportunities
7.5.2.Market size and forecast, by region
7.5.3.Market share analysis, by country
7.6.Military
7.6.1.Key market trends, growth factors, and opportunities
7.6.2.Market size and forecast, by region
7.6.3.Market share analysis, by country
7.7.Others
7.7.1.Key market trends, growth factors, and opportunities
7.7.2.Market size and forecast, by region
7.7.3.Market share analysis, by country
CHAPTER 8:THERMOPLASTIC COMPOSITES MARKET, BY REGION
8.1.Overview
8.1.1.Market size and forecast, by region
8.2.North America
8.2.1.Key market trends, growth factors, and opportunities
8.2.2.Market size and forecast, by fiber type
8.2.3.Market size and forecast, by product type
8.2.4.Market size and forecast, by resin type
8.2.5.Market size and forecast, by applications
8.2.6.Market size and forecast, by country
8.2.7.U.S.
8.2.7.1.Market size and forecast, by fiber type
8.2.7.2.Market size and forecast, by product type
8.2.7.3.Market size and forecast, by resin type
8.2.7.4.Market size and forecast, by applications
8.2.8.Canada
8.2.8.1.Market size and forecast, by fiber type
8.2.8.2.Market size and forecast, by product type
8.2.8.3.Market size and forecast, by resin type
8.2.8.4.Market size and forecast, by applications
8.2.9.Mexico
8.2.9.1.Market size and forecast, by fiber type
8.2.9.2.Market size and forecast, by product type
8.2.9.3.Market size and forecast, by resin type
8.2.9.4.Market size and forecast, by applications
8.3.Europe
8.3.1.Key market trends, growth factors, and opportunities
8.3.2.Market size and forecast, by fiber type
8.3.3.Market size and forecast, by product type
8.3.4.Market size and forecast, by resin type
8.3.5.Market size and forecast, by applications
8.3.6.Market size and forecast, by country
8.3.7.Germany
8.3.7.1.Market size and forecast, by fiber type
8.3.7.2.Market size and forecast, by product type
8.3.7.3.Market size and forecast, by resin type
8.3.7.4.Market size and forecast, by applications
8.3.8.UK
8.3.8.1.Market size and forecast, by fiber type
8.3.8.2.Market size and forecast, by product type
8.3.8.3.Market size and forecast, by resin type
8.3.8.4.Market size and forecast, by applications
8.3.9.France
8.3.9.1.market size and forecast, by fiber type
8.3.9.2.Market size and forecast, by product type
8.3.9.3.Market size and forecast, by resin type
8.3.9.4.Market size and forecast, by applications
8.3.10.Spain
8.3.10.1.Market size and forecast, by fiber type
8.3.10.2.Market size and forecast, by product type
8.3.10.3.Market size and forecast, by resin type
8.3.10.4.Market size and forecast, by applications
8.3.11.Rest of Europe
8.3.11.1.Market size and forecast, by fiber type
8.3.11.2.Market size and forecast, by product type
8.3.11.3.Market size and forecast, by resin type
8.3.11.4.Market size and forecast, by applications
8.4.Asia-Pacific
8.4.1.Key market trends, growth factors, and opportunities
8.4.2.Market size and forecast, by fiber type
8.4.3.Market size and forecast, by product type
8.4.4.Market size and forecast, by resin type
8.4.5.Market size and forecast, by applications
8.4.6.Market size and forecast, by country
8.4.7.China
8.4.7.1.Market size and forecast, by fiber type
8.4.7.2.Market size and forecast, by product type
8.4.7.3.Market size and forecast, by resin type
8.4.7.4.Market size and forecast, by applications
8.4.8.Japan
8.4.8.1.Market size and forecast, by fiber type
8.4.8.2.Market size and forecast, by product type
8.4.8.3.Market size and forecast, by resin type
8.4.8.4.Market size and forecast, by applications
8.4.9.India
8.4.9.1.Market size and forecast, by fiber type
8.4.9.2.Market size and forecast, by product type
8.4.9.3.Market size and forecast, by resin type
8.4.9.4.Market size and forecast, by applications
8.4.10.South Korea
8.4.10.1.Market size and forecast, by fiber type
8.4.10.2.Market size and forecast, by product type
8.4.10.3.Market size and forecast, by resin type
8.4.10.4.Market size and forecast, by applications
8.4.11.Rest of Asia-Pacific
8.4.11.1.Market size and forecast, by fiber type
8.4.11.2.Market size and forecast, by product type
8.4.11.3.Market size and forecast, by resin type
8.4.11.4.Market size and forecast, by applications
8.5.LAMEA
8.5.1.Key market trends, growth factors, and opportunities
8.5.2.Market size and forecast, by fiber type
8.5.3.Market size and forecast, by product type
8.5.4.Market size and forecast, by resin type
8.5.5.Market size and forecast, by applications
8.5.6.Market size and forecast, by country
8.5.7.Brazil
8.5.7.1.Market size and forecast, by fiber type
8.5.7.2.Market size and forecast, by product type
8.5.7.3.Market size and forecast, by resin type
8.5.7.4.Market size and forecast, by applications
8.5.8.Saudi Arabia
8.5.8.1.Market size and forecast, by fiber type
8.5.8.2.Market size and forecast, by product type
8.5.8.3.Market size and forecast, by resin type
8.5.8.4.Market size and forecast, by applications
8.5.9.South Africa
8.5.9.1.Market size and forecast, by fiber type
8.5.9.2.Market size and forecast, by product type
8.5.9.3.Market size and forecast, by resin type
8.5.9.4.Market size and forecast, by applications
8.5.10.Rest of LAMEA
8.5.10.1.Market size and forecast, by fiber type
8.5.10.2.Market size and forecast, by product type
8.5.10.3.Market size and forecast, by resin type
8.5.10.4.Market size and forecast, by applications
CHAPTER 9:COMPETITIVE LANDSCAPE
9.1.INTRODUCTION
9.1.1.MARKET PLAYER POSITIONING, 2019
9.2.TOP WINNING STRATEGIES
9.2.1.Top winning strategies, by year
9.2.2.Top winning strategies, by development
9.2.3.Top winning strategies, by company
9.3.COMPETITIVE HEATMAP
9.4.KEY DEVELOPMENTS
9.4.1.New product launches
9.4.2.Expansions
9.4.3.Partnership
9.4.4.Joint Venture
CHAPTER 10:COMPANY PROFILES
10.1.BASF SE
10.1.1.Company overview
10.1.2.Company snapshot
10.1.3.Operating business segments
10.1.4.Product portfolio
10.1.5.Business performance
10.1.6.Key strategic moves and developments
10.2.CELANESE CORPORATION
10.2.1.Company overview
10.2.2.Company snapshot
10.2.3.Operating business segments
10.2.4.Product portfolio
10.2.5.Business performance
10.3.DSM
10.3.1.Company overview
10.3.2.Company snapshot
10.3.3.Operating business segments
10.3.4.Product portfolio
10.3.5.Business performance
10.4.DUPONT DE NEMOURS, INC.
10.4.1.Company overview
10.4.2.Company snapshot
10.4.3.Product portfolio
10.4.4.Business performance
10.5.Hanwha
10.5.1.Company overview
10.5.2.Company snapshot
10.5.3.Product portfolio
10.5.4.Business performance
10.6.LANXESS AG
10.6.1.Company overview
10.6.2.Company snapshot
10.6.3.Operating business segments
Product portfolio
10.6.4.Business performance
10.6.5.Key strategic moves and developments
10.7.MITSUBISHI CHEMICAL HOLDINGS
10.7.1.Company overview
10.7.2.Company snapshot
10.7.3.Operating business segments
10.7.4.Product portfolio
10.7.5.Business performance
10.8.PPG INDUSTRIES, INC.
10.8.1.Company overview
10.8.2.Company snapshot
10.8.3.Product portfolio
10.8.4.Business performance
10.9.SABIC
10.9.1.Company overview
10.9.2.Company snapshot
10.9.3.Operating business segments
10.9.4.Product portfolio
10.9.5.Business performance
10.9.6.Key strategic moves and developments
10.10.SOLVAY S.A.
10.10.1.Company overview
10.10.2.Company snapshot
10.10.3.Operating business segments
10.10.4.Product portfolio
10.10.5.Business performance
10.10.6.Key strategic moves and developments
LIST OF TABLES
TABLE 01.THERMOPLASTIC COMPOSITES PRICING FORECAST, BY FIBER TYPE,2019–2027 ($/KILOTON)
TABLE 02.THERMOPLASTIC COMPOSITES PRICING FORECAST, BY REGION,2019–2027 ($/KILOTON)
TABLE 03.THERMOPLASTIC COMPOSITES MARKET, BY FIBER TYPE, 2019–2027(KILOTON)
TABLE 04.THERMOPLASTIC COMPOSITES MARKET, BY FIBER TYPE, 2019–2027 ($MILLION)
TABLE 05.THERMOPLASTIC COMPOSITES MARKET FOR GLASS, BY REGION, 2019–2027(KILOTON)
TABLE 06.THERMOPLASTIC COMPOSITES MARKET FOR GLASS, BY REGION, 2019–2027 ($MILLION)
TABLE 07.THERMOPLASTIC COMPOSITES MARKET FOR CARBON, BY REGION, 2019–2027(KILOTON)
TABLE 08.THERMOPLASTIC COMPOSITES MARKET FOR CARBON, BY REGION, 2019–2027 ($MILLION)
TABLE 09.THERMOPLASTIC COMPOSITES MARKET FOR MINERAL, BY REGION, 2019–2027(KILOTON)
TABLE 10.THERMOPLASTIC COMPOSITES MARKET FOR MINERAL, BY REGION, 2019–2027 ($MILLION)
TABLE 11.THERMOPLASTIC COMPOSITES MARKET FOR OTHERS, BY REGION, 2019–2027(KILOTON)
TABLE 12.THERMOPLASTIC COMPOSITES MARKET FOR OTHERS, BY REGION, 2019–2027 ($MILLION)
TABLE 13.THERMOPLASTIC COMPOSITES MARKET, BY PRODUCT TYPE, 2019–2027(KILOTON)
TABLE 14.THERMOPLASTIC COMPOSITES MARKET, BY PRODUCT TYPE, 2019–2027 ($MILLION)
TABLE 15.THERMOPLASTIC COMPOSITES MARKET FOR GLASS MAT THERMOPLASTICS (GMT), BY REGION, 2019–2027(KILOTON)
TABLE 16.THERMOPLASTIC COMPOSITES MARKET FOR GLASS MAT THERMOPLASTICS (GMT), BY REGION, 2019–2027 ($MILLION)
TABLE 17.THERMOPLASTIC COMPOSITES MARKET FOR ADVANCED THERMOPLASTIC COMPOSITES (ATC), BY REGION, 2019–2027(KILOTON)
TABLE 18.THERMOPLASTIC COMPOSITES MARKET FOR ADVANCED THERMOPLASTIC COMPOSITES (ATC), BY REGION, 2019–2027 ($MILLION)
TABLE 19.THERMOPLASTIC COMPOSITES MARKET, BY RESIN TYPE, 2019–2027(KILOTON)
TABLE 20.THERMOPLASTIC COMPOSITES MARKET, BY RESIN TYPE, 2019–2027 ($MILLION)
TABLE 21.THERMOPLASTIC COMPOSITES MARKET FOR PA, BY REGION, 2019–2027(KILOTON)
TABLE 22.THERMOPLASTIC COMPOSITES MARKET FOR PA, BY REGION, 2019–2027 ($MILLION)
TABLE 23.THERMOPLASTIC COMPOSITES MARKET FOR PP, BY REGION, 2019–2027(KILOTON)
TABLE 24.THERMOPLASTIC COMPOSITES MARKET FOR PP, BY REGION, 2019–2027 ($MILLION)
TABLE 25.THERMOPLASTIC COMPOSITES MARKET FOR PEEK, BY REGION, 2019–2027(KILOTON)
TABLE 26.THERMOPLASTIC COMPOSITES MARKET FOR PEEK, BY REGION, 2019–2027 ($MILLION)
TABLE 27.THERMOPLASTIC COMPOSITES MARKET FOR HYBRID, BY REGION, 2019–2027(KILOTON)
TABLE 28.THERMOPLASTIC COMPOSITES MARKET FOR HYBRID, BY REGION, 2019–2027 ($MILLION)
TABLE 29.THERMOPLASTIC COMPOSITES MARKET FOR OTHERS, BY REGION, 2019–2027(KILOTON)
TABLE 30.THERMOPLASTIC COMPOSITES MARKET FOR OTHERS, BY REGION, 2019–2027 ($MILLION)
TABLE 31.THERMOPLASTIC COMPOSITES MARKET, BY APPLICATIONS, 2019–2027(KILOTON)
TABLE 32.THERMOPLASTIC COMPOSITES MARKET, BY APPLICATIONS, 2019–2027 ($MILLION)
TABLE 33.THERMOPLASTIC COMPOSITES MARKET FOR OIL AND GAS, BY REGION, 2019–2027(KILOTON)
TABLE 34.THERMOPLASTIC COMPOSITES MARKET FOR OIL AND GAS, BY REGION, 2019–2027 ($MILLION)
TABLE 35.THERMOPLASTIC COMPOSITES MARKET FOR AEROSPACE AND DEFENSE, BY REGION, 2019–2027(KILOTON)
TABLE 36.THERMOPLASTIC COMPOSITES MARKET FOR AEROSPACE AND DEFENSE, BY REGION, 2019–2027 ($MILLION)
TABLE 37.THERMOPLASTIC COMPOSITES MARKET FOR MARINE, BY REGION, 2019–2027(KILOTON)
TABLE 38.THERMOPLASTIC COMPOSITES MARKET FOR MARINE, BY REGION, 2019–2027 ($MILLION)
TABLE 39.THERMOPLASTIC COMPOSITES MARKET FOR CONSTRUCTION, BY REGION, 2019–2027(KILOTON)
TABLE 40.THERMOPLASTIC COMPOSITES MARKET FOR CONSTRUCTION, BY REGION, 2019–2027 ($MILLION)
TABLE 41.THERMOPLASTIC COMPOSITES MARKET FOR MILITARY, BY REGION, 2019–2027(KILOTON)
TABLE 42.THERMOPLASTIC COMPOSITES MARKET FOR MILITARY, BY REGION, 2019–2027 ($MILLION)
TABLE 43.THERMOPLASTIC COMPOSITES MARKET FOR OTHERS, BY REGION, 2019–2027(KILOTON)
TABLE 44.THERMOPLASTIC COMPOSITES MARKET FOR OTHERS, BY REGION, 2019–2027 ($MILLION)
TABLE 45.THERMOPLASTIC COMPOSITES MARKET, BY REGION 2019–2027(KILOTON)
TABLE 46.THERMOPLASTIC COMPOSITES MARKET, BY REGION 2019–2027 ($MILLION)
TABLE 47.NORTH AMERICA THERMOPLASTIC COMPOSITES MARKET, BY FIBER TYPE, 2019–2027(KILOTON)
TABLE 48.NORTH AMERICA THERMOPLASTIC COMPOSITES MARKET, BY FIBER TYPE, 2019–2027 ($MILLION)
TABLE 49.NORTH AMERICA THERMOPLASTIC COMPOSITES MARKET, BY PRODUCT TYPE, 2019–2027(KILOTON)
TABLE 50.NORTH AMERICA THERMOPLASTIC COMPOSITES MARKET, BY PRODUCT TYPE, 2019–2027 ($MILLION)
TABLE 51.NORTH AMERICA THERMOPLASTIC COMPOSITES MARKET, BY RESIN TYPE, 2019–2027(KILOTON)
TABLE 52.NORTH AMERICA THERMOPLASTIC COMPOSITES MARKET, BY RESIN TYPE, 2019–2027 ($MILLION)
TABLE 53.NORTH AMERICA THERMOPLASTIC COMPOSITES MARKET FOR APPLICATIONS, 2019–2027 (KILOTON)
TABLE 54.NORTH AMERICA THERMOPLASTIC COMPOSITES MARKET FOR APPLICATIONS, 2019–2027 ($MILLION)
TABLE 55.NORTH AMERICA THERMOPLASTIC COMPOSITES MARKET, BY COUNTRY 2019–2027(KILOTON)
TABLE 56.NORTH AMERICA THERMOPLASTIC COMPOSITES MARKET, BY COUNTRY 2019–2027 ($MILLION)
TABLE 57.U.S. THERMOPLASTIC COMPOSITES MARKET, BY FIBER TYPE, 2019–2027(KILOTON)
TABLE 58.U.S. THERMOPLASTIC COMPOSITES MARKET, BY FIBER TYPE, 2019–2027 ($MILLION)
TABLE 59.U.S. THERMOPLASTIC COMPOSITES MARKET, BY PRODUCT TYPE, 2019–2027(KILOTON)
TABLE 60.U.S. THERMOPLASTIC COMPOSITES MARKET, BY PRODUCT TYPE, 2019–2027 ($MILLION)
TABLE 61.U.S. THERMOPLASTIC COMPOSITES MARKET, BY RESIN TYPE, 2019–2027(KILOTON)
TABLE 62.U.S. THERMOPLASTIC COMPOSITES MARKET, BY RESIN TYPE, 2019–2027 ($MILLION)
TABLE 63.U.S. THERMOPLASTIC COMPOSITES MARKET FOR APPLICATIONS, 2019–2027 (KILOTON)
TABLE 64.U.S. THERMOPLASTIC COMPOSITES MARKET FOR APPLICATIONS, 2019–2027 ($MILLION)
TABLE 65.CANADA THERMOPLASTIC COMPOSITES MARKET, BY FIBER TYPE, 2019–2027(KILOTON)
TABLE 66.CANADA THERMOPLASTIC COMPOSITES MARKET, BY FIBER TYPE, 2019–2027 ($MILLION)
TABLE 67.CANADA THERMOPLASTIC COMPOSITES MARKET, BY PRODUCT TYPE, 2019–2027(KILOTON)
TABLE 68.CANADA THERMOPLASTIC COMPOSITES MARKET, BY PRODUCT TYPE, 2019–2027 ($MILLION)
TABLE 69.CANADA THERMOPLASTIC COMPOSITES MARKET, BY RESIN TYPE, 2019–2027(KILOTON)
TABLE 70.CANADA THERMOPLASTIC COMPOSITES MARKET, BY RESIN TYPE, 2019–2027 ($MILLION)
TABLE 71.CANADA THERMOPLASTIC COMPOSITES MARKET FOR APPLICATIONS, 2019–2027 (KILOTON)
TABLE 72.CANADA THERMOPLASTIC COMPOSITES MARKET FOR APPLICATIONS, 2019–2027 ($MILLION)
TABLE 73.MEXICO THERMOPLASTIC COMPOSITES MARKET, BY FIBER TYPE, 2019–2027(KILOTON)
TABLE 74.MEXICO THERMOPLASTIC COMPOSITES MARKET, BY FIBER TYPE, 2019–2027 ($MILLION)
TABLE 75.MEXICO THERMOPLASTIC COMPOSITES MARKET, BY PRODUCT TYPE, 2019–2027(KILOTON)
TABLE 76.MEXICO THERMOPLASTIC COMPOSITES MARKET, BY PRODUCT TYPE, 2019–2027 ($MILLION)
TABLE 77.MEXICO THERMOPLASTIC COMPOSITES MARKET, BY RESIN TYPE, 2019–2027(KILOTON)
TABLE 78.MEXICO THERMOPLASTIC COMPOSITES MARKET, BY RESIN TYPE, 2019–2027 ($MILLION)
TABLE 79.MEXICO THERMOPLASTIC COMPOSITES MARKET FOR APPLICATIONS, 2019–2027 (KILOTON)
TABLE 80.MEXICO THERMOPLASTIC COMPOSITES MARKET FOR APPLICATIONS, 2019–2027 ($MILLION)
TABLE 81.EUROPE THERMOPLASTIC COMPOSITES MARKET, BY FIBER TYPE, 2019–2027(KILOTON)
TABLE 82.EUROPE THERMOPLASTIC COMPOSITES MARKET, BY FIBER TYPE, 2019–2027 ($MILLION)
TABLE 83.EUROPE THERMOPLASTIC COMPOSITES MARKET, BY PRODUCT TYPE, 2019–2027(KILOTON)
TABLE 84.EUROPE THERMOPLASTIC COMPOSITES MARKET, BY PRODUCT TYPE, 2019–2027 ($MILLION)
TABLE 85.EUROPE THERMOPLASTIC COMPOSITES MARKET, BY RESIN TYPE, 2019–2027(KILOTON)
TABLE 86.EUROPE THERMOPLASTIC COMPOSITES MARKET, BY RESIN TYPE, 2019–2027 ($MILLION)
TABLE 87.EUROPE THERMOPLASTIC COMPOSITES MARKET FOR APPLICATIONS, 2019–2027 (KILOTON)
TABLE 88.EUROPE THERMOPLASTIC COMPOSITES MARKET FOR APPLICATIONS, 2019–2027 ($MILLION)
TABLE 89.EUROPE THERMOPLASTIC COMPOSITES MARKET, BY COUNTRY 2019–2027(KILOTON)
TABLE 90.EUROPE THERMOPLASTIC COMPOSITES MARKET, BY COUNTRY 2019–2027 ($MILLION)
TABLE 91.GERMANY THERMOPLASTIC COMPOSITES MARKET, BY FIBER TYPE, 2019–2027(KILOTON)
TABLE 92.GERMANY THERMOPLASTIC COMPOSITES MARKET, BY FIBER TYPE, 2019–2027 ($MILLION)
TABLE 93.GERMANY THERMOPLASTIC COMPOSITES MARKET, BY PRODUCT TYPE, 2019–2027(KILOTON)
TABLE 94.GERMANY THERMOPLASTIC COMPOSITES MARKET, BY PRODUCT TYPE, 2019–2027 ($MILLION)
TABLE 95.GERMANY THERMOPLASTIC COMPOSITES MARKET, BY RESIN TYPE, 2019–2027(KILOTON)
TABLE 96.GERMANY THERMOPLASTIC COMPOSITES MARKET, BY RESIN TYPE, 2019–2027 ($MILLION)
TABLE 97.GERMANY THERMOPLASTIC COMPOSITES MARKET FOR APPLICATIONS, 2019–2027 (KILOTON)
TABLE 98.GERMANY THERMOPLASTIC COMPOSITES MARKET FOR APPLICATIONS, 2019–2027 ($MILLION)
TABLE 99.UK THERMOPLASTIC COMPOSITES MARKET, BY FIBER TYPE, 2019–2027(KILOTON)
TABLE 100.UK THERMOPLASTIC COMPOSITES MARKET, BY FIBER TYPE, 2019–2027 ($MILLION)
TABLE 101.UK THERMOPLASTIC COMPOSITES MARKET, BY PRODUCT TYPE, 2019–2027(KILOTON)
TABLE 102.UK THERMOPLASTIC COMPOSITES MARKET, BY PRODUCT TYPE, 2019–2027 ($MILLION)
TABLE 103.UK THERMOPLASTIC COMPOSITES MARKET, BY RESIN TYPE, 2019–2027(KILOTON)
TABLE 104.UK THERMOPLASTIC COMPOSITES MARKET, BY RESIN TYPE, 2019–2027 ($MILLION)
TABLE 105.UK THERMOPLASTIC COMPOSITES MARKET FOR APPLICATIONS, 2019–2027 (KILOTON)
TABLE 106.UK THERMOPLASTIC COMPOSITES MARKET FOR APPLICATIONS, 2019–2027 ($MILLION)
TABLE 107.FRANCE THERMOPLASTIC COMPOSITES MARKET, BY FIBER TYPE, 2019–2027(KILOTON)
TABLE 108.FRANCE THERMOPLASTIC COMPOSITES MARKET, BY FIBER TYPE, 2019–2027 ($MILLION)
TABLE 109.FRANCE THERMOPLASTIC COMPOSITES MARKET, BY PRODUCT TYPE, 2019–2027(KILOTON)
TABLE 110.FRANCE THERMOPLASTIC COMPOSITES MARKET, BY PRODUCT TYPE, 2019–2027 ($MILLION)
TABLE 111.FRANCE THERMOPLASTIC COMPOSITES MARKET, BY RESIN TYPE, 2019–2027(KILOTON)
TABLE 112.FRANCE THERMOPLASTIC COMPOSITES MARKET, BY RESIN TYPE, 2019–2027 ($MILLION)
TABLE 113.FRANCE THERMOPLASTIC COMPOSITES MARKET FOR APPLICATIONS, 2019–2027 (KILOTON)
TABLE 114.FRANCE THERMOPLASTIC COMPOSITES MARKET FOR APPLICATIONS, 2019–2027 ($MILLION)
TABLE 115.SPAIN THERMOPLASTIC COMPOSITES MARKET, BY FIBER TYPE, 2019–2027(KILOTON)
TABLE 116.SPAIN THERMOPLASTIC COMPOSITES MARKET, BY FIBER TYPE, 2019–2027 ($MILLION)
TABLE 117.SPAIN THERMOPLASTIC COMPOSITES MARKET, BY PRODUCT TYPE, 2019–2027(KILOTON)
TABLE 118.SPAIN THERMOPLASTIC COMPOSITES MARKET, BY PRODUCT TYPE, 2019–2027 ($MILLION)
TABLE 119.SPAIN THERMOPLASTIC COMPOSITES MARKET, BY RESIN TYPE, 2019–2027(KILOTON)
TABLE 120.SPAIN THERMOPLASTIC COMPOSITES MARKET, BY RESIN TYPE, 2019–2027 ($MILLION)
TABLE 121.SPAIN THERMOPLASTIC COMPOSITES MARKET FOR APPLICATIONS, 2019–2027 (KILOTON)
TABLE 122.SPAIN THERMOPLASTIC COMPOSITES MARKET FOR APPLICATIONS, 2019–2027 ($MILLION)
TABLE 123.REST OF EUROPE THERMOPLASTIC COMPOSITES MARKET, BY FIBER TYPE, 2019–2027(KILOTON)
TABLE 124.REST OF EUROPE THERMOPLASTIC COMPOSITES MARKET, BY FIBER TYPE, 2019–2027 ($MILLION)
TABLE 125.REST OF EUROPE THERMOPLASTIC COMPOSITES MARKET, BY PRODUCT TYPE, 2019–2027(KILOTON)
TABLE 126.REST OF EUROPE THERMOPLASTIC COMPOSITES MARKET, BY PRODUCT TYPE, 2019–2027 ($MILLION)
TABLE 127.REST OF EUROPE THERMOPLASTIC COMPOSITES MARKET, BY RESIN TYPE, 2019–2027(KILOTON)
TABLE 128.REST OF EUROPE THERMOPLASTIC COMPOSITES MARKET, BY RESIN TYPE, 2019–2027 ($MILLION)
TABLE 129.REST OF EUROPE THERMOPLASTIC COMPOSITES MARKET FOR APPLICATIONS, 2019–2027 (KILOTON)
TABLE 130.REST OF EUROPE THERMOPLASTIC COMPOSITES MARKET FOR APPLICATIONS, 2019–2027 ($MILLION)
TABLE 131.ASIA-PACIFIC THERMOPLASTIC COMPOSITES MARKET, BY FIBER TYPE, 2019–2027(KILOTON)
TABLE 132.ASIA-PACIFIC THERMOPLASTIC COMPOSITES MARKET, BY FIBER TYPE, 2019–2027 ($MILLION)
TABLE 133.ASIA-PACIFIC THERMOPLASTIC COMPOSITES MARKET, BY PRODUCT TYPE, 2019–2027(KILOTON)
TABLE 134.ASIA-PACIFIC THERMOPLASTIC COMPOSITES MARKET, BY PRODUCT TYPE, 2019–2027 ($MILLION)
TABLE 135.ASIA-PACIFIC THERMOPLASTIC COMPOSITES MARKET, BY RESIN TYPE, 2019–2027(KILOTON)
TABLE 136.ASIA-PACIFIC THERMOPLASTIC COMPOSITES MARKET, BY RESIN TYPE, 2019–2027 ($MILLION)
TABLE 137.ASIA-PACIFIC THERMOPLASTIC COMPOSITES MARKET FOR APPLICATIONS, 2019–2027 (KILOTON)
TABLE 138.ASIA-PACIFIC THERMOPLASTIC COMPOSITES MARKET FOR APPLICATIONS, 2019–2027 ($MILLION)
TABLE 139.ASIA-PACIFIC THERMOPLASTIC COMPOSITES MARKET, BY COUNTRY 2019–2027(KILOTON)
TABLE 140.ASIA-PACIFIC THERMOPLASTIC COMPOSITES MARKET, BY COUNTRY 2019–2027 ($MILLION)
TABLE 141.CHINA THERMOPLASTIC COMPOSITES MARKET, BY FIBER TYPE, 2019–2027(KILOTON)
TABLE 142.CHINA THERMOPLASTIC COMPOSITES MARKET, BY FIBER TYPE, 2019–2027 ($MILLION)
TABLE 143.CHINA THERMOPLASTIC COMPOSITES MARKET, BY PRODUCT TYPE, 2019–2027(KILOTON)
TABLE 144.CHINA THERMOPLASTIC COMPOSITES MARKET, BY PRODUCT TYPE, 2019–2027 ($MILLION)
TABLE 145.CHINA THERMOPLASTIC COMPOSITES MARKET, BY RESIN TYPE, 2019–2027(KILOTON)
TABLE 146.CHINA THERMOPLASTIC COMPOSITES MARKET, BY RESIN TYPE, 2019–2027 ($MILLION)
TABLE 147.CHINA THERMOPLASTIC COMPOSITES MARKET FOR APPLICATIONS, 2019–2027 (KILOTON)
TABLE 148.CHINA THERMOPLASTIC COMPOSITES MARKET FOR APPLICATIONS, 2019–2027 ($MILLION)
TABLE 149.JAPAN THERMOPLASTIC COMPOSITES MARKET, BY FIBER TYPE, 2019–2027(KILOTON)
TABLE 150.JAPAN THERMOPLASTIC COMPOSITES MARKET, BY FIBER TYPE, 2019–2027 ($MILLION)
TABLE 151.JAPAN THERMOPLASTIC COMPOSITES MARKET, BY PRODUCT TYPE, 2019–2027(KILOTON)
TABLE 152.JAPAN THERMOPLASTIC COMPOSITES MARKET, BY PRODUCT TYPE, 2019–2027 ($MILLION)
TABLE 153.JAPAN THERMOPLASTIC COMPOSITES MARKET, BY RESIN TYPE, 2019–2027(KILOTON)
TABLE 154.JAPAN THERMOPLASTIC COMPOSITES MARKET, BY RESIN TYPE, 2019–2027 ($MILLION)
TABLE 155.JAPAN THERMOPLASTIC COMPOSITES MARKET FOR APPLICATIONS, 2019–2027 (KILOTON)
TABLE 156.JAPAN THERMOPLASTIC COMPOSITES MARKET FOR APPLICATIONS, 2019–2027 ($MILLION)
TABLE 157.INDIA THERMOPLASTIC COMPOSITES MARKET, BY FIBER TYPE, 2019–2027(KILOTON)
TABLE 158.INDIA THERMOPLASTIC COMPOSITES MARKET, BY FIBER TYPE, 2019–2027 ($MILLION)
TABLE 159.INDIA THERMOPLASTIC COMPOSITES MARKET, BY PRODUCT TYPE, 2019–2027(KILOTON)
TABLE 160.INDIA THERMOPLASTIC COMPOSITES MARKET, BY PRODUCT TYPE, 2019–2027 ($MILLION)
TABLE 161.INDIA THERMOPLASTIC COMPOSITES MARKET, BY RESIN TYPE, 2019–2027(KILOTON)
TABLE 162.INDIA THERMOPLASTIC COMPOSITES MARKET, BY RESIN TYPE, 2019–2027 ($MILLION)
TABLE 163.INDIA THERMOPLASTIC COMPOSITES MARKET FOR APPLICATIONS, 2019–2027 (KILOTON)
TABLE 164.INDIA THERMOPLASTIC COMPOSITES MARKET FOR APPLICATIONS, 2019–2027 ($MILLION)
TABLE 165.SOUTH KOREA THERMOPLASTIC COMPOSITES MARKET, BY FIBER TYPE, 2019–2027(KILOTON)
TABLE 166.SOUTH KOREA THERMOPLASTIC COMPOSITES MARKET, BY FIBER TYPE, 2019–2027 ($MILLION)
TABLE 167.SOUTH KOREA THERMOPLASTIC COMPOSITES MARKET, BY PRODUCT TYPE, 2019–2027(KILOTON)
TABLE 168.SOUTH KOREA THERMOPLASTIC COMPOSITES MARKET, BY PRODUCT TYPE, 2019–2027 ($MILLION)
TABLE 169.SOUTH KOREA THERMOPLASTIC COMPOSITES MARKET, BY RESIN TYPE, 2019–2027(KILOTON)
TABLE 170.SOUTH KOREA THERMOPLASTIC COMPOSITES MARKET, BY RESIN TYPE, 2019–2027 ($MILLION)
TABLE 171.SOUTH KOREA THERMOPLASTIC COMPOSITES MARKET FOR APPLICATIONS, 2019–2027 (KILOTON)
TABLE 172.SOUTH KOREA THERMOPLASTIC COMPOSITES MARKET FOR APPLICATIONS, 2019–2027 ($MILLION)
TABLE 173.REST OF ASIA-PACIFIC THERMOPLASTIC COMPOSITES MARKET, BY FIBER TYPE, 2019–2027(KILOTON)
TABLE 174.REST OF ASIA-PACIFIC THERMOPLASTIC COMPOSITES MARKET, BY FIBER TYPE, 2019–2027 ($MILLION)
TABLE 175.REST OF ASIA-PACIFIC THERMOPLASTIC COMPOSITES MARKET, BY PRODUCT TYPE, 2019–2027(KILOTON)
TABLE 176.REST OF ASIA-PACIFIC THERMOPLASTIC COMPOSITES MARKET, BY PRODUCT TYPE, 2019–2027 ($MILLION)
TABLE 177.REST OF ASIA-PACIFIC THERMOPLASTIC COMPOSITES MARKET, BY RESIN TYPE, 2019–2027(KILOTON)
TABLE 178.REST OF ASIA-PACIFIC THERMOPLASTIC COMPOSITES MARKET, BY RESIN TYPE, 2019–2027 ($MILLION)
TABLE 179.REST OF ASIA-PACIFIC THERMOPLASTIC COMPOSITES MARKET FOR APPLICATIONS, 2019–2027 (KILOTON)
TABLE 180.REST OF ASIA-PACIFIC THERMOPLASTIC COMPOSITES MARKET FOR APPLICATIONS, 2019–2027 ($MILLION)
TABLE 181.LAMEA THERMOPLASTIC COMPOSITES MARKET, BY FIBER TYPE, 2019–2027(KILOTON)
TABLE 182.LAMEA THERMOPLASTIC COMPOSITES MARKET, BY FIBER TYPE, 2019–2027 ($MILLION)
TABLE 183.LAMEA THERMOPLASTIC COMPOSITES MARKET, BY PRODUCT TYPE, 2019–2027(KILOTON)
TABLE 184.LAMEA THERMOPLASTIC COMPOSITES MARKET, BY PRODUCT TYPE, 2019–2027 ($MILLION)
TABLE 185.LAMEA THERMOPLASTIC COMPOSITES MARKET, BY RESIN TYPE, 2019–2027(KILOTON)
TABLE 186.LAMEA THERMOPLASTIC COMPOSITES MARKET, BY RESIN TYPE, 2019–2027 ($MILLION)
TABLE 187.LAMEA THERMOPLASTIC COMPOSITES MARKET FOR APPLICATIONS, 2019–2027 (KILOTON)
TABLE 188.LAMEA THERMOPLASTIC COMPOSITES MARKET FOR APPLICATIONS, 2019–2027 ($MILLION)
TABLE 189.LAMEA THERMOPLASTIC COMPOSITES MARKET, BY COUNTRY 2019–2027(KILOTON)
TABLE 190.LAMEA THERMOPLASTIC COMPOSITES MARKET, BY COUNTRY 2019–2027 ($MILLION)
TABLE 191.BRAZIL THERMOPLASTIC COMPOSITES MARKET, BY FIBER TYPE, 2019–2027(KILOTON)
TABLE 192.BRAZIL THERMOPLASTIC COMPOSITES MARKET, BY FIBER TYPE, 2019–2027 ($MILLION)
TABLE 193.BRAZIL THERMOPLASTIC COMPOSITES MARKET, BY PRODUCT TYPE, 2019–2027(KILOTON)
TABLE 194.BRAZIL THERMOPLASTIC COMPOSITES MARKET, BY PRODUCT TYPE, 2019–2027 ($MILLION)
TABLE 195.BRAZIL THERMOPLASTIC COMPOSITES MARKET, BY RESIN TYPE, 2019–2027(KILOTON)
TABLE 196.BRAZIL THERMOPLASTIC COMPOSITES MARKET, BY RESIN TYPE, 2019–2027 ($MILLION)
TABLE 197.BRAZIL THERMOPLASTIC COMPOSITES MARKET FOR APPLICATIONS, 2019–2027 (KILOTON)
TABLE 198.BRAZIL THERMOPLASTIC COMPOSITES MARKET FOR APPLICATIONS, 2019–2027 ($MILLION)
TABLE 199.SAUDI ARABIA THERMOPLASTIC COMPOSITES MARKET, BY FIBER TYPE, 2019–2027(KILOTON)
TABLE 200.SAUDI ARABIA THERMOPLASTIC COMPOSITES MARKET, BY FIBER TYPE, 2019–2027 ($MILLION)
TABLE 201.SAUDI ARABIA THERMOPLASTIC COMPOSITES MARKET, BY PRODUCT TYPE, 2019–2027(KILOTON)
TABLE 202.SAUDI ARABIA THERMOPLASTIC COMPOSITES MARKET, BY PRODUCT TYPE, 2019–2027 ($MILLION)
TABLE 203.SAUDI ARABIA THERMOPLASTIC COMPOSITES MARKET, BY RESIN TYPE, 2019–2027(KILOTON)
TABLE 204.SAUDI ARABIA THERMOPLASTIC COMPOSITES MARKET, BY RESIN TYPE, 2019–2027 ($MILLION)
TABLE 205.SAUDI ARABIA THERMOPLASTIC COMPOSITES MARKET FOR APPLICATIONS, 2019–2027 (KILOTON)
TABLE 206.SAUDI ARABIA THERMOPLASTIC COMPOSITES MARKET FOR APPLICATIONS, 2019–2027 ($MILLION)
TABLE 207.SOUTH AFRICA THERMOPLASTIC COMPOSITES MARKET, BY FIBER TYPE, 2019–2027(KILOTON)
TABLE 208.SOUTH AFRICA THERMOPLASTIC COMPOSITES MARKET, BY FIBER TYPE, 2019–2027 ($MILLION)
TABLE 209.SOUTH AFRICA THERMOPLASTIC COMPOSITES MARKET, BY PRODUCT TYPE, 2019–2027(KILOTON)
TABLE 210.SOUTH AFRICA THERMOPLASTIC COMPOSITES MARKET, BY PRODUCT TYPE, 2019–2027 ($MILLION)
TABLE 211.SOUTH AFRICA THERMOPLASTIC COMPOSITES MARKET, BY RESIN TYPE, 2019–2027(KILOTON)
TABLE 212.SOUTH AFRICA THERMOPLASTIC COMPOSITES MARKET, BY RESIN TYPE, 2019–2027 ($MILLION)
TABLE 213.SOUTH AFRICA THERMOPLASTIC COMPOSITES MARKET FOR APPLICATIONS, 2019–2027 (KILOTON)
TABLE 214.SOUTH AFRICA THERMOPLASTIC COMPOSITES MARKET FOR APPLICATIONS, 2019–2027 ($MILLION)
TABLE 215.REST OF LAMEA THERMOPLASTIC COMPOSITES MARKET, BY FIBER TYPE, 2019–2027(KILOTON)
TABLE 216.REST OF LAMEA THERMOPLASTIC COMPOSITES MARKET, BY FIBER TYPE, 2019–2027 ($MILLION)
TABLE 217.REST OF LAMEA THERMOPLASTIC COMPOSITES MARKET, BY PRODUCT TYPE, 2019–2027(KILOTON)
TABLE 218.REST OF LAMEA THERMOPLASTIC COMPOSITES MARKET, BY PRODUCT TYPE, 2019–2027 ($MILLION)
TABLE 219.REST OF LAMEA THERMOPLASTIC COMPOSITES MARKET, BY RESIN TYPE, 2019–2027(KILOTON)
TABLE 220.REST OF LAMEA THERMOPLASTIC COMPOSITES MARKET, BY RESIN TYPE, 2019–2027 ($MILLION)
TABLE 221.REST OF LAMEA THERMOPLASTIC COMPOSITES MARKET FOR APPLICATIONS, 2019–2027 (KILOTON)
TABLE 222.REST OF LAMEA THERMOPLASTIC COMPOSITES MARKET FOR APPLICATIONS, 2019–2027 ($MILLION)
TABLE 223.KEY NEW PRODUCT LAUNCHES (2017-2020)
TABLE 224.KEY EXPANSIONS (2017-2020)
TABLE 225.PARTNERSHIP (2017-2020)
TABLE 226.JOINT VENTURE (2017-2020)
TABLE 227.BASF: COMPANY SNAPSHOT
TABLE 228.BASF: OPERATING SEGMENTS
TABLE 229.BASF: PRODUCT PORTFOLIO
TABLE 230.OVERALL FINANCIAL STATUS ($MILLION)
TABLE 231.BASF: KEY STRATEGIC MOVES AND DEVELOPMENTS
TABLE 232.CELANESE CORPORATION: COMPANY SNAPSHOT
TABLE 233.CELANESE CORPORATION: OPERATING SEGMENTS
TABLE 234.CELANESE CORPORATION: PRODUCT PORTFOLIO
TABLE 235.OVERALL FINANCIAL STATUS ($MILLION)
TABLE 236.ROYAL DSM: COMPANY SNAPSHOT
TABLE 237.ROYAL DSM: OPERATING SEGMENTS
TABLE 238.ROYAL DSM: PRODUCT PORTFOLIO
TABLE 239.OVERALL FINANCIAL STATUS ($MILLION)
TABLE 240.DUPONT DE NEMOURS, INC.: COMPANY SNAPSHOT
TABLE 241.DUPONT DE NEMOURS, INC.: PRODUCT PORTFOLIO
TABLE 242.OVERALL FINANCIAL STATUS ($MILLION)
TABLE 243.HANWHA: COMPANY SNAPSHOT
TABLE 244.HANWHA: PRODUCT PORTFOLIO
TABLE 245.OVERALL FINANCIAL STATUS ($MILLION)
TABLE 246.LANXESS: COMPANY SNAPSHOT
TABLE 247.LANXESS: OPERATING SEGMENTS
TABLE 248.LANXESS: PRODUCT PORTFOLIO
TABLE 249.OVERALL FINANCIAL STATUS ($MILLION)
TABLE 250.LANXESS: KEY STRATEGIC MOVES AND DEVELOPMENTS
TABLE 251.MITSUBISHI: COMPANY SNAPSHOT
TABLE 252.MITSUBISHI: OPERATING SEGMENTS
TABLE 253.MITSUBISHI: PRODUCT PORTFOLIO
TABLE 254.OVERALL FINANCIAL STATUS ($MILLION)
TABLE 255.PPG INDUSTRIES, INC.: COMPANY SNAPSHOT
TABLE 256.PPG: PRODUCT PORTFOLIO
TABLE 257.OVERALL FINANCIAL STATUS ($MILLION)
TABLE 258.SABIC: COMPANY SNAPSHOT
TABLE 259.SABIC: OPERATING SEGMENTS
TABLE 260.SABIC: PRODUCT PORTFOLIO
TABLE 261.SABIC: OVERALL FINANCIAL STATUS ($MILLION)
TABLE 262.SABIC: KEY STRATEGIC MOVES AND DEVELOPMENTS
TABLE 263.SOLVAY: COMPANY SNAPSHOT
TABLE 264.SOLVAY: OPERATING SEGMENTS
TABLE 265.SOLVAY: PRODUCT PORTFOLIO
TABLE 266.OVERALL FINANCIAL STATUS ($MILLION)
TABLE 267.SABIC: KEY STRATEGIC MOVES AND DEVELOPMENTS
LIST OF FIGURES
FIGURE 01.THERMOPLASTIC COMPOSITES MARKET SEGMENTATION
FIGURE 02.TOP INVESTMENT POCKETS, BY FIBER TYPE (2019)
FIGURE 03.MODERATE BARGAINING POWER OF SUPPLIERS
FIGURE 04.LOW BARGAINING POWER OF BUYERS
FIGURE 05.LOW THREAT OF NEW ENTRANTS
FIGURE 06.LOW THREAT OF SUBSTITUTES
FIGURE 07.HIGH INTENSITY OF COMPETITIVE RIVALRY
FIGURE 08.THERMOPLASTIC COMPOSITES MARKET DYNAMICS
FIGURE 09.PATENT ANALYSIS, BY COUNTRY
FIGURE 10.THERMOPLASTIC COMPOSITES MARKET REVENUE, BY FIBER TYPE, 2019–2027($MILLION)
FIGURE 11.COMPARATIVE ANALYSIS OF THERMOPLASTIC COMPOSITES MARKET FOR GLASS, BY COUNTRY, 2019 & 2027 ($MILLION)
FIGURE 12.COMPARATIVE ANALYSIS OF THERMOPLASTIC COMPOSITES MARKET FOR CARBON, BY COUNTRY, 2019& 2027 ($MILLION)
FIGURE 13.COMPARATIVE ANALYSIS OF THERMOPLASTIC COMPOSITES MARKET FOR MINERAL, BY COUNTRY, 2019 & 2027 ($MILLION)
FIGURE 14.COMPARATIVE ANALYSIS OF THERMOPLASTIC COMPOSITES MARKET FOR OTHERS, BY COUNTRY, 2019& 2027($MILLION)
FIGURE 15.THERMOPLASTIC COMPOSITES MARKET REVENUE, BY PRODUCT TYPE 2019–2027, ($MILLION)
FIGURE 16.COMPARATIVE ANALYSIS OF THERMOPLASTIC COMPOSITES MARKET FOR GLASS MAT THERMOPLASTICS (GMT), BY COUNTRY, 2019 & 2027 ($MILLION)
FIGURE 17.COMPARATIVE ANALYSIS OF THERMOPLASTIC COMPOSITES MARKET FOR ADVANCED THERMOPLASTIC COMPOSITES (ATC), BY COUNTRY, 2019 & 2027 ($MILLION)
FIGURE 18.THERMOPLASTIC COMPOSITES MARKET REVENUE, BY RESIN TYPE 2019–2027, ($MILLION)
FIGURE 19.COMPARATIVE ANALYSIS OF THERMOPLASTIC COMPOSITES MARKET FOR PA, BY COUNTRY, 2019& 2027 ($MILLION)
FIGURE 20.COMPARATIVE ANALYSIS OF THERMOPLASTIC COMPOSITES MARKET FOR PP, BY COUNTRY, 2019 & 2027 ($MILLION)
FIGURE 21.COMPARATIVE ANALYSIS OF THERMOPLASTIC COMPOSITES MARKET FOR PEEK, BY COUNTRY, 2019 & 2027 ($MILLION)
FIGURE 22.COMPARATIVE ANALYSIS OF THERMOPLASTIC COMPOSITES MARKET FOR HYBRID, BY COUNTRY, 2019 & 2027 ($MILLION)
FIGURE 23.COMPARATIVE ANALYSIS OF THERMOPLASTIC COMPOSITES MARKET FOR OTHERS, BY COUNTRY, 2019 & 2027 ($MILLION)
FIGURE 24.THERMOPLASTIC COMPOSITES MARKET REVENUE, BY APPLICATIONS 2019–2027, ($MILLION)
FIGURE 25.COMPARATIVE ANALYSIS OF THERMOPLASTIC COMPOSITES MARKET FOR OIL AND GAS, BY COUNTRY, 2019 & 2027 ($MILLION)
FIGURE 26.COMPARATIVE ANALYSIS OF THERMOPLASTIC COMPOSITES MARKET FOR AEROSPACE AND DEFENSE, BY COUNTRY, 2019 & 2027 ($MILLION)
FIGURE 27.COMPARATIVE ANALYSIS OF THERMOPLASTIC COMPOSITES MARKET FOR MARINE, BY COUNTRY, 2019 & 2027 ($MILLION)
FIGURE 28.COMPARATIVE ANALYSIS OF THERMOPLASTIC COMPOSITES MARKET FOR CONSTRUCTION, BY COUNTRY, 2019 & 2027 ($MILLION)
FIGURE 29.COMPARATIVE ANALYSIS OF THERMOPLASTIC COMPOSITES MARKET FOR MILITARY, BY COUNTRY, 2019 & 2027 ($MILLION)
FIGURE 30.COMPARATIVE ANALYSIS OF THERMOPLASTIC COMPOSITES MARKET FOR OTHERS, BY COUNTRY, 2019 & 2027 ($MILLION)
FIGURE 31.U.S. REVENUE FOR THERMOPLASTIC COMPOSITES 2019–2027, ($MILLION)
FIGURE 32.CANADA REVENUE FOR THERMOPLASTIC COMPOSITES 2019–2027, ($MILLION)
FIGURE 33.MEXICO REVENUE FOR THERMOPLASTIC COMPOSITES 2019–2027, ($MILLION)
FIGURE 34.GERMANY REVENUE FOR THERMOPLASTIC COMPOSITES 2019–2027, ($MILLION)
FIGURE 35.UK REVENUE FOR THERMOPLASTIC COMPOSITES 2019–2027, ($MILLION)
FIGURE 36.FRANCE REVENUE FOR THERMOPLASTIC COMPOSITES 2019–2027, ($MILLION)
FIGURE 37.SPAIN REVENUE FOR THERMOPLASTIC COMPOSITES 2019–2027, ($MILLION)
FIGURE 38.REST OF EUROPE REVENUE FOR THERMOPLASTIC COMPOSITES 2019–2027, ($MILLION)
FIGURE 39.CHINA REVENUE FOR THERMOPLASTIC COMPOSITES 2019–2027, ($MILLION)
FIGURE 40.JAPAN REVENUE FOR THERMOPLASTIC COMPOSITES 2019–2027, ($MILLION)
FIGURE 41.INDIA REVENUE FOR THERMOPLASTIC COMPOSITES 2019–2027, ($MILLION)
FIGURE 42.SOUTH KOREA REVENUE FOR THERMOPLASTIC COMPOSITES 2019–2027, ($MILLION)
FIGURE 43.REST OF ASIA-PACIFIC REVENUE FOR THERMOPLASTIC COMPOSITES 2019–2027, ($MILLION)
FIGURE 44.BRAZIL REVENUE FOR THERMOPLASTIC COMPOSITES 2019–2027, ($MILLION)
FIGURE 45.SAUDI ARABIA REVENUE FOR THERMOPLASTIC COMPOSITES 2019–2027, ($MILLION)
FIGURE 46.SOUTH AFRICA REVENUE FOR THERMOPLASTIC COMPOSITES 2019–2027, ($MILLION)
FIGURE 47.REST OF LAMEA REVENUE FOR THERMOPLASTIC COMPOSITES 2019–2027, ($MILLION)
FIGURE 48.MARKET PLAYER POSITIONING, 2019
FIGURE 49.TOP WINNING STRATEGIES, BY YEAR, 2017–2020
FIGURE 50.TOP WINNING STRATEGIES, BY DEVELOPMENT, 2017–2020 (%)
FIGURE 51.TOP WINNING STRATEGIES, BY COMPANY, 2017–2020
FIGURE 52.COMPETITIVE HEATMAP OF KEY PLAYERS
FIGURE 53.BASF: REVENUE, 2017–2019 ($MILLION)
FIGURE 54.BASF: REVENUE SHARE BY SEGMENT, 2019 (%)
FIGURE 55.BASF: REVENUE SHARE BY REGION, 2019 (%)
FIGURE 56.CELANESE CORPORATION: REVENUE, 2017–2019 ($MILLION)
FIGURE 57.ROYAL DSM: REVENUE, 2018–2020 ($MILLION)
FIGURE 58.ROYAL DSM: REVENUE SHARE BY SEGMENT, 2020 (%)
FIGURE 59.ROYAL DSM: REVENUE SHARE BY REGION, 2020 (%)
FIGURE 60.DUPONT DE NEMOURS, INC.: NET SALES, 2017–2019 ($MILLION)
FIGURE 61.DUPONT DE NEMOURS, INC.: REVENUE SHARE, BY SEGMENT, 2019 (%)
FIGURE 62.DUPONT DE NEMOURS, INC.: REVENUE SHARE, BY REGION, 2019 (%)
FIGURE 63.HANWHA: REVENUE, 2018–2020 ($MILLION)
FIGURE 64.LANXESS: REVENUE, 2017–2019 ($MILLION)
FIGURE 65.LANXESS: REVENUE SHARE BY SEGMENT, 2019 (%)
FIGURE 66.LANXESS: REVENUE SHARE BY REGION, 2019 (%)
FIGURE 67.MITSUBISHI: REVENUE, 2017–2019 ($MILLION)
FIGURE 68.MITSUBISHI: REVENUE SHARE BY SEGMENT, 2019 (%)
FIGURE 69.MITSUBISHI: REVENUE SHARE BY REGION, 2019 (%)
FIGURE 70.PPG INDUSTRIES, INC.: NET SALES, 2017–2019 ($MILLION)
FIGURE 71.PPG INDUSTRIES, INC.: REVENUE SHARE, BY SEGMENT, 2019 (%)
FIGURE 72.PPG INDUSTRIES, INC.: REVENUE SHARE, BY REGION, 2019 (%)
FIGURE 73.SABIC: REVENUE, 2017–2019 ($MILLION)
FIGURE 74.SABIC: REVENUE SHARE, BY SEGMENT, 2019 (%)
FIGURE 75.SABIC: REVENUE SHARE, BY REGION, 2019 (%)
FIGURE 76.SOLVAY: REVENUE, 2017–2019 ($MILLION)
FIGURE 77.SOLVAY: REVENUE SHARE BY SEGMENT, 2019 (%)
FIGURE 78.SOLVAY: REVENUE SHARE BY REGION, 2019 (%)
$5769
$6450
$9995
HAVE A QUERY?
OUR CUSTOMER

SIMILAR REPORTS