
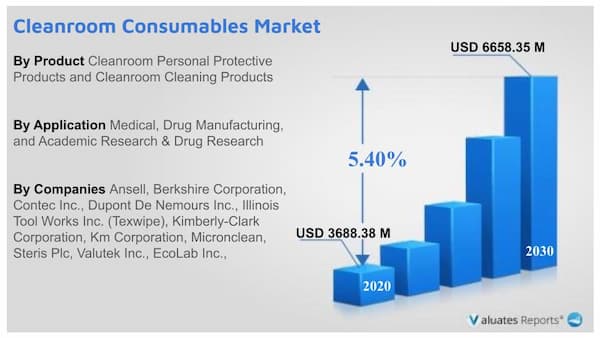
The global cleanroom consumables market was valued at $ 3688.38 million in 2020 and is projected to reach $ 6658.35 million by 2030, registering a CAGR of 5.40% from 2021 to 2030.
<
North America is expected to experience growth at the highest rate, registering a CAGR of 4.20% during the forecast period.
The expanding demand for sterilized pharmaceuticals, medical equipment, textiles, and apparel as well as regulatory compliances are major factors driving the cleanroom consumables market. Throughout the anticipated period, the market for cleanroom consumables will expand at a high rate due to rising prevalence, worries about various infectious diseases, and the effects of COVID-19.
With rules requiring the cleaning, disinfection, and protection of medical rooms from surface pollutants, pathogenic microbes, and pharmaceutical drug compositions, medical equipment sterilization has gained popularity. Additionally, the adoption of clothing in the pharmaceutical, healthcare, and biotechnology sectors has increased as a result of manufacturers' ongoing innovations for creating synthetic cleanroom overalls that require less time to put on and effectively shield workers from environmental pathogens. During the forecast period, these elements will propel the cleanroom consumables market's expansion.
The prevalence of infectious diseases and people's worries about the pandemic has caused cleanroom coverall use to skyrocket. Electrostatic technology is being used more frequently as a result of the requirement for disinfection. Also, there is a demand for masks, gowns, goggles, and gloves, and major market players are increasing production to keep up with the escalating demand from the healthcare sector. Moreover, R&D initiatives are being developed to produce covid 19 vaccines in regulated settings. The cleanroom consumables market is anticipated to grow over the projected period as a result of these factors.
Each year, there are enormous amounts of medical waste produced by cleanroom consumables, single-use PPE kits, and clothing. The waste packages must be kept in containers that can withstand punctures and leaks and that must also be frequently sanitized and cleaned. The waste itself must not corrode and cannot obstruct the airflow in the cleanrooms. Prior to full disposal, they must be transferred to a location where they can be entirely burned or repurposed. Employees in the healthcare industry must adhere to stringent regulatory guidelines while processing, packing, and labeling trash. It is necessary to construct sterile waste management procedures with designated areas for final disposal, transportation, and storage. Throughout the forecast period, these issues would likely hinder the cleanroom consumables market's growth potential.
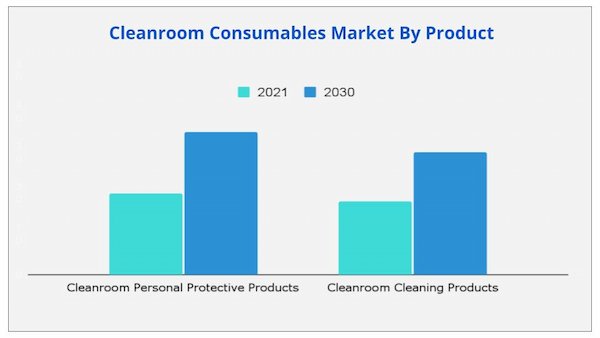
Due to the growing significance of maintaining sanitary conditions in the healthcare industry, cleanroom personal protection items held a disproportionately large market share in 2020. This trend is predicted to continue.
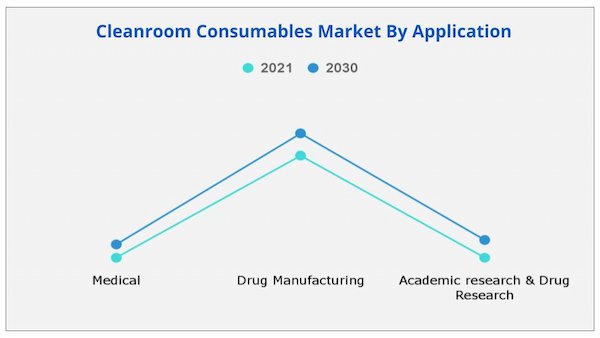
Based on application, the demand for cleanroom supplies to prevent microbiological contamination during the process is predicted to keep medication manufacturing in the lead in the cleanroom consumables market.
Due to broad usage in these sectors and stricter regulatory requirements, the pharmaceutical and biotechnology industries will offer plenty of potential for growth in the cleanroom consumables market share.
Due to rigorous laws, growing public awareness of infectious diseases, and the availability of qualified medical experts, North America is anticipated to experience the highest growth in the cleanroom consumables market share among all other regions.
| Report Metric | Details |
| Report Name | Cleanroom Consumables Market |
| Accounted market size in 2020 | US$ 3688.38 in million |
| Forecasted market size in 2030 | US$ 6658.35 million |
| CAGR | 5.40% |
| Base Year | 2020 |
| Forecasted years | 2020 - 2030 |
| Segment by Product |
|
| By End User |
|
| Segment by Application |
|
| By Region |
|
| By Company | Ansell, Berkshire Corporation, Contec Inc., Dupont De Nemours Inc., Illinois Tool Works Inc. (Texwipe), Kimberly-Clark Corporation, Km Corporation, Micronclean, Steris Plc, Valutek Inc., EcoLab Inc., |
| Forecast units | USD million in value |
| Report coverage | Revenue and volume forecast, company share, competitive landscape, growth factors and trends |
Ans: Increasing prevalence and concerns regarding various infectious diseases and covid-19 impact have significantly boosted the growth of the cleanroom consumables market during the forecast period
Ans: The global cleanroom consumables market size is estimated to grow at a CAGR of 5.40% over the forecast timeframe and reach a market value of around USD 6658.35 million by 2030.
Ans: The global cleanroom consumables market value was valued at US$ 3688.38 million in 2020.
Ans: Based on Region, North America is expected to experience growth at the highest rate, registering a CAGR of 4.20% during the forecast period.
Ans: The forecast period considered for the global cleanroom consumables market is 2021 to 2030.
Ans: Based on application, the pharmaceutical & biotechnology segment held largest cleanroom consumables market share in 2020 and is expected to remain dominant during the forecast period.
CHAPTER 1:INTRODUCTION
1.1.Report description
1.2.Key benefits for stakeholders
1.3.Key market segments
1.3.1.List of key players profiled in the report
1.4.Research methodology
1.4.1.Secondary research
1.4.2.Primary research
1.4.3.Analyst tools and models
CHAPTER 2:EXECUTIVE SUMMARY
2.1.Key findings of the study
2.2.CXO perspective
CHAPTER 3:MARKET LANDSCAPE
3.1.Market definition and scope
3.2.Key findings
3.2.1.Top investment pockets
3.2.2.Top winning strategies
3.3.Porter’s five force analysis
3.4.Top player positioning, 2020
3.5.Market dynamics
3.5.1.Drivers
3.5.1.1.Increase in adoption of cleanroom consumables in pharmaceutical & biotechnology industry
3.5.1.2.Strict regulations by regulatory authorities
3.5.1.3.Rise in health concerns
3.5.1.4.Upsurge in likelihood of epidemic or pandemic outbreaks
3.5.2.Restraints
3.5.2.1.Complicated nature of stringent regulatory norms
3.5.2.2.Environmental biohazard owing to disposable cleanroom consumables
3.5.3.Opportunity
3.5.3.1.Growth opportunities in emerging markets
3.5.4.Impact analysis
3.6.COVID-19 impact analysis on the cleanroom consumables market
CHAPTER 4:CLEANROOM CONSUMABLES MARKET, BY PRODUCT
4.1.Overview
4.1.1.Market size and forecast
4.2.Cleanroom personal protective products
4.2.1.Key market trends, growth factors, and opportunities
4.2.2.Market size and forecast, by region
4.2.3.Market analysis, by country
4.2.4.Market size and forecast, by type
4.2.5.Gloves
4.2.5.1.Market size and forecast
4.2.6.Coveralls
4.2.6.1.Market size and forecast
4.2.7.Shoe covers
4.2.7.1.Market size and forecast
4.2.8.Face masks
4.2.8.1.Market size and forecast
4.2.9.Others
4.2.9.1.Market size and forecast
4.3.Cleanroom cleaning products
4.3.1.Key market trends, growth factors, and opportunities
4.3.2.Market size and forecast
4.3.3.Market analysis, by country
4.3.4.Market size and forecast, by type
4.3.5.Wipes
4.3.5.1.Market size and forecast
4.3.6.Mops
4.3.6.1.Market size and forecast
4.3.7.Disinfectants
4.3.7.1.Market size and forecast
4.3.8.Others
4.3.8.1.Market size and forecast
CHAPTER 5:CLEANROOM CONSUMABLES MARKET, BY APPLICATION
5.1.Overview
5.1.1.Market size and forecast
5.2.Medical
5.2.1.Market size and forecast, by region
5.2.2.Market analysis, by country
5.3.Drug manufacturing
5.3.1.Market size and forecast, by region
5.3.2.Market analysis, by country
5.4.Academic research & drug research
5.4.1.Market size and forecast, by region
5.4.2.Market analysis, by country
CHAPTER 6:CLEANROOM CONSUMABLES MARKET, BY END USER
6.1.Overview
6.1.1.Market size and forecast
6.2.Pharmaceutical & biotechnology companies
6.2.1.Market size and forecast, by region
6.2.2.Market analysis, by country
6.3.Others
6.3.1.Market size and forecast
6.3.2.Market analysis, by country
CHAPTER 7:CLEANROOM CONSUMABLES MARKET, BY REGION
7.1.Overview
7.1.1.Market size and forecast
7.2.North America
7.2.1.Key market trends, growth factors, and opportunities
7.2.2.Market size and forecast, by country
7.2.2.1.U.S.
7.2.2.1.1.U.S. cleanroom consumables market, by product
7.2.2.1.2.U.S. cleanroom cleaning products market, by type
7.2.2.1.3.U.S. cleanroom consumables market, by application
7.2.2.1.4.U.S. cleanroom consumables market, by end user
7.2.2.2.Canada
7.2.2.2.1.Canada cleanroom consumables market, by product
7.2.2.2.2.Canada cleanroom cleaning products market, by type
7.2.2.2.3.Canada cleanroom consumables market, by application
7.2.2.2.4.Canada cleanroom consumables market, by end user
7.2.2.3.Mexico
7.2.2.3.1.Mexico cleanroom consumables market, by product
7.2.2.3.2.Mexico cleanroom cleaning products market, by type
7.2.2.3.3.Mexico cleanroom consumables market, by application
7.2.2.3.4.Mexico cleanroom consumables market, by end user
7.2.3.North America market size and forecast, by product
7.2.4.North America market size and forecast, by type
7.2.5.North America market size and forecast, by application
7.2.6.North America market size and forecast, by end user
7.3.Europe
7.3.1.Key market trends, growth factors, and opportunities
7.3.2.Market size and forecast, by country
7.3.2.1.Germany
7.3.2.1.1.Germany cleanroom consumables market, by product
7.3.2.1.2.Germany cleanroom cleaning products market, by type
7.3.2.1.3.Germany cleanroom consumables market, by application
7.3.2.1.4.Germany cleanroom consumables market, by end user
7.3.2.2.France
7.3.2.2.1.France cleanroom consumables market, by product
7.3.2.2.2.France cleanroom cleaning products market, by type
7.3.2.2.3.France cleanroom consumables market, by application
7.3.2.2.4.France cleanroom consumables market, by end user
7.3.2.3.UK
7.3.2.3.1.UK cleanroom consumables market, by product
7.3.2.3.2.UK cleanroom cleaning products market, by type
7.3.2.3.3.UK cleanroom consumables market, by application
7.3.2.3.4.UK cleanroom consumables market, by end user
7.3.2.4.Italy
7.3.2.4.1.Italy cleanroom consumables market, by product
7.3.2.4.2.Italy cleanroom cleaning products market, by type
7.3.2.4.3.Italy cleanroom consumables market, by application
7.3.2.4.4.Italy cleanroom consumables market, by end user
7.3.2.5.Spain
7.3.2.5.1.Spain cleanroom consumables market, by product
7.3.2.5.2.Spain cleanroom cleaning products market, by type
7.3.2.5.3.Spain cleanroom consumables market, by application
7.3.2.5.4.Spain cleanroom consumables market, by end user
7.3.2.6.Rest of Europe
7.3.2.6.1.Rest of Europe cleanroom consumables market, by product
7.3.2.6.2.Rest of Europe cleanroom cleaning products market, by type
7.3.2.6.3.Rest of Europe cleanroom consumables market, by application
7.3.2.6.4.Rest of Europe cleanroom consumables market, by end user
7.3.3.Europe market size and forecast, by product
7.3.4.Europe market size and forecast, by type
7.3.5.Europe market size and forecast, by application
7.3.6.Europe market size and forecast, by end user
7.4.Asia-Pacific
7.4.1.Key market trends, growth factors, and opportunities
7.4.2.Market size and forecast, by country
7.4.2.1.Japan
7.4.2.1.1.Japan cleanroom consumables market, by product
7.4.2.1.2.Japan cleanroom cleaning products market, by type
7.4.2.1.3.Japan cleanroom consumables market, by application
7.4.2.1.4.Japan cleanroom consumables market, by end user
7.4.2.2.China
7.4.2.2.1.China cleanroom consumables market, by product
7.4.2.2.2.China cleanroom cleaning products market, by type
7.4.2.2.3.China cleanroom consumables market, by application
7.4.2.2.4.China cleanroom consumables market, by end user
7.4.2.3.Australia
7.4.2.3.1.Australia cleanroom consumables market, by product
7.4.2.3.2.Australia cleanroom cleaning products market, by type
7.4.2.3.3.Australia cleanroom consumables market, by application
7.4.2.3.4.Australia cleanroom consumables market, by end user
7.4.2.4.India
7.4.2.4.1.India cleanroom consumables market, by product
7.4.2.4.2.India cleanroom cleaning products market, by type
7.4.2.4.3.India cleanroom consumables market, by application
7.4.2.4.4.India cleanroom consumables market, by end user
7.4.2.5.South Korea
7.4.2.5.1.South Korea cleanroom consumables market, by Product
7.4.2.5.2.South Korea cleanroom cleaning products market, by type
7.4.2.5.3.South Korea cleanroom consumables market, by application
7.4.2.5.4.South Korea cleanroom consumables market, by end user
7.4.2.6.Rest of Asia-Pacific
7.4.2.6.1.Rest of Asia-Pacific cleanroom consumables market, by product
7.4.2.6.2.Rest of Asia-Pacific cleanroom cleaning products market, by type
7.4.2.6.3.Rest of Asia-Pacific cleanroom consumables market, by application
7.4.2.6.4.Rest of Asia-Pacific cleanroom consumables market, by end user
7.4.3.Asia-Pacific market size and forecast, by product
7.4.4.Asia-Pacific market size and forecast, by type
7.4.5.Asia-Pacific market size and forecast, by application
7.4.6.Asia-Pacific market size and forecast, by end user
7.5.LAMEA
7.5.1.Key market trends, growth factors, and opportunities
CHAPTER 8:COMPANY PROFILES
8.1.ANSELL
8.1.1.Company overview
8.1.2.Company snapshot
8.1.3.Operating business segments
8.1.4.Product portfolio
8.1.5.Business performance
8.1.6.Key strategic moves and developments
8.2.BERKSHIRE CORPORATION
8.2.1.Company overview
8.2.2.Company Snapshot
8.2.3.Operating business segments
8.2.4.Product portfolio
8.3.CONTEC, INC.
8.3.1.Company overview
8.3.2.Company Snapshot
8.3.3.Operating business segments
8.3.4.Product portfolio
8.3.5.Key strategic moves and developments
8.4.DUPONT DE NEMOURS, INC.
8.4.1.Company overview
8.4.2.Company snapshot
8.4.3.Operating business segments
8.4.4.Product portfolio
8.4.5.Business performance
8.4.6.Key strategic moves and developments
8.5.ILLINOIS TOOL WORKS INC. (TEXWIPE)
8.5.1.Company overview
8.5.2.Company snapshot
8.5.3.Operating business segments
8.5.4.Product portfolio
8.5.5.Business performance
8.5.6.Key strategic moves and developments
8.6.KIMBERLY-CLARK CORPORATION
8.6.1.Company overview
8.6.2.Company snapshot
8.6.3.Operating business segments
8.6.4.Product portfolio
8.6.5.Business performance
8.6.6.Key strategic moves and developments
8.7.KM CORPORATION
8.7.1.Company overview
8.7.2.Company snapshot
8.7.3.Operating business segments
8.7.4.Product portfolio
8.8.MICRONCLEAN
8.8.1.Company overview
8.8.2.Company snapshot
8.8.3.Operating business segments
8.8.4.Product portfolio
8.8.5.Key strategic moves and developments
8.9.STERIS PLC
8.9.1.Company overview
8.9.2.Company snapshot
8.9.3.Operating business segments
8.9.4.Product portfolio
8.9.5.Business performance
8.9.6.Key strategic moves and developments
8.10.VALUTEK INC.
8.10.1.Company overview
8.10.2.Company snapshot
8.10.3.Operating business segments
8.10.4.Product portfolio
8.11.ECOLAB INC.
8.11.1.Company overview
8.11.2.Company snapshot
8.11.3.Operating business segments
8.11.4.Product portfolio
8.11.5.Business performance
LIST OF TABLES
TABLE 01.GLOBAL CLEANROOM CONSUMABLES MARKET, BY PRODUCT, 2020-2030($MILLION)
TABLE 02.CLEANROOM CONSUMABLES MARKET FOR CLEANROOM PERSONAL PROTECTIVE PRODUCTS, BY REGION, 2020-2030 ($MILLION)
TABLE 03.CLEANROOM CONSUMABLES MARKET, FOR CLEANROOM PERSONAL PROTECTIVE PRODUCT, BY TYPE, 2020–2030, ($MILLION)
TABLE 04.CLEANROOM CONSUMABLES MARKET FOR CLEANROOM CLEANING PRODUCTS, BY REGION, 2020-2030($MILLION)
TABLE 05.CLEANROOM CLEANING PRODUCT MARKET, BY TYPE, 2020–2030, ($MILLION)
TABLE 06.CLEANROOM CONSUMABLES MARKET, BY APPLICATION, 2020-2030($MILLION)
TABLE 07.CLEANROOM CONSUMABLES MARKET FOR MEDICAL, BY REGION, 2020-2030($MILLION)
TABLE 08.CLEANROOM CONSUMABLES MARKET FOR DRUG MANUFACTURING, BY REGION, 2020-2030($MILLION)
TABLE 09.CLEANROOM CONSUMABLES MARKET FOR ACADEMIC RESEARCH AND DRUG RESEARCH, BY REGION, 2020-2030($MILLION)
TABLE 10.CLEANROOM CONSUMABLES MARKET, BY END USER, 2020-2030($MILLION)
TABLE 11.CLEANROOM CONSUMABLES MARKET FOR PHARMACEUTICAL & BIOTECHNOLOGY COMPANIES, BY REGION, 2020-2030 ($MILLION)
TABLE 12.CLEANROOM CONSUMABLES MARKET FOR OTHERS, BY REGION, 2020-2030($MILLION)
TABLE 13.CLEANROOM CONSUMABLES MARKET, BY REGION, 2020-2030($MILLION)
TABLE 14.NORTH AMERICA CLEANROOM CONSUMABLES MARKET, BY COUNTRY, 2020-2030($MILLION)
TABLE 15.U.S. CLEANROOM CONSUMABLES MARKET, BY PRODUCT, 2020-2030($MILLION)
TABLE 16.U.S. CLEANROOM CLEANING PRODUCTS MARKET, BY TYPE, 2020-2030($MILLION)
TABLE 17.U.S. CLEANROOM CONSUMABLES MARKET, BY APPLICATION, 2020-2030($MILLION)
TABLE 18.U.S. CLEANROOM CONSUMABLES MARKET, BY END USER, 2020-2030($MILLION)
TABLE 19.CANADA CLEANROOM CONSUMABLES MARKET, BY PRODUCT, 2020-2030($MILLION)
TABLE 20.CANADA CLEANROOM CLEANING PRODUCTS MARKET, BY TYPE, 2020-2030($MILLION)
TABLE 21.CANADA CLEANROOM CONSUMABLES MARKET, BY APPLICATION, 2020-2030($MILLION)
TABLE 22.CANADA CLEANROOM CONSUMABLES MARKET, BY END USER, 2020-2030($MILLION)
TABLE 23.MEXICO CLEANROOM CONSUMABLES MARKET, BY PRODUCT, 2020-2030($MILLION)
TABLE 24.MEXICO CLEANROOM CLEANING PRODUCTS MARKET, BY TYPE, 2020-2030($MILLION)
TABLE 25.MEXICO CLEANROOM CONSUMABLES MARKET, BY APPLICATION, 2020-2030($MILLION)
TABLE 26.MEXICO CLEANROOM CONSUMABLES MARKET, BY END USER, 2020-2030($MILLION)
TABLE 27.NORTH AMERICA CLEANROOM CONSUMABLES MARKET, BY PRODUCT, 2020-2030($MILLION)
TABLE 28.NORTH AMERICA CLEANROOM CLEANING PRODUCTS MARKET, BY TYPE, 2020-2030($MILLION)
TABLE 29.NORTH AMERICA CLEANROOM CONSUMABLES MARKET, BY APPLICATION, 2020-2030($MILLION)
TABLE 30.NORTH AMERICA CLEANROOM CONSUMABLES MARKET, BY END USER, 2020-2030($MILLION)
TABLE 31.EUROPE CLEANROOM CONSUMABLES MARKET, BY COUNTRY, 2020-2030($MILLION)
TABLE 32.GERMANY CLEANROOM CONSUMABLES MARKET, BY PRODUCT, 2020-2030($MILLION)
TABLE 33.GERMANY CLEANROOM CLEANING PRODUCTS MARKET, BY TYPE, 2020-2030($MILLION)
TABLE 34.GERMANY CLEANROOM CONSUMABLES MARKET, BY APPLICATION, 2020-2030($MILLION)
TABLE 35.GERMANY CLEANROOM CONSUMABLES MARKET, BY END USER, 2020-2030($MILLION)
TABLE 36.FRANCE CLEANROOM CONSUMABLES MARKET, BY PRODUCT, 2020-2030($MILLION)
TABLE 37.FRANCE CLEANROOM CLEANING PRODUCTS MARKET, BY TYPE, 2020-2030($MILLION)
TABLE 38.FRANCE CLEANROOM CONSUMABLES MARKET, BY APPLICATION, 2020-2030($MILLION)
TABLE 39.FRANCE CLEANROOM CONSUMABLES MARKET, BY END USER, 2020-2030($MILLION)
TABLE 40.UK CLEANROOM CONSUMABLES MARKET, BY PRODUCT, 2020-2030($MILLION)
TABLE 41.UK CLEANROOM CLEANING PRODUCTS MARKET, BY TYPE, 2020-2030($MILLION)
TABLE 42.UK CLEANROOM CONSUMABLES MARKET, BY APPLICATION, 2020-2030($MILLION)
TABLE 43.UK CLEANROOM CONSUMABLES MARKET, BY END USER, 2020-2030($MILLION)
TABLE 44.ITALY CLEANROOM CONSUMABLES MARKET, BY PRODUCT, 2020-2030($MILLION)
TABLE 45.ITALY CLEANROOM CLEANING PRODUCTS MARKET, BY TYPE, 2020-2030($MILLION)
TABLE 46.ITALY CLEANROOM CONSUMABLES MARKET, BY APPLICATION, 2020-2030($MILLION)
TABLE 47.ITALY CLEANROOM CONSUMABLES MARKET, BY END USER, 2020-2030($MILLION)
TABLE 48.SPAIN CLEANROOM CONSUMABLES MARKET, BY PRODUCT, 2020-2030($MILLION)
TABLE 49.SPAIN CLEANROOM CLEANING PRODUCTS MARKET, BY TYPE, 2020-2030($MILLION)
TABLE 50.SPAIN CLEANROOM CONSUMABLES MARKET, BY APPLICATION, 2020-2030($MILLION)
TABLE 51.SPAIN CLEANROOM CONSUMABLES MARKET, BY END USER, 2020-2030($MILLION)
TABLE 52.REST OF EUROPE CLEANROOM CONSUMABLES MARKET, BY PRODUCT, 2020-2030($MILLION)
TABLE 53.REST OF EUROPE CLEANROOM CLEANING PRODUCTS MARKET, BY TYPE, 2020-2030($MILLION)
TABLE 54.REST OF EUROPE CLEANROOM CONSUMABLES MARKET, BY APPLICATION, 2020-2030($MILLION)
TABLE 55.REST OF EUROPE CLEANROOM CONSUMABLES MARKET, BY END USER, 2020-2030($MILLION)
TABLE 56.EUROPE CLEANROOM CONSUMABLES MARKET, BY PRODUCT, 2020-2030($MILLION)
TABLE 57.EUROPE CLEANROOM CLEANING PRODUCTS MARKET, BY TYPE, 2020-2030($MILLION)
TABLE 58.EUROPE CLEANROOM CONSUMABLES MARKET, BY APPLICATION, 2020-2030($MILLION)
TABLE 59.EUROPE CLEANROOM CONSUMABLES MARKET, BY END USER, 2020-2030($MILLION)
TABLE 60.ASIA-PACIFIC CLEANROOM CONSUMABLES MARKET, BY COUNTRY, 2020-2030($MILLION)
TABLE 61.JAPAN CLEANROOM CONSUMABLES MARKET, BY PRODUCT, 2020-2030($MILLION)
TABLE 62.JAPAN CLEANROOM CLEANING PRODUCTS MARKET, BY TYPE, 2020-2030($MILLION)
TABLE 63.JAPAN CLEANROOM CONSUMABLES MARKET, BY APPLICATION, 2020-2030($MILLION)
TABLE 64.JAPAN CLEANROOM CONSUMABLES MARKET, BY END USER, 2020-2030($MILLION)
TABLE 65.CHINA CLEANROOM CONSUMABLES MARKET, BY PRODUCT, 2020-2030($MILLION)
TABLE 66.CHINA CLEANROOM CLEANING PRODUCTS MARKET, BY TYPE, 2020-2030($MILLION)
TABLE 67.CHINA CLEANROOM CONSUMABLES MARKET, BY APPLICATION, 2020-2030($MILLION)
TABLE 68.CHINA CLEANROOM CONSUMABLES MARKET, BY END USER, 2020-2030($MILLION)
TABLE 69.AUSTRALIA CLEANROOM CONSUMABLES MARKET, BY PRODUCT, 2020-2030($MILLION)
TABLE 70.AUSTRALIA CLEANROOM CLEANING PRODUCTS MARKET, BY TYPE, 2020-2030($MILLION)
TABLE 71.AUSTRALIA CLEANROOM CONSUMABLES MARKET, BY APPLICATION, 2020-2030($MILLION)
TABLE 72.AUSTRALIA CLEANROOM CONSUMABLES MARKET, BY END USER, 2020-2030($MILLION)
TABLE 73.INDIA CLEANROOM CONSUMABLES MARKET, BY PRODUCT, 2020-2030($MILLION)
TABLE 74.INDIA CLEANROOM CLEANING PRODUCTS MARKET, BY TYPE, 2020-2030($MILLION)
TABLE 75.INDIA CLEANROOM CONSUMABLES MARKET, BY APPLICATION, 2020-2030($MILLION)
TABLE 76.INDIA CLEANROOM CONSUMABLES MARKET, BY END USER, 2020-2030($MILLION)
TABLE 77.SOUTH KOREA CLEANROOM CONSUMABLES MARKET, BY PRODUCT, 2020-2030($MILLION)
TABLE 78.SOUTH KOREA CLEANROOM CLEANING PRODUCTS MARKET, BY TYPE, 2020-2030($MILLION)
TABLE 79.SOUTH KOREA CLEANROOM CONSUMABLES MARKET, BY APPLICATION, 2020-2030($MILLION)
TABLE 80.SOUTH KOREA CLEANROOM CONSUMABLES MARKET, BY END USER, 2020-2030($MILLION)
TABLE 81.REST OF ASIA-PACIFIC CLEANROOM CONSUMABLES MARKET, BY PRODUCT, 2020-2030($MILLION)
TABLE 82.REST OF ASIA-PACIFIC CLEANROOM CLEANING PRODUCTS MARKET, BY TYPE, 2020-2030($MILLION)
TABLE 83.REST OF ASIA-PACIFIC CLEANROOM CONSUMABLES MARKET, BY APPLICATION, 2020-2030($MILLION)
TABLE 84.REST OF ASIA-PACIFIC CLEANROOM CONSUMABLES MARKET, BY END USER, 2020-2030($MILLION)
TABLE 85.ASIA-PACIFIC CLEANROOM CONSUMABLES MARKET, BY PRODUCT, 2020-2030($MILLION)
TABLE 86.ASIA-PACIFIC CLEANROOM CLEANING PRODUCTS MARKET, BY TYPE, 2020-2030($MILLION)
TABLE 87.ASIA-PACIFIC CLEANROOM CONSUMABLES MARKET, BY APPLICATION, 2020-2030($MILLION)
TABLE 88.ASIA-PACIFIC CLEANROOM CONSUMABLES MARKET, BY END USER, 2020-2030($MILLION)
TABLE 89.ANSELL: COMPANY SNAPSHOT
TABLE 90.ANSELL: OPERATING SEGMENTS
TABLE 91.ANSELL: PRODUCT PORTFOLIO
TABLE 92.BERKSHIRE: COMPANY SNAPSHOT
TABLE 93.BERKSHIRE: OPERATING SEGMENTS
TABLE 94.BERKSHIRE: PRODUCT PORTFOLIO
TABLE 95.CONTEC: COMPANY SNAPSHOT
TABLE 96.CONTEC: OPERATING SEGMENTS
TABLE 97.CONTEC: PRODUCT PORTFOLIO
TABLE 98.DUPONT: COMPANY SNAPSHOT
TABLE 99.DUPONT: OPERATING SEGMENTS
TABLE 100.DUPONT: PRODUCT PORTFOLIO
TABLE 101.ITW: COMPANY SNAPSHOT
TABLE 102.ITW : OPERATING SEGMENTS
TABLE 103.ITW: PRODUCT PORTFOLIO
TABLE 104.K-C: COMPANY SNAPSHOT
TABLE 105.K-C: OPERATING SEGMENTS
TABLE 106.K-C: PRODUCT PORTFOLIO
TABLE 107.KM CORP: COMPANY SNAPSHOT
TABLE 108.KM CORP: OPERATING SEGMENTS
TABLE 109.KM CORP: PRODUCT PORTFOLIO
TABLE 110.MICRONCLEAN : COMPANY SNAPSHOT
TABLE 111.MICRONCLEAN : OPERATING SEGMENTS
TABLE 112.MICRONCLEAN : PRODUCT PORTFOLIO
TABLE 113.STERIS: COMPANY SNAPSHOT
TABLE 114.STERIS: OPERATING SEGMENTS
TABLE 115.STERIS: PRODUCT PORTFOLIO
TABLE 116.VALUTEK: COMPANY SNAPSHOT
TABLE 117.VALUTEK: OPERATING SEGMENTS
TABLE 118.VALUTEK: PRODUCT PORTFOLIO
TABLE 119.ECOLAB: COMPANY SNAPSHOT
TABLE 120.ECOLAB: OPERATING SEGMENTS
TABLE 121.ECOLAB: PRODUCT PORTFOLIO
LIST OF FIGURES
FIGURE 01.CLEANROOM CONSUMABLES MARKET SEGMENTATION
FIGURE 02.TOP INVESTMENT POCKETS
FIGURE 03.TOP WINNING STRATEGIES, BY YEAR, 2019-2021
FIGURE 04.TOP WINNING STRATEGIES, BY DEVELOPMENT, 2019-2021
FIGURE 05.TOP WINNING STRATEGIES, BY COMPANY, 2019-2021
FIGURE 06.MODERATE BARGAINING POWER OF SUPPLIERS
FIGURE 07.MODERATE BARGAINING POWER OF BUYERS
FIGURE 08.MODERATE THREAT OF SUBSTITUTES
FIGURE 09.MODERATE THREAT OF NEW ENTRANTS
FIGURE 10.HIGH INTENSITY OF RIVALRY
FIGURE 11.TOP PLAYER POSITIONING, 2020
FIGURE 12.IMPACT ANALYSIS
FIGURE 13.COMPARATIVE ANALYSIS OF CLEANROOM CONSUMABLES MARKET FOR CLEANROOM PERSONAL PROTECTIVE PRODUCTS, BY COUNTRY, 2020 & 2030 ($MILLION)
FIGURE 14.CLEANROOM CONSUMABLES MARKET FOR GLOVES, 2020–2030, ($MILLION)
FIGURE 15.CLEANROOM CONSUMABLES MARKET FOR COVERALLS, 2020–2030, ($MILLION)
FIGURE 16.CLEANROOM CONSUMABLES MARKET FOR SHOE COVERS, 2020–2030, ($MILLION)
FIGURE 17.CLEANROOM CONSUMABLES MARKET FOR FACE MASKS, 2020–2030, ($MILLION)
FIGURE 18.CLEANROOM CONSUMABLES MARKET FOR OTHERS, 2020–2030, ($MILLION)
FIGURE 19.COMPARATIVE ANALYSIS OF CLEANROOM CONSUMABLES MARKET FOR CLEANROOM CLEANING PRODUCTS, BY COUNTRY, 2020 & 2030 ($MILLION)
FIGURE 20.CLEANROOM CLEANING PRODUCT MARKET FOR WIPES, 2020–2030, ($MILLION)
FIGURE 21.CLEANROOM CLEANING PRODUCT MARKET FOR MOPS, 2020–2030, ($MILLION)
FIGURE 22.CLEANROOM CLEANING PRODUCT MARKET FOR DISINFECTANTS, 2020–2030, ($MILLION)
FIGURE 23.CLEANROOM CLEANING PRODUCT MARKET FOR OTHERS, 2020–2030, ($MILLION)
FIGURE 24.COMPARATIVE ANALYSIS CLEANROOM CONSUMABLES MARKET FOR MEDICAL, BY COUNTRY, 2020 & 2030 ($MILLION)
FIGURE 25.COMPARATIVE ANALYSIS OF CLEANROOM CONSUMABLES MARKET FOR DRUG MANUFACTURING, BY COUNTRY, 2020 & 2030 ($MILLION)
FIGURE 26.COMPARATIVE ANALYSIS OF CLEANROOM CONSUMABLES MARKET FOR ACADEMIC RESEARCH AND DRUG RESEARCH, BY COUNTRY, 2020 & 2030 ($MILLION)
FIGURE 27.COMPARATIVE ANALYSIS OF CLEANROOM CONSUMABLES MARKET FOR PHARMACEUTICAL & BIOTECHNOLOGY COMPANIES, BY COUNTRY, 2020 & 2030 ($MILLION)
FIGURE 28.COMPARATIVE ANALYSIS OF CLEANROOM CONSUMABLES MARKET FOR OTHERS, BY COUNTRY, 2020 & 2030 ($MILLION)
FIGURE 29.ANSELL: REVENUE, 2018–2020 ($MILLION)
FIGURE 30.ANSELL: REVENUE SHARE BY SEGMENT, 2020 (%)
FIGURE 31.ANSELL: REVENUE SHARE BY GEOGRAPHY, 2020 (%)
FIGURE 32.DUPONT: REVENUE, 2018–2020 ($MILLION)
FIGURE 33.DUPONT: REVENUE SHARE BY SEGMENT, 2020 (%)
FIGURE 34.DUPONT: REVENUE SHARE BY REGION, 2020 (%)
FIGURE 35.ITW: REVENUE, 2018–2020 ($MILLION)
FIGURE 36.ITW: REVENUE SHARE BY SEGMENT, 2020 (%)
FIGURE 37.ITW: REVENUE SHARE BY GEOGRAPHY, 2020 (%)
FIGURE 38.K-C: REVENUE, 2020 (%)
FIGURE 39.K-C: REVENUE SHARE BY SEGMENT, 2020 (%)
FIGURE 40.K-C: REVENUE SHARE BY REGION, 2020 (%)
FIGURE 41.STERIS: REVENUE, 2018–2020 ($MILLION)
FIGURE 42.STERIS: REVENUE SHARE BY SEGMENT, 2020 (%)
FIGURE 43.STERIS: REVENUE SHARE BY REGION, 2020 (%)
FIGURE 44.ECOLAB: REVENUE, 2018–2020 ($MILLION)
FIGURE 45.ECOLAB: REVENUE SHARE BY SEGMENT, 2020 (%)
FIGURE 46.ECOLAB: REVENUE SHARE BY REGION, 2020 (%)
$5769
$10663
HAVE A QUERY?
OUR CUSTOMER

SIMILAR REPORTS
Add to Cart
Add to Cart
Add to Cart
Add to Cart