

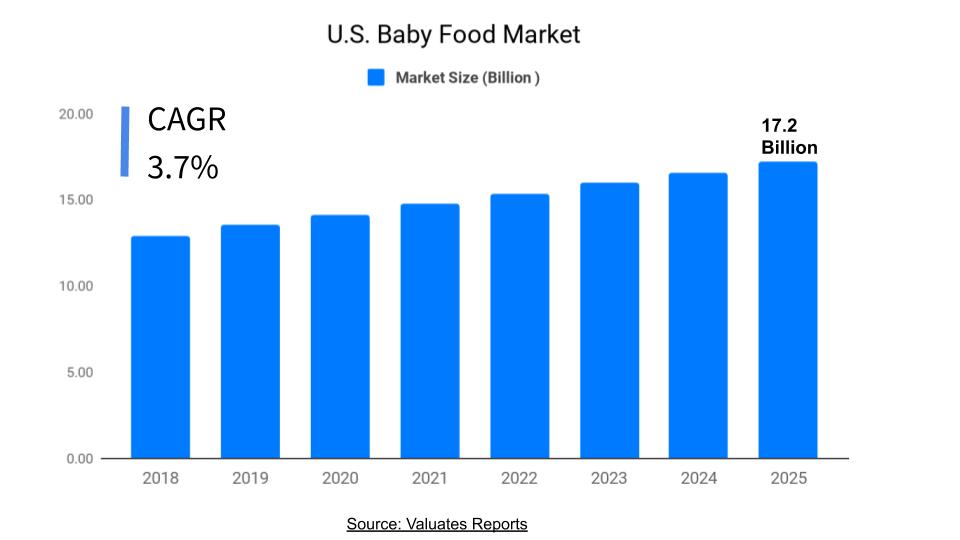
The U.S. baby food market size was valued at USD 12.9 billion in 2018 and is projected to reach USD 17.2 billion by 2026, growing at a CAGR of 3.7% from 2019 to 2026.
Baby food refers to the food prepared for infants aged between four-six months and two years. It is typically made up of minced and mashed vegetables, cereals, meats, and fruits. Over the past few years, packaged baby food has been extensively adopted by parents owing to convenience and healthier nutrition offered by these foods. In addition, an increase in awareness among people regarding the various health advantages of feeding baby food to infants has considerably fueled the growth of the U.S. baby food market.
Infants require a different amount of nutrition during different stages of life. However, the essential amount of nutrition may not be obtained merely through traditional meals. Due to this, the addition of supplements to their meals is regarded as a necessity by parents. Consequently, parents have developed a high preference towards prepared baby food products which generates a positive impact on the market. Although millennial parents prefer fewer kids, they adopt the “quality over quantity” approach. They prioritize organic foods and chemical-free baby products and are ready to purchase products at a higher price. In the coming years, brands providing high-quality fresh foods will experience elevated growth.

In addition, the concept of meal-kit delivery services of packaged baby food has become a pioneer in the baby food retail industry. Many brands have introduced baby food processed through a method called High-Pressure Pasteurization (HPP). The food products are cold-pressed and cold-packed, which help to maintain the nutrition level and shelf-life of the baby food. They also provide customized meal plans to their customers depending upon their requirements and demand. The concept of middlemen is disregarded by these meal suppliers. Instead, they prefer delivering meal boxes through their personal integrated delivery service. This has additionally boosted the U.S. baby food market growth.
However, the rise in the incidence of fertility disorders among female population and lower success rate of artificial fertility treatment had decreased the overall number of pregnancies in the U.S. The fertility rate in the U.S. has reached to the lowest level in 32 years. This has created a negative impact on several baby product businesses, including baby food products. Likewise, the decline in consumer household spending in the U.S. is also expected to hamper the U.S. baby food market.
On the contrary, the U.S. baby food industry has witnessed several transformations, essentially driven by parents’ lifestyles and their rise in interest in food, particularly organic. Numerous brands introduced healthier ingredients and tastier baby food products. A few of them include little spoon, Yumi, Nurture Life, Pure Spoon, Fresh Bellies, Smushed Organics, and Cerebelly. This can be viewed as an opportunity by manufacturers to further grow the market.
The report segments the market based on product type and distribution channel. Based on product type, the market is classified into prepared baby food, dried baby food, cereal, and other baby food. Among these, the cereals segment leads with maximum U.S. baby food market share in terms of revenue, as they are rich in iron and thereby consumed by infants on a regular basis. However, the dried baby food segment is expected to experience high demand in the market during the forecast period, due to growth in awareness among parents regarding adequate baby nutrition.
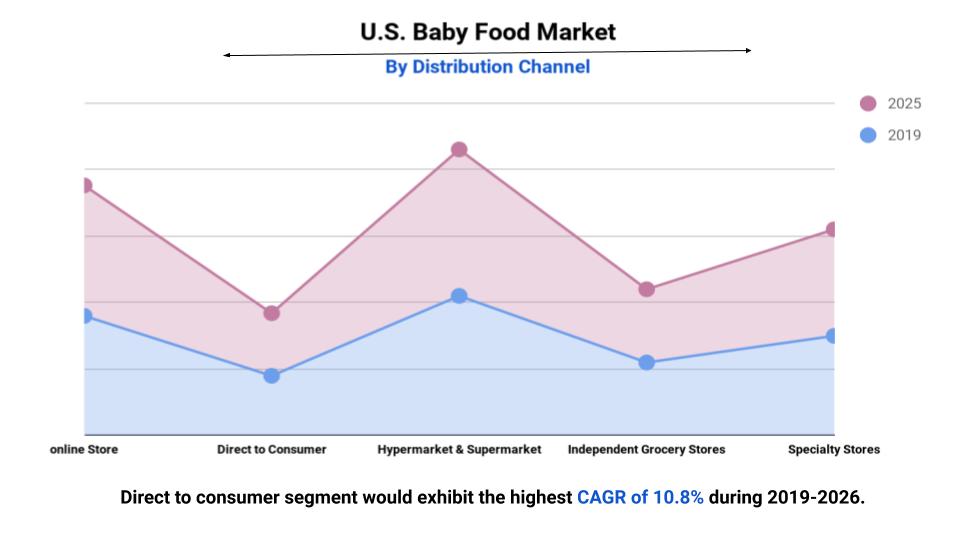
Based on the distribution channel, the market is bifurcated into hypermarket & supermarket, independent grocery store, specialty store, direct to consumer, and online store. Among these, the hypermarket & supermarket segment leads the market with maximum share in terms of revenue since consumers are heavily reliant on the types of baby food they purchase and want to be able to purchase the best and freshest foods available. The ongoing preference for the availability of baby food through direct to consumers segment is considered to be an influential U.S. baby food market trends.
However, the direct to consumer segment is expected to experience high demand during the U.S. baby food market forecast period, since they provide fresh food made from organic ingredients and deliver it to the doorstep. They not only provide healthy food but also convenience. Furthermore, infant formula producers have evaluated several ingredients as a part of their continuous effort to estimate the nourishing and functional properties of human milk. Hence, many key players have set up extensive R&D to determine new ingredients. Prebiotics and probiotics are now being promoted as an ingredient in commercial infant formulas. This can be regarded as an opportunity by the manufacturers to boost their product sales and gain an edge in the market.
The key players in the market include Abbott laboratories, Beech-Nut, Danone, Diana Group, The Hain Celestial Group, Inc., The Kraft Heinz Company, Little Spoon Inc., Mead Johnson & Company, LLC., Nestlé S.A., and Plum, PBC.
CHAPTER 1: INTRODUCTION
1.1. Report description
1.2. Key benefits for stakeholders
1.3. Key market segments
1.4. Research methodology
1.4.1. Primary research
1.4.2. Secondary research
1.4.3. Analyst tools and models
CHAPTER 2: EXECUTIVE SUMMARY
2.1. Key findings
2.1.1. Top investment pockets
2.2. CXO perspective
CHAPTER 3: MARKET OVERVIEW
3.1. Market definition and scope
3.2. Key forces shaping U.S. baby food market
3.4. Market dynamics
3.4.1. Drivers
3.4.1.1. Growth of private label baby food
3.4.1.2. Higher nutritional value of packaged baby food
3.4.1.3. Growth in direct to consumer baby food sale
3.4.2. Restraints
3.4.2.1. Steady decline in the U.S. fertility rate
3.4.2.2. Government initiatives to promote breastfeeding
3.4.2.3. Decline in average U.S. household spending
3.4.3. Opportunities
3.4.3.1. Rise in organic baby food
3.4.3.2. Extensive research on prebiotic and probiotics in baby food
3.5. Macro-economic factors
3.5.1. Overview
3.6. Consumer buying trends
CHAPTER 4: U.S. BABY FOOD MARKET, BY PRODUCT TYPE
4.1. Overview
4.2. Prepared baby food
4.2.1. Key market trends, growth factors, and opportunities
4.3. Dried baby food
4.3.1. Key market trends, growth factors, and opportunities
4.4. Cereal
4.4.1. Key market trends, growth factors, and opportunities
4.5. Other baby food
4.5.1. Key market trends, growth factors, and opportunities
CHAPTER 5: U.S. BABY FOOD MARKET, BY DISTRIBUTION CHANNEL
5.1. Overview
5.2. Hypermarket & supermarket
5.2.1. Key market trends, growth factors, and opportunities
5.3. Independent grocery store
5.3.1. Key market trends, growth factors, and opportunities
5.4. Specialty store
5.4.1. Key market trends, growth factors, and opportunities
5.5. Direct to consumer
5.5.1. Key market trends, growth factors, and opportunities
5.6. Online store
5.6.1. Key market trends, growth factors, and opportunities
CHAPTER 6: COMPANY PROFILES
6.1. ABBOTT LABORATORIES
6.1.1. Company overview
6.1.2. Key Executive
6.1.3. Company snapshot
6.1.4. Operating business segments
6.1.5. Product portfolio
6.1.6. R&D Expenditure
6.1.7. Business performance
6.1.8. Key strategic moves and developments
6.2. BEECH-NUT
6.2.1. Company overview
6.2.2. Key Executive
6.2.3. Company snapshot
6.2.4. Product portfolio
6.3. DANONE
6.3.1. Company overview
6.3.2. Key Executive
6.3.3. Company snapshot
6.3.4. Operating business segments
6.3.5. Product portfolio
6.3.6. Business performance
6.4. DIANA GROUP ( SYMRISE GROUP )
6.4.1. Company overview
6.4.2. Key Executive
6.4.3. Company snapshot
6.4.4. Operating business segments
6.4.5. Product portfolio
6.4.6. R&D Expenditure
6.4.7. Business performance
6.5. MEAD JOHNSON & COMPANY, LLC
6.5.1. Company overview
6.5.2. Key Executive
6.5.3. Company snapshot
6.5.4. Operating business segments
6.5.5. Product portfolio
6.5.6. R&D Expenditure
6.5.7. Business performance
6.6. NESTLE S A
6.6.1. Company overview
6.6.2. Key Executive
6.6.3. Company snapshot
6.6.4. Operating business segments
6.6.5. Product portfolio
6.6.6. Business performance
6.7. Little Spoon, Inc.
6.7.1. Company overview
6.7.2. Key Executive
6.7.3. Company snapshot
6.7.4. Operating business segments
6.7.5. Product portfolio
6.8. PLUM, PBC
6.8.1. Company overview
6.8.2. Key Executive
6.8.3. Company snapshot
6.8.4. Product portfolio
6.9. THE HAIN CELESTIAL GROUP, INC. (HAIN CELESTIAL)
6.9.1. Company overview
6.9.2. Key Executive
6.9.3. Company snapshot
6.9.4. Operating business segments
6.9.5. Product portfolio
6.9.6. R&D Expenditure
6.9.7. Business performance
6.10. THE KRAFT HEINZ COMPANY (HEINZ)
6.10.1. Company overview
6.10.2. Key Executive
6.10.3. Company snapshot
6.10.4. Product portfolio
6.10.5. R&D Expenditure
6.10.6. Business performance
List Of Tables
Table 01. Population By Age Group Of U.s., 2014-2018
Table 02. Income And Savings In U.s., 2014-2018
Table 03. U.s. Baby Food Market, By Product Type, 2017–2026 ($million)
Table 04. U.s. Baby Food Market Revenue, By Distribution Channel, 2017-2026 ($million)
Table 05. Abbott Laboratories: Key Executives
Table 06. Abbott Laboratories: Company Snapshot
Table 07. Abbott Laboratories: Operating Segments
Table 08. Abbott Laboratories: Product Portfolio
Table 09. Abbott Laboratories: R&d Expenditure, 2016–2018 ($million)
Table 10. Abbott Laboratories: Net Sales, 2016–2018 ($million)
Table 11. Beech-nut: Key Executives
Table 12. Beech-nut: Company Snapshot
Table 13. Beech-nut: Product Portfolio
Table 14. Danone: Key Executives
Table 15. Danone: Company Snapshot
Table 16. Danone: Operating Segments
Table 17. Danone: Product Portfolio
Table 18. Danone: Net Sales, 2016–2018 ($million)
Table 19. Symrise: Key Executives
Table 20. Symrise: Company Snapshot
Table 21. Symrise: Operating Segments
Table 22. Symrise: Product Portfolio
Table 23. Symrise: R&d Expenditure, 2016–2018 ($million)
Table 24. Symrise: Net Sales, 2016–2018 ($million)
Table 25. Mead Johnson & Company, Llc: Key Executives
Table 26. Mead Johnson & Company, Llc: Company Snapshot
Table 27. Mead Johnson & Company, Llc: Operating Segments
Table 28. Mead Johnson & Company, Llc: Product Portfolio
Table 29. Mead Johnson & Company, Llc: R&d Expenditure, 2016–2018 ($million)
Table 30. Mead Johnson & Company, Llc: Net Sales, 2016–2018 ($million)
Table 31. Nestle S A: Key Executives
Table 32. Nestle S A: Company Snapshot
Table 33. Nestle S A: Operating Segments
Table 34. Nestle S A: Product Portfolio
Table 35. Nestle S A: Net Sales, 2016–2018 ($million)
Table 36. Little Spoon, Inc.: Key Executives
Table 37. Little Spoon, Inc.: Company Snapshot
Table 38. Little Spoon, Inc.: Operating Segments
Table 39. Little Spoon, Inc.: Product Portfolio
Table 40. Plum, Pbc: Key Executives
Table 41. Plum, Pbc: Company Snapshot
Table 42. Plum, Pbc: Product Portfolio
Table 43. The Hain Celestial Group, Inc.: Key Executives
Table 44. The Hain Celestial Group, Inc.: Company Snapshot
Table 45. The Hain Celestial Group, Inc.: Operating Segments
Table 46. The Hain Celestial Group, Inc.: Product Portfolio
Table 47. The Hain Celestial Group, Inc.: R&d Expenditure, 2017–2019 ($million)
Table 48. The Hain Celestial Group, Inc.: Net Sales, 2017–2019 ($million)
Table 49. The Kraft Heinz Company: Key Executives
Table 50. The Kraft Heinz Company: Company Snapshot
Table 51. The Kraft Heinz Company: Product Portfolio
Table 52. The Kraft Heinz Company: R&d Expenditure, 2016–2018 ($million)
Table 53. The Kraft Heinz Company: Net Sales, 2016–2018 ($million)
List Of Figures
Figure 01. Key Market Segments
Figure 02. Executive Summary
Figure 03. Top Investment Pockets
Figure 04. Moderate Bargaining Power Of Suppliers
Figure 05. High Bargaining Power Of Buyer
Figure 06. Moderate Threat Of New Entrant
Figure 07. Low Threat Of Substitute
Figure 08. High Intensity Of Competitive Rivalry
Figure 09. Market Dynamic Analysis
Figure 10. Household Spending Of U.s. On Baby Food (2002 - 2017)
Figure 11. Urban Population Of U.s. (2014 - 2018)
Figure 12. Number Of Births In U.s. (2007 - 2017)
Figure 13. Infant Mortality Rates By Race And Ethnicity, 2016
Figure 14. U.s. Baby Food Market, By Product Type, 2018
Figure 15. U.s. Baby Food Market For Prepared Baby Food, 2017-2026 ($million)
Figure 16. U.s. Baby Food Market For Dried Baby Food, 2017-2026 ($million)
Figure 17. U.s. Baby Food Market For Cereal, 2017-2026 ($million)
Figure 18. U.s. Baby Food Market For Other Baby Food, 2017-2026 ($million)
Figure 19. U.s. Baby Food Market, By Distribution Channel, 2018 (%)
Figure 20. U.s. Baby Food Market For Hypermarket & Supermarket, 2017-2026 ($million)
Figure 21. U.s. Baby Food Market For Independent Grocery Store, 2017-2026 ($million)
Figure 22. U.s. Baby Food Market For Specialty Store, 2017-2026 ($million)
Figure 23. U.s. Baby Food Market For Direct To Consumer, 2017-2026 ($million)
Figure 24. U.s. Baby Food Market For Online Store, 2017-2026 ($million)
Figure 25. Abbott Laboratories: R&d Expenditure, 2016–2018 ($million)
Figure 26. Abbott Laboratories: Net Sales, 2016–2018 ($million)
Figure 27. Abbott Laboratories: Revenue Share By Segment, 2018 (%)
Figure 28. Abbott Laboratories: Revenue Share By Region, 2018 (%)
Figure 29. Danone: Net Sales, 2016–2018 ($million)
Figure 30. Danone: Revenue Share By Segment, 2018 (%)
Figure 31. Danone: Revenue Share By Region, 2018 (%)
Figure 32. Symrise: R&d Expenditure, 2016–2018 ($million)
Figure 33. Symrise: Net Sales, 2016–2018 ($million)
Figure 34. Symrise: Revenue Share By Segment, 2018 (%)
Figure 35. Symrise: Revenue Share By Region, 2018 (%)
Figure 36. Mead Johnson & Company, Llc: R&d Expenditure, 2016–2018 ($million)
Figure 37. Mead Johnson & Company, Llc: Net Sales, 2016–2018 ($million)
Figure 38. Mead Johnson & Company, Llc: Revenue Share By Segment, 2018 (%)
Figure 39. Mead Johnson & Company, Llc: Revenue Share By Region, 2018 (%)
Figure 40. Nestle S A: Net Sales, 2016–2018 ($million)
Figure 41. Nestle S A: Revenue Share By Segment, 2018 (%)
Figure 42. Nestle S A: Revenue Share By Region, 2018 (%)
Figure 43. The Hain Celestial Group, Inc.: R&d Expenditure, 2017–2019 ($million)
Figure 44. The Hain Celestial Group, Inc.: Net Sales, 2017–2019 ($million)
Figure 45. The Hain Celestial Group, Inc.: Revenue Share By Segment, 2019 (%)
Figure 46. The Kraft Heinz Company: R&d Expenditure, 2016–2018 ($million)
Figure 47. The Kraft Heinz Company: Net Sales, 2016–2018 ($million)
$3850
$6449
HAVE A QUERY?
OUR CUSTOMER
