
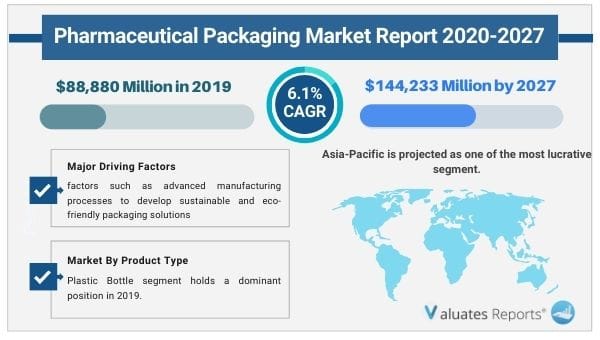
The global pharmaceutical packaging market accounted for $ 88,880 million in 2019 and is expected to reach $ 144,233 million by 2027, registering a Compound Annual Growth Rate (CAGR) of 6.1% from 2020 to 2027. Factors such as advanced manufacturing processes to develop sustainable and eco-friendly packaging solutions, increase in product innovations, and merger & acquisition to support new demands. In addition, serialized tracking & tracing of drugs, emerging generic drug market, rapidly growing drug delivery market, increase in R&D activities and use of innovative packaging drive the growth of the pharmaceutical packaging market.
Packaging is an integral part of pharmaceutical products. Packaging is often involved in dispensing, dosing, and use of pharmaceutical products. Communication of proper use and cautionary labels are also regulated. There are several different types of packaging for a pharmaceutical product, which are classified as primary, secondary, and tertiary. Primary drug packaging is the material that surrounds the pharmaceutical product, while secondary and tertiary packaging provides additional external protection. One of the most important functions of packaging is to shield products from the damaging effects of the external environment. Many formulations become unstable when exposed to air, moisture, or light, and therefore protection from these factors is necessary to ensure medicines remain effective and safe.
The market is expected to witness a significant growth during the forecast period. The growth can be attributed to advanced manufacturing processes to develop sustainable and eco-friendly packaging solutions and product innovations, increase in product innovations and merger & acquisition to support new demands. In addition, serialized tracking and & tracing of drugs, emerging generic drug market, rapidly growing drug delivery market, and increase in R&D and use of innovative packaging drive the growth of the pharmaceutical packaging market.
However, price volatility of raw materials, stringent government regulations and standard can also restrain growth of the pharmaceutical packaging market. On the contrary, advancement in the biotechnology sector results in the introduction of new parenteral therapies, increase in demand for innovative packaging products, and growing use of the smart packaging for patient engagement & identification. In addition, increase in patient-oriented medicines including biologics is expected to uplift the market growth of the pharmaceutical packaging market during the forecast period.
Furthermore, pandemic crisis results in lack of workforce, transportation restrictions, and shortage in raw materials and implementation of lockdown across the globe, which hamper the supply of products. Moreover, after vaccine approval, if these vaccines rely on different administration routes (e.g., inhaled, oral, transdermal, and injectable), then demand for primary packaging can be extended across multiple packaging formats. Therefore, COVID-19 is expected to propel the growth of pharmaceutical packaging during the forecast period.
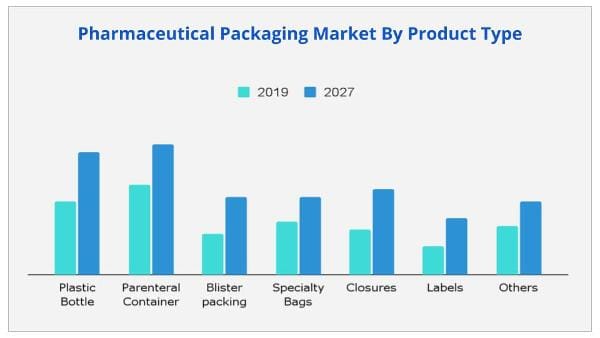
The global pharmaceutical packaging market is segmented on the basis of product and region. By product, it is divided into parenteral containers, plastic bottles, blister packaging, closures, specialty bags, labels, and others. . Based on material the market is divided into glass, aluminum foils, plastics, and polymers, paper & paperboards, and others. Region-wise, the market is analyzed across North America, Europe, Asia-Pacific, and LAMEA.
On the basis of product type, the plastic bottles segment is accounted to dominate the market share in 2019. As plastic bottles have always been the preferred mode of packaging tablets and capsules. Wide usage of plastic bottles for packaging liquid dosages, like syrups, nasal, and ophthalmic medications. The advantage of a plastic bottle is that pharmaceutical manufacturers can place more tablets in bottles more efficiently and cost-effectively. Further, the parenteral containers segment is expected to propel market growth as plastic is slowly being eliminated from the parenteral packaging ecosystem. Companies are shifting toward prefilled and ready-to-use containers and this is expected to augment the usability of parenteral products in self-medication.
In 2019, North America is accounted for the largest share, owing to high purchasing power, coupled with rise in adoption rate of smart and advanced packages. Further, U.S. accounted for generating largest share, and is expected to continue the trend during the forecast period. As U.S. is the advanced drug-producing sector that commercializes new sophisticated therapies with specialized packaging needs. On the other hand, the market in Asia-Pacific is expected to register the highest CAGR in terms of revenue during the forecast period pertaining to growth in the purchasing power of populated countries such as China, Japan, and India. Further, requirements for brand enhancement and differentiation, new packaging material development, increase in awareness of environmental issues, and the adoption of new regulatory requirements on recycling packages are projected to boost growth of the Asia-Pacific pharmaceutical packaging market.
The global pharmaceutical packaging market is highly competitive, and prominent players have adopted various strategies to garner maximum market share. These include collaboration, product launch, partnership, and acquisition. Major players operating in the market include Amcor Ltd, Aptar Group, Inc., Catalent Inc., CCL Industries Inc., Becton, Dickinson and Company, Gerresheimer AG, West Pharmaceutical Services, Inc., Nipro Corporation, Berry Global Group, Inc., and SCHOTT Pharmaceutical Packaging.
|
Report Metric |
Details |
|
Report Name |
Pharmaceutical Packaging Market |
|
The market size in 2019 |
USD 88,880 Million |
|
The revenue forecast in 2027 |
USD 144,233 Million |
|
Growth Rate |
Compound Annual Growth Rate (CAGR) of 6.1% from 2020 to 2027 |
|
Market size available for years |
2020-2027 |
|
Forecast units |
Value (USD) |
|
Segments covered |
Product Type, Materials, and Region |
|
Report coverage |
Revenue & volume forecast, company share, competitive landscape, growth factors, and trends |
|
Geographic regions covered |
North America, Europe, Asia Pacific, Latin America, Middle East & Africa |
Ans. The global pharmaceutical packaging market accounted for $ 88,880 million in 2019 and is expected to reach $ 144,233 million by 2027
Ans. The global pharmaceutical packaging market is estimated to grow with a CAGR of 6.1% during the forecast period.
Ans. The growth of the global pharmaceutical packaging market is attributed to increase in product innovations and merger & acquisition to support new demands majorly drives the market growth.
Ans. Asia-Pacific is projected as one of the most lucrative segment.
Ans. Yes, the report includes a COVID-19 impact analysis. Also, it is further extended into every individual segment of the report.
Table of Content
CHAPTER 1:INTRODUCTION
1.1.Report description
1.1.1.Key benefits for stakeholders
1.1.2.Key market segments
1.1.3.List of key players profiled in the report
1.2.Research methodolog
1.2.1.Secondary research
1.2.2.Primary research
1.2.3.Analyst tools and models
CHAPTER 2:EXECUTIVE SUMMARY
2.1.Key findings of the study
2.2.CXO perspective
CHAPTER 3:MARKET OVERVIEW
3.1.Market definition and scope
3.2.Key findings
3.2.1.Top investment pockets
3.2.2.Top winning strategies
3.3.Top Player Positioning, 2019
3.4.Value chain analysis
3.5.Porter’s five forces analysis
3.1.Impact Analysis of Covid-19 on pharmaceutical packaging market
3.2.Market Dynamics
3.2.1.Drivers
3.2.1.1.Advanced manufacturing processes to develop sustainable and eco-friendly packaging solutions
3.2.1.2.Increase in product innovations and merger & acquisition to support new demands
3.2.1.3.Serialized tracking and tracing of drugs
3.2.1.4.Emerging generic drug market and rapidly growing drug delivery market
3.2.1.5.Increase in R&D and use of innovative packaging
3.2.2.Restraints
3.2.2.1.Price volatility of raw materials
3.2.2.2.Stringent government regulations and standards
3.2.3.Opportunities
3.2.3.1.Advancement in the biotechnology sector results in the introduction of new parenteral therapies and demand for innovative packaging products
3.2.3.2.Growing use of the smart packaging for patient engagement and identification
3.2.3.3.Increase in a patient-oriented medicines including biologics
3.2.4.Impact analysis
CHAPTER 4:PHARMACEUTICAL PACKAGING MARKET, BY PRODUCTS TYPE
4.1.Overview
4.1.1.Market size and forecast
4.2.Plastic Bottle
4.2.1.Key growth factors and opportunities
4.2.2.Market size and forecast
4.2.3.Market share analysis, by country
4.3.Parenteral Container
4.3.1.Key market trends and opportunities
4.3.2.Market size and forecast
4.3.3.Market share analysis, by country
4.4.Blister packing
4.4.1.Key market trends and opportunities
4.4.2.Market size and forecast
4.4.3.Market share analysis, by country
4.5.Specialty Bags
4.5.1.Key market trends and opportunities
4.5.2.Market size and forecast
4.5.3.Market share analysis, by country
4.6.Closures
4.6.1.Key market trends and opportunities
4.6.2.Market size and forecast
4.6.3.Market share analysis, by country
4.7.Labels
4.7.1.Key market trends and opportunities
4.7.2.Market size and forecast
4.7.3.Market share analysis, by country
4.8.Others
4.8.1.Key market trends and opportunities
4.8.2.Market size and forecast
4.8.3.Market share analysis, by country
CHAPTER 5:PHARMACEUTICAL PACKAGING MARKET, BY MATERIAL
5.1.Overview
5.1.1.Market size and forecast
5.2.Glass
5.2.1.Market size and forecast
5.2.2.Market share analysis, by country
5.3.Aluminum Foils
5.3.1.Market size and forecast
5.3.2.Market share analysis, by country
5.4.Plastics and polymers
5.4.1.Market size and forecast
5.4.2.Market share analysis, by country
5.5.Paper & paperboards
5.5.1.Market size and forecast
5.5.2.Market share analysis, by country
5.6.Others (Cartons, Fiber Drums, & Pills Box)
5.6.1.Market size and forecast
5.6.2.Market share analysis, by country
CHAPTER 6:PHARMACEUTICAL PACKAGING MARKET, BY REGION
6.1.Overview
6.1.1.Market size and forecast
6.2.North America
6.2.1.Key opportunities and forecast
6.2.2.Market size and forecast, by country
6.2.3.Market size and forecast
6.2.3.1.U.S.
6.2.3.1.1.U.S. market size and forecast, by product type
6.2.3.1.2.U.S. market size and forecast, by material
6.2.3.2.Canada
6.2.3.2.1.Canada market size and forecast, by product type
6.2.3.2.2.Canada market size and forecast, by material
6.2.3.3.Mexico
6.2.3.3.1.Mexico market size and forecast, by product type
6.2.3.3.2.Mexico market size and forecast, by material
6.3.Europe
6.3.1.Key opportunities and forecast
6.3.2.Market size and forecast, by country
6.3.3.Market size and forecast
6.3.3.1.Germany
6.3.3.1.1.Germany market size and forecast, by product type
6.3.3.1.2.Germany market size and forecast, by material
6.3.3.2.France
6.3.3.2.1.France market size and forecast, by product type
6.3.3.2.2.France market size and forecast, by material
6.3.3.3.UK
6.3.3.3.1.UK market size and forecast, by product type
6.3.3.3.2.UK market size and forecast, by material
6.3.3.5.Italy
6.3.3.5.1.Italy market size and forecast, by product type
6.3.3.5.2.Italy market size and forecast, by material
6.3.3.6.Spain
6.3.3.6.1.Spain market size and forecast, by product type
6.3.3.6.2.Spain market size and forecast, by material
6.3.3.7.Rest of Europe
6.3.3.7.1.Rest of Europe market size and forecast, by product type
6.3.3.7.2.Rest of Europe market size and forecast, by material
6.4.Asia-Pacific
6.4.1.Key opportunities and forecast
6.4.2.Market size and forecast, by country
6.4.3.Market size and forecast
6.4.3.1.Japan
6.4.3.1.1.Japan market size and forecast, by product type
6.4.3.1.2.Japan market size and forecast, by material
6.4.3.2.China
6.4.3.2.1.China market size and forecast, by product type
6.4.3.2.2.China market size and forecast, by material
6.4.3.3.Australia
6.4.3.3.1.Australia market size and forecast, by product type
6.4.3.3.2.Australia market size and forecast, by material
6.4.3.4.India
6.4.3.4.1.India market size and forecast, by product type
6.4.3.4.2.India market size and forecast, by material
6.4.3.5.South Korea
6.4.3.5.1.South Korea market size and forecast, by product type
6.4.3.5.2.South Korea market size and forecast, by material
6.4.3.6.Rest of Asia-Pacific
6.4.3.6.1.Rest of Asia-Pacific market size and forecast, by product type
6.4.3.6.2.Rest of Asia-Pacific market size and forecast, by material
6.5.LAMEA
6.5.1.Key opportunities and forecast
6.5.2.Market size and forecast, by country
6.5.3.Market size and forecast
6.5.3.1.Brazil
6.5.3.1.1.Brazil market size and forecast, by product type
6.5.3.1.2.Brazil market size and forecast, by material
6.5.3.2.Saudi Arabia
6.5.3.2.1.Saudi Arabia market size and forecast, by product type
6.5.3.2.2.Saudi Arabia market size and forecast, by material
6.5.3.3.South Africa
6.5.3.3.1.South Africa market size and forecast, by product type
6.5.3.3.2.South Africa market size and forecast, by material
6.5.3.4.Rest of LAMEA
6.5.3.4.1.Rest of LAMEA market size and forecast, by product type
6.5.3.4.2.Rest of LAMEA market size and forecast, by material
CHAPTER 7:COMPANY PROFILES
7.1.Amcor Plc.
7.1.1.Company overview
7.1.2.Operating business segments
7.1.3.Product portfolio
7.1.4.Business performance
7.1.5.Key strategic moves and developments
7.2.Aptar Group, Inc.
7.2.1.Company overview
7.2.2.Operating business segments
7.2.3.Product portfolio
7.2.4.Business performance
7.2.5.Key strategic moves and developments
7.3.Becton, Dickinson and Company
7.3.1.Company overview
7.3.2.Company snapshot
7.3.3.Operating business segments
7.3.1.Product portfolio
7.3.2.Business performance
7.3.3.Key strategic moves and developments
7.4.Berry Global Group, Inc
7.4.1.Company overview
7.4.2.Operating business segments
7.4.3.Product portfolio
7.4.4.Business performance
7.5.Catalent Inc.
7.5.1.Company overview
7.5.2.Operating business segments
7.5.3.Product portfolio
7.5.4.Business performance
7.5.5.Key strategic moves and developments
7.6.CCL Industries Inc.
7.6.1.Company overview
7.6.2.Operating business segments
7.6.3.Product portfolio
7.6.4.Business performance
7.7.Gerresheimer AG
7.7.1.Company overview
7.7.2.Operating business segments
7.7.3.Product portfolio
7.7.4.Business performance
7.7.5.Key strategic moves and developments
7.8.Nipro Corporation
7.8.1.Company overview
7.8.2.Operating business segments
7.8.3.Product portfolio
7.8.4.Business performance
7.9.SCHOTT Pharmaceutical Packaging
7.9.1.Company overview
7.9.2.Operating business segments
7.9.3.Product portfolio
7.9.4.Business performance
7.10.West Pharmaceutical Services, Inc.
7.10.1.Company overview
7.10.2.Operating business segments
7.10.3.Product portfolio
7.10.4.Business performance
7.10.5.Key strategic moves and developments
Table 01.Global Pharmaceutical Packaging Market, By Products Type, 2019–2027 ($Million)
Table 02.Plastic Bottle Market, By Region, 2019–2027 ($Million)
Table 03.Parenteral Containers Market, By Region, 2019–2027 ($Million)
Table 04.Specialty Bags Market, By Region, 2019–2027 ($Million)
Table 05.Global Pharmaceutical Market, By Material, 2019–2027 ($Million)
Table 06.Glass Market, By Region, 2019–2027 ($Million)
Table 07.Aluminium Foil Market, By Region, 2019–2027 ($Million)
Table 08.Plastics And Polymers Market, By Region, 2019–2027 ($Million)
Table 09.Paper And Paperboard Market, By Region, 2019–2027 ($Million)
Table 10.Others Market, By Region, 2019–2027 ($Million)
Table 11.Pharmaceutical Packaging Market, By Region, 2019–2027($Million)
Table 12.North America Pharmaceutical Packaging Market, By Country, 2019–2027($Million)
Table 13.North America Pharmaceutical Packaging Market, By Product Type, 2019–2027($Million)
Table 14.North America Pharmaceutical Packaging Market, By Material, 2019–2027($Million)
Table 15.U.S. Pharmaceutical Packaging Market, By Product Type, 2019–2027($Million)
Table 16.U.S. Pharmaceutical Packaging Market, By Material, 2019–2027($Million)
Table 17.Canada Pharmaceutical Packaging Market, By Product Type, 2019–2027($Million)
Table 18.Canada Pharmaceutical Packaging Market, By Material, 2019–2027($Million)
Table 19.Mexico Pharmaceutical Packaging Market, By Product Type, 2019–2027($Million)
Table 20.Mexico Pharmaceutical Packaging Market, By Material, 2019–2027($Million)
Table 21.Europe Pharmaceutical Packaging Market, By Country, 2019–2027($Million)
Table 22.Europe Pharmaceutical Packaging Market, By Product Type, 2019–2027($Million)
Table 23.Europe Pharmaceutical Packaging Market, By Material, 2019–2027($Million)
Table 24.Germany Pharmaceutical Packaging Market, By Product Type, 2019–2027($Million)
Table 25.Germany Pharmaceutical Packaging Market, By Material, 2019–2027($Million)
Table 26.France Pharmaceutical Packaging Market, By Product Type, 2019–2027($Million)
Table 27.France Pharmaceutical Packaging Market, By Material, 2019–2027($Million)
Table 28.Uk Pharmaceutical Packaging Market, By Product Type, 2019–2027($Million)
Table 29.Uk Pharmaceutical Packaging Market, By Material, 2019–2027($Million)
Table 30.Italy Pharmaceutical Packaging Market, By Product Type, 2019–2027($Million)
Table 31.Italy Pharmaceutical Packaging Market, By Material, 2019–2027($Million)
Table 32.Spain Pharmaceutical Packaging Market, By Product Type, 2019–2027($Million)
Table 33.Spain Pharmaceutical Packaging Market, By Material, 2019–2027($Million)
Table 34.Rest Of Europe Pharmaceutical Packaging Market, By Product Type, 2019–2027($Million)
Table 35.Rest Of Europe Pharmaceutical Packaging Market, By Material, 2019–2027($Million)
Table 36.Asia-Pacific Pharmaceutical Packaging Market, By Country, 2019–2027($Million)
Table 37.Asia-Pacific Pharmaceutical Packaging Market, By Product Type, 2019–2027($Million)
Table 38.Asia-Pacific Pharmaceutical Packaging Market, By Material, 2019–2027($Million)
Table 39.Japan Pharmaceutical Packaging Market, By Product Type, 2019–2027($Million)
Table 40.Japan Pharmaceutical Packaging Market, By Material, 2019–2027($Million)
Table 41.China Pharmaceutical Packaging Market, By Product Type, 2019–2027($Million)
Table 42.China Pharmaceutical Packaging Market, By Material, 2019–2027($Million)
Table 43.Australia Pharmaceutical Packaging Market, By Product Type, 2019–2027($Million)
Table 44.Australia Pharmaceutical Packaging Market, By Material, 2019–2027($Million)
Table 45.India Pharmaceutical Packaging Market, By Product Type, 2019–2027($Million)
Table 46.India Pharmaceutical Packaging Market, By Material, 2019–2027($Million)
Table 47.South Korea Pharmaceutical Packaging Market, By Product Type, 2019–2027($Million)
Table 48.South Korea Pharmaceutical Packaging Market, By Material, 2019–2027($Million)
Table 49.Rest Of Asia-Pacific Pharmaceutical Packaging Market, By Product Type, 2019–2027($Million)
Table 50.Rest Of Asia-Pacifc Pharmaceutical Packaging Market, By Material, 2019–2027($Million)
Table 51.Lamea Pharmaceutical Packaging Market, By Country, 2019–2027($Million)
Table 52.Lamea Pharmaceutical Packaging Market, By Product Type, 2019–2027($Million)
Table 53.Lamea Pharmaceutical Packaging Market, By Material, 2019–2027($Million)
Table 54.Brazil Pharmaceutical Packaging Market, By Product Type, 2019–2027($Million)
Table 55.Brazil Pharmaceutical Packaging Market, By Material, 2019–2027($Million)
Table 56.Saudi Arabia Pharmaceutical Packaging Market, By Product Type, 2019–2027($Million)
Table 57.Saudi Arabia Pharmaceutical Packaging Market, By Material, 2019–2027($Million)
Table 58.South Africa Pharmaceutical Packaging Market, By Product Type, 2019–2027($Million)
Table 59.South Africa Pharmaceutical Packaging Market, By Material, 2019–2027($Million)
Table 60.Rest Of Lamea Pharmaceutical Packaging Market, By Product Type, 2019–2027($Million)
Table 61.Rest Of Lamea Pharmaceutical Packaging Market, By Material, 2019–2027($Million)
Table 62.Amcor: Company Snapshot
Table 63.Amcor: Operating Segments
Table 64.Amcor: Product Portfolio
Table 65.Aptar: Company Snapshot
Table 66.Aptar: Operating Segments
Table 67.Aptar: Product Portfolio
Table 68.Becton, Dickinson And Company: Snapshot
Table 69.Becton, Dickinson And Company: Operating Segments
Table 70.Becton, Dickinson And Company: Product Portfolio
Table 71.Berry: Company Snapshot
Table 72.Berry: Operating Segments
Table 73.Berry: Product Portfolio
Table 74.Catalent: Company Snapshot
Table 75.Catalent: Operating Segments
Table 76.Catalent: Product Portfolio
Table 77.Ccl: Company Snapshot
Table 78.Ccl: Operating Segments:
Table 79.Ccl: Product Portfolio
Table 80.Gerresheimer: Company Snapshot
Table 81.Gerresheimer: Operating Segments
Table 82.Gerresheimer: Product Portfolio
Table 83.Nipro Group: Company Snapshot
Table 84.Nipro Group: Operating Segments
Table 85.Nipro Group: Product Portfolio
Table 86.Schott Ag: Company Snapshot
Table 87.Schott Ag: Operating Segments
Table 88.Schott Ag: Product Portfolio
Table 89.West: Company Snapshot
Table 90.West: Operating Segments
Table 91.West: Product Portfolio
List Of Figures
Figure 01.Top Investment Pockets
Figure 02.Top Winning Strategies, By Year, 2017–2020*
Figure 03.Top Winning Strategies, By Development, 2017–2020* (%)
Figure 04.Top Winning Strategies, By Company, 2017–2020* (%)
Figure 05.Top Player Positioning, 2019
Figure 01.Value Chain Analysis Of Pharmaceutical Packaging Market
Figure 02.Moderate Bargaining Power Of Buyers
Figure 03.Moderate Bargaining Power Of Suppliers
Figure 04.Moderate Threat Of New Entrants
Figure 05.Moderate Threat Of Substitution
Figure 06.High Competitive Rivalry
Figure 07.Impact Analysis:
Figure 08.Comparative Share Analysis Of Plastic Bottle Market, By Country, 2019 & 2027(%)
Figure 09.Comparative Share Analysis Of Parenteral Containers Market, By Country, 2019 & 2027(%)
Figure 10.Comparative Share Analysis Of Blister Packaging Market, By Country, 2019 & 2027(%)
Figure 11.Comparative Share Analysis Of Specialty Bags Market, By Country, 2019 & 2027(%)
Figure 12.Comparative Share Analysis Of Closures Market, By Country, 2019 & 2027(%)
Figure 13.Comparative Share Analysis Of Labels Market, By Country, 2019 & 2027(%)
Figure 14.Comparative Share Analysis Of Others Market, By Country, 2019 & 2027(%)
Figure 15.Comparative Share Analysis Of Glass Market, By Country, 2019 & 2027(%)
Figure 16.Comparative Share Analysis Of Aluminium Foil Market, By Country, 2019 & 2027(%)
Figure 17.Comparative Share Analysis Of Plastics And Polymers Market, By Country, 2019 & 2027(%)
Figure 18.Comparative Share Analysis Of Paper And Paperboard Market, By Country, 2019 & 2027(%)
Figure 19.Comparative Share Analysis Of Others Market, By Country, 2019 & 2027(%)
Figure 20.U.S. Pharmaceutical Packaging Market, 2019–2027 ($Million)
Figure 21.Canada Pharmaceutical Packaging Market, 2019–2027 ($Million)
Figure 22.Mexico Pharmaceutical Packaging Market, 2019–2027 ($Million)
Figure 23.Germany Pharmaceutical Packaging Market, 2019–2027 ($Million)
Figure 24.France Pharmaceutical Packagingmarket, 2019–2027 ($Million)
Figure 25.Uk Pharmaceutical Packagingmarket, 2019–2027 ($Million)
Figure 26.Italy Pharmaceutical Packagingmarket, 2019–2027 ($Million)
Figure 27.Spain Pharmaceutical Packagingmarket, 2019–2027 ($Million)
Figure 28.Rest Of Europe Pharmaceutical Packagingmarket, 2019–2027 ($Million)
Figure 29.Japan Pharmaceutical Packagingmarket, 2019–2027 ($Million)
Figure 30.China Pharmaceutical Packagingmarket, 2019–2027 ($Million)
Figure 31.Australia Pharmaceutical Packagingmarket, 2019–2027 ($Million)
Figure 32.India Pharmaceutical Packagingmarket, 2019–2027 ($Million)
Figure 33.South Korea Pharmaceutical Packagingmarket, 2019–2027 ($Million)
Figure 34.Rest Of Asia-Pcaific Pharmaceutical Packaging Market, 2019–2027 ($Million)
Figure 35.Brazil Pharmaceutical Packagingmarket, 2019–2027 ($Million)
Figure 36.Saudi Arabia Pharmaceutical Packagingmarket, 2019–2027 ($Million)
Figure 37.South Africa Pharmaceutical Packagingmarket, 2019–2027 ($Million)
Figure 38.Rest Of Lamea Pharmaceutical Packagingmarket, 2019–2027 ($Million)
Figure 39.Amcor: Net Sales, 2018–2020 ($Million)
Figure 40.Amcor: Revenue Share By Segment, 2020 (%)
Figure 41.Amcor: Revenue Share By Region, 2020 (%)
Figure 42.Aptar: Net Sales, 2017–2019 ($Million)
Figure 43.Aptar: Revenue Share By Segment, 2019 (%)
Figure 44.Aptar: Revenue Share By Region, 2019 (%)
Figure 45.Bd: Net Sales, 2017–2019 ($Million)
Figure 46.Bd: Revenue Share By Segment, 2019 (%)
Figure 47.Bd: Revenue Share By Region, 2019 (%)
Figure 48.Berry: Net Sales, 2017–2019 ($Million)
Figure 49.Berry: Revenue Share By Segment, 2019 (%)
Figure 50.Berry: Revenue Share By Region, 2019 (%)
Figure 51.Catalent: Net Sales, 2018–2020 ($Million)
Figure 52.Catalent: Revenue Share By Segment, 2020 (%)
Figure 53.Catalent: Revenue Share By Region, 2020 (%)
Figure 54.Ccl: Net Sales, 2017–2019 ($Million)
Figure 55.Ccl: Revenue Share By Segment, 2019 (%)
Figure 56.Ccl: Revenue Share By Region, 2019 (%)
Figure 57.Gerresheimer: Net Sales, 2017–2019 ($Million)
Figure 58.Gerresheimer: Revenue Share By Segment, 2019 (%)
Figure 59.Gerresheimer: Revenue Share By Region, 2019 (%)
Figure 60.Nipro Group: Net Sales, 2018–2020 ($Million)
Figure 61.Nipro Group: Revenue Share By Segment, 2020 (%)
Figure 62.Nipro Group: Revenue Share By Region, 2020 (%)
Figure 63.Schott Ag: Net Sales, 2017–2019 ($Million)
Figure 64.Schott Ag: Revenue Share By Segment, 2019 (%)
Figure 65.Schott Ag: Revenue Share By Region, 2019 (%)
Figure 66.West: Net Sales, 2017–2019 ($Million)
Figure 67.West: Revenue Share By Segment, 2019 (%)
Figure 68.West: Revenue Share By Region, 2019 (%)
$5540
$9280
HAVE A QUERY?
OUR CUSTOMER

SIMILAR REPORTS