0
U.S. (TOLL FREE)
+1 (315) 215-3225
Automative

0
U.S. (TOLL FREE)
+1 (315) 215-3225
Mobile Application Security Market by Component (Solution, Service), by Operating System (Android, iOS, Others), by Enterprise Size (Large Enterprise, Small and Medium-size Enterprise), by Industry Vertical (BFSI, IT and Telecom, Retail, Healthcare, Government, Education, Others): Global Opportunity Analysis and Industry Forecast, 2023-2032
Published Date: October 2023
|
Report Code: ALLI-Manu-0V91
Home | Market Reports | Computers & Electronics| Computer Security
Mobile Application Security Market
BUY CHAPTERS

Mobile Application Security Market by Component (Solution, Service), by Operating System (Android, iOS, Others), by Enterprise Size (Large Enterprise, Small and Medium-size Enterprise), by Industry Vertical (BFSI, IT and Telecom, Retail, Healthcare, Government, Education, Others): Global Opportunity Analysis and Industry Forecast, 2023-2032

Code: ALLI-Manu-0V91
Report
October 2023
Pages:260
Allied Market Research
Buy Now with 15% Discount
DESCRIPTION
TABLE OF CONTENT
TABLES & FIGURES

Mobile Application Market 

The global mobile application security market was valued at USD 3.7 Billion in 2022, and is projected to reach USD 37.1 Billion by 2032, growing at a CAGR of 26.3% from 2023 to 2032.

Major Trends

The growth of government digitization programmes and the adoption of digital transaction apps are the main market drivers for mobile application security. Additionally, the volume of mobile transactions has significantly increased as governments support digital transactions through various initiatives. The growing dependence on mobile applications for financial transactions has increased the need for robust security solutions to protect sensitive financial data, prevent fraud, and ensure secure transactions. 
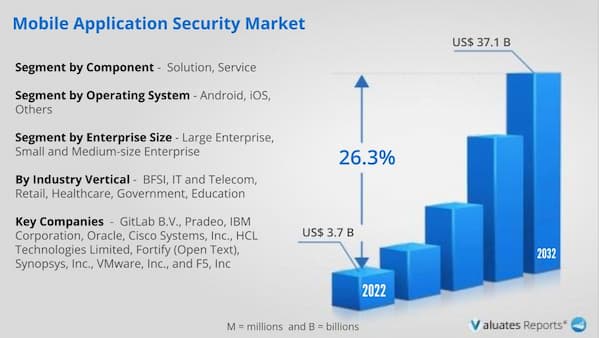
Mobile application security market

Mobile Application Market Trends

Governments are encouraging digital transactions through a variety of initiatives, which has led to a significant increase in the volume of mobile transactions. There is a larger demand for efficient security solutions as more people use mobile applications for financial transactions to protect sensitive financial data, prevent fraud, and ensure secure transactions. Data security and privacy have also become major concerns as the volume of digital transactions has expanded. Governments are putting a greater emphasis on protecting citizens' privacy and defending them from online dangers. Thus, government digitization initiatives and the rise in the popularity of digital transaction apps foster a favourable environment for the growth of the mobile application security industry. 

Businesses provide BYOD services to employees to promote mobility. BYOD enables employees to use their personal electronic devices, such as laptops, smartphones, and tablets, at work. Additionally, BYOD offers secure network-based mobile device communication. An improvement in productivity and employee satisfaction are the primary drivers of the BYOD trend's popularity. The three primary issues firms encounter when using BYOD are unauthorised data access, data loss and leakage, and malware attacks. The adoption of mobile device security solutions is therefore expected to expand due to the rising need for network security, better and enhanced data privacy, and security. 

Due to the increased usage of mobile banking and payment applications, mobile devices are increasingly being targeted by financial fraud. The mobile app market has made a sizable investment in security solutions as a result of the significance of safe transactions and the protection of financial data.

Mobile Application Market Share

The Asia-Pacific region is expected to have the biggest rise during the projected period since it is a hotspot for cyber threats and attacks against mobile apps. Cybercriminals leverage vulnerabilities in mobile applications to steal sensitive information, carry out fraud, and spread malware. The changing threat landscape necessitates the use of robust mobile app security solutions, including threat detection, safe coding practises, and real-time monitoring to prevent emerging cyber attacks.

Scope of Global Mobile Application Security Market Report

Report Metric Details
Report Name Global Mobile Application Security Market
Base Year 2022
Forecasted years 2022-2032
By Company
  • VMware, Inc
  • Fortify (Open Text)
  • Cisco Systems, Inc
  • HCL Technologies Limited
  • IBM Corporation
  • F5, Inc
  • Oracle
  • GitLab B.V.
  • Pradeo
  • Synopsys, Inc.
Segment by Component
  • Solution
  • Service
Segment by Operating System
  • Android
  • iOS
  • Others
Segment by Industry Vertical
  • BFSI
  • IT and Telecom
  • Retail
  • Healthcare
  • Government
  • Education
Segment by Enterprise Size
  • Large Enterprise
  • Small and Medium-size Enterprise
Consumption by Region
  • North America (United States, Canada)
  • Europe (Germany, France, UK, Italy, Russia)
  • Asia-Pacific (China, Japan, South Korea, Taiwan)
  • Southeast Asia (India)
  • Latin America (Mexico, Brazil)
Forecast units USD million in value
Report coverage Revenue and volume forecast, company share, competitive landscape, growth factors and trends

Frequently Asked Questions About This Report

1. Do you provide chapter wise report data? 

Ans. Yes, we do provide the option to buy chapters in a report. We also can customize the report based on your specific requirements.

2. How big is the Mobile Application Security market?

Ans: The global mobile application security market was valued at USD 3.7 Billion in 2022, and is projected to reach USD 37.1 Billion by 2032, growing at a CAGR of 26.3% from 2023 to 2032.

  • CHAPTER 1: INTRODUCTION
    • 1.1. Report description
    • 1.2. Key market segments
    • 1.3. Key benefits to the stakeholders
    • 1.4. Research Methodology
      • 1.4.1. Primary research
      • 1.4.2. Secondary research
      • 1.4.3. Analyst tools and models
  • CHAPTER 2: EXECUTIVE SUMMARY
    • 2.1. CXO Perspective
  • CHAPTER 3: MARKET OVERVIEW
    • 3.1. Market definition and scope
    • 3.2. Key findings
      • 3.2.1. Top impacting factors
      • 3.2.2. Top investment pockets
    • 3.3. Porter’s five forces analysis
      • 3.3.1. Bargaining power of suppliers
      • 3.3.2. Bargaining power of buyers
      • 3.3.3. Threat of substitutes
      • 3.3.4. Threat of new entrants
      • 3.3.5. Intensity of rivalry
    • 3.4. Market dynamics
      • 3.4.1. Drivers
        • 3.4.1.1. Rise in demand for security solutions to offer protection against web based malware
        • 3.4.1.2. The adoption of bring your own device (BYOD) policies
        • 3.4.1.3. Government initiatives for digitization and increase in penetration of digital transaction apps


      • 3.4.2. Restraints
        • 3.4.2.1. The complexity of designing embedded security solutions
        • 3.4.2.2. High cost of mobile application security solutions


      • 3.4.3. Opportunities
        • 3.4.3.1. Rise in usage of machine learning and artificial intelligence in mobile security application


    • 3.5. COVID-19 Impact Analysis on the market
  • CHAPTER 4: MOBILE APPLICATION SECURITY MARKET, BY COMPONENT
    • 4.1. Overview
      • 4.1.1. Market size and forecast
    • 4.2. Solution
      • 4.2.1. Key market trends, growth factors and opportunities
      • 4.2.2. Market size and forecast, by region
      • 4.2.3. Market share analysis by country
    • 4.3. Service
      • 4.3.1. Key market trends, growth factors and opportunities
      • 4.3.2. Market size and forecast, by region
      • 4.3.3. Market share analysis by country
  • CHAPTER 5: MOBILE APPLICATION SECURITY MARKET, BY OPERATING SYSTEM
    • 5.1. Overview
      • 5.1.1. Market size and forecast
    • 5.2. Android
      • 5.2.1. Key market trends, growth factors and opportunities
      • 5.2.2. Market size and forecast, by region
      • 5.2.3. Market share analysis by country
    • 5.3. iOS
      • 5.3.1. Key market trends, growth factors and opportunities
      • 5.3.2. Market size and forecast, by region
      • 5.3.3. Market share analysis by country
    • 5.4. Others
      • 5.4.1. Key market trends, growth factors and opportunities
      • 5.4.2. Market size and forecast, by region
      • 5.4.3. Market share analysis by country
  • CHAPTER 6: MOBILE APPLICATION SECURITY MARKET, BY ENTERPRISE SIZE
    • 6.1. Overview
      • 6.1.1. Market size and forecast
    • 6.2. Large Enterprise
      • 6.2.1. Key market trends, growth factors and opportunities
      • 6.2.2. Market size and forecast, by region
      • 6.2.3. Market share analysis by country
    • 6.3. Small and Medium-size Enterprise
      • 6.3.1. Key market trends, growth factors and opportunities
      • 6.3.2. Market size and forecast, by region
      • 6.3.3. Market share analysis by country
  • CHAPTER 7: MOBILE APPLICATION SECURITY MARKET, BY INDUSTRY VERTICAL
    • 7.1. Overview
      • 7.1.1. Market size and forecast
    • 7.2. BFSI
      • 7.2.1. Key market trends, growth factors and opportunities
      • 7.2.2. Market size and forecast, by region
      • 7.2.3. Market share analysis by country
    • 7.3. IT and Telecom
      • 7.3.1. Key market trends, growth factors and opportunities
      • 7.3.2. Market size and forecast, by region
      • 7.3.3. Market share analysis by country
    • 7.4. Retail
      • 7.4.1. Key market trends, growth factors and opportunities
      • 7.4.2. Market size and forecast, by region
      • 7.4.3. Market share analysis by country
    • 7.5. Healthcare
      • 7.5.1. Key market trends, growth factors and opportunities
      • 7.5.2. Market size and forecast, by region
      • 7.5.3. Market share analysis by country
    • 7.6. Government
      • 7.6.1. Key market trends, growth factors and opportunities
      • 7.6.2. Market size and forecast, by region
      • 7.6.3. Market share analysis by country
    • 7.7. Education
      • 7.7.1. Key market trends, growth factors and opportunities
      • 7.7.2. Market size and forecast, by region
      • 7.7.3. Market share analysis by country
    • 7.8. Others
      • 7.8.1. Key market trends, growth factors and opportunities
      • 7.8.2. Market size and forecast, by region
      • 7.8.3. Market share analysis by country
  • CHAPTER 8: MOBILE APPLICATION SECURITY MARKET, BY REGION
    • 8.1. Overview
      • 8.1.1. Market size and forecast By Region
    • 8.2. North America
      • 8.2.1. Key trends and opportunities
      • 8.2.2. Market size and forecast, by Component
      • 8.2.3. Market size and forecast, by Operating System
      • 8.2.4. Market size and forecast, by Enterprise Size
      • 8.2.5. Market size and forecast, by Industry Vertical
      • 8.2.6. Market size and forecast, by country
        • 8.2.6.1. U.S.
          • 8.2.6.1.1. Key market trends, growth factors and opportunities
          • 8.2.6.1.2. Market size and forecast, by Component
          • 8.2.6.1.3. Market size and forecast, by Operating System
          • 8.2.6.1.4. Market size and forecast, by Enterprise Size
          • 8.2.6.1.5. Market size and forecast, by Industry Vertical
        • 8.2.6.2. Canada
          • 8.2.6.2.1. Key market trends, growth factors and opportunities
          • 8.2.6.2.2. Market size and forecast, by Component
          • 8.2.6.2.3. Market size and forecast, by Operating System
          • 8.2.6.2.4. Market size and forecast, by Enterprise Size
          • 8.2.6.2.5. Market size and forecast, by Industry Vertical
    • 8.3. Europe
      • 8.3.1. Key trends and opportunities
      • 8.3.2. Market size and forecast, by Component
      • 8.3.3. Market size and forecast, by Operating System
      • 8.3.4. Market size and forecast, by Enterprise Size
      • 8.3.5. Market size and forecast, by Industry Vertical
      • 8.3.6. Market size and forecast, by country
        • 8.3.6.1. UK
          • 8.3.6.1.1. Key market trends, growth factors and opportunities
          • 8.3.6.1.2. Market size and forecast, by Component
          • 8.3.6.1.3. Market size and forecast, by Operating System
          • 8.3.6.1.4. Market size and forecast, by Enterprise Size
          • 8.3.6.1.5. Market size and forecast, by Industry Vertical
        • 8.3.6.2. Germany
          • 8.3.6.2.1. Key market trends, growth factors and opportunities
          • 8.3.6.2.2. Market size and forecast, by Component
          • 8.3.6.2.3. Market size and forecast, by Operating System
          • 8.3.6.2.4. Market size and forecast, by Enterprise Size
          • 8.3.6.2.5. Market size and forecast, by Industry Vertical
        • 8.3.6.3. France
          • 8.3.6.3.1. Key market trends, growth factors and opportunities
          • 8.3.6.3.2. Market size and forecast, by Component
          • 8.3.6.3.3. Market size and forecast, by Operating System
          • 8.3.6.3.4. Market size and forecast, by Enterprise Size
          • 8.3.6.3.5. Market size and forecast, by Industry Vertical
        • 8.3.6.4. Italy
          • 8.3.6.4.1. Key market trends, growth factors and opportunities
          • 8.3.6.4.2. Market size and forecast, by Component
          • 8.3.6.4.3. Market size and forecast, by Operating System
          • 8.3.6.4.4. Market size and forecast, by Enterprise Size
          • 8.3.6.4.5. Market size and forecast, by Industry Vertical
        • 8.3.6.5. Spain
          • 8.3.6.5.1. Key market trends, growth factors and opportunities
          • 8.3.6.5.2. Market size and forecast, by Component
          • 8.3.6.5.3. Market size and forecast, by Operating System
          • 8.3.6.5.4. Market size and forecast, by Enterprise Size
          • 8.3.6.5.5. Market size and forecast, by Industry Vertical
        • 8.3.6.6. Rest of Europe
          • 8.3.6.6.1. Key market trends, growth factors and opportunities
          • 8.3.6.6.2. Market size and forecast, by Component
          • 8.3.6.6.3. Market size and forecast, by Operating System
          • 8.3.6.6.4. Market size and forecast, by Enterprise Size
          • 8.3.6.6.5. Market size and forecast, by Industry Vertical
    • 8.4. Asia-Pacific
      • 8.4.1. Key trends and opportunities
      • 8.4.2. Market size and forecast, by Component
      • 8.4.3. Market size and forecast, by Operating System
      • 8.4.4. Market size and forecast, by Enterprise Size
      • 8.4.5. Market size and forecast, by Industry Vertical
      • 8.4.6. Market size and forecast, by country
        • 8.4.6.1. China
          • 8.4.6.1.1. Key market trends, growth factors and opportunities
          • 8.4.6.1.2. Market size and forecast, by Component
          • 8.4.6.1.3. Market size and forecast, by Operating System
          • 8.4.6.1.4. Market size and forecast, by Enterprise Size
          • 8.4.6.1.5. Market size and forecast, by Industry Vertical
        • 8.4.6.2. Japan
          • 8.4.6.2.1. Key market trends, growth factors and opportunities
          • 8.4.6.2.2. Market size and forecast, by Component
          • 8.4.6.2.3. Market size and forecast, by Operating System
          • 8.4.6.2.4. Market size and forecast, by Enterprise Size
          • 8.4.6.2.5. Market size and forecast, by Industry Vertical
        • 8.4.6.3. India
          • 8.4.6.3.1. Key market trends, growth factors and opportunities
          • 8.4.6.3.2. Market size and forecast, by Component
          • 8.4.6.3.3. Market size and forecast, by Operating System
          • 8.4.6.3.4. Market size and forecast, by Enterprise Size
          • 8.4.6.3.5. Market size and forecast, by Industry Vertical
        • 8.4.6.4. Australia
          • 8.4.6.4.1. Key market trends, growth factors and opportunities
          • 8.4.6.4.2. Market size and forecast, by Component
          • 8.4.6.4.3. Market size and forecast, by Operating System
          • 8.4.6.4.4. Market size and forecast, by Enterprise Size
          • 8.4.6.4.5. Market size and forecast, by Industry Vertical
        • 8.4.6.5. South Korea
          • 8.4.6.5.1. Key market trends, growth factors and opportunities
          • 8.4.6.5.2. Market size and forecast, by Component
          • 8.4.6.5.3. Market size and forecast, by Operating System
          • 8.4.6.5.4. Market size and forecast, by Enterprise Size
          • 8.4.6.5.5. Market size and forecast, by Industry Vertical
        • 8.4.6.6. Rest of Asia-Pacific
          • 8.4.6.6.1. Key market trends, growth factors and opportunities
          • 8.4.6.6.2. Market size and forecast, by Component
          • 8.4.6.6.3. Market size and forecast, by Operating System
          • 8.4.6.6.4. Market size and forecast, by Enterprise Size
          • 8.4.6.6.5. Market size and forecast, by Industry Vertical
    • 8.5. LAMEA
      • 8.5.1. Key trends and opportunities
      • 8.5.2. Market size and forecast, by Component
      • 8.5.3. Market size and forecast, by Operating System
      • 8.5.4. Market size and forecast, by Enterprise Size
      • 8.5.5. Market size and forecast, by Industry Vertical
      • 8.5.6. Market size and forecast, by country
        • 8.5.6.1. Latin America
          • 8.5.6.1.1. Key market trends, growth factors and opportunities
          • 8.5.6.1.2. Market size and forecast, by Component
          • 8.5.6.1.3. Market size and forecast, by Operating System
          • 8.5.6.1.4. Market size and forecast, by Enterprise Size
          • 8.5.6.1.5. Market size and forecast, by Industry Vertical
        • 8.5.6.2. Middle East
          • 8.5.6.2.1. Key market trends, growth factors and opportunities
          • 8.5.6.2.2. Market size and forecast, by Component
          • 8.5.6.2.3. Market size and forecast, by Operating System
          • 8.5.6.2.4. Market size and forecast, by Enterprise Size
          • 8.5.6.2.5. Market size and forecast, by Industry Vertical
        • 8.5.6.3. Africa
          • 8.5.6.3.1. Key market trends, growth factors and opportunities
          • 8.5.6.3.2. Market size and forecast, by Component
          • 8.5.6.3.3. Market size and forecast, by Operating System
          • 8.5.6.3.4. Market size and forecast, by Enterprise Size
          • 8.5.6.3.5. Market size and forecast, by Industry Vertical
  • CHAPTER 9: COMPETITIVE LANDSCAPE
    • 9.1. Introduction
    • 9.2. Top winning strategies
    • 9.3. Product Mapping of Top 10 Player
    • 9.4. Competitive Dashboard
    • 9.5. Competitive Heatmap
    • 9.6. Top player positioning, 2022
  • CHAPTER 10: COMPANY PROFILES
    • 10.1. IBM Corporation
      • 10.1.1. Company overview
      • 10.1.2. Key Executives
      • 10.1.3. Company snapshot
      • 10.1.4. Operating business segments
      • 10.1.5. Product portfolio
      • 10.1.6. Business performance
      • 10.1.7. Key strategic moves and developments
    • 10.2. Oracle
      • 10.2.1. Company overview
      • 10.2.2. Key Executives
      • 10.2.3. Company snapshot
      • 10.2.4. Operating business segments
      • 10.2.5. Product portfolio
      • 10.2.6. Business performance
      • 10.2.7. Key strategic moves and developments
    • 10.3. Cisco Systems, Inc.
      • 10.3.1. Company overview
      • 10.3.2. Key Executives
      • 10.3.3. Company snapshot
      • 10.3.4. Operating business segments
      • 10.3.5. Product portfolio
      • 10.3.6. Business performance
      • 10.3.7. Key strategic moves and developments
    • 10.4. HCL Technologies Limited
      • 10.4.1. Company overview
      • 10.4.2. Key Executives
      • 10.4.3. Company snapshot
      • 10.4.4. Operating business segments
      • 10.4.5. Product portfolio
      • 10.4.6. Business performance
      • 10.4.7. Key strategic moves and developments
    • 10.5. Fortify (Open Text)
      • 10.5.1. Company overview
      • 10.5.2. Key Executives
      • 10.5.3. Company snapshot
      • 10.5.4. Operating business segments
      • 10.5.5. Product portfolio
      • 10.5.6. Business performance
      • 10.5.7. Key strategic moves and developments
    • 10.6. Synopsys, Inc.
      • 10.6.1. Company overview
      • 10.6.2. Key Executives
      • 10.6.3. Company snapshot
      • 10.6.4. Operating business segments
      • 10.6.5. Product portfolio
      • 10.6.6. Business performance
      • 10.6.7. Key strategic moves and developments
    • 10.7. VMware, Inc.
      • 10.7.1. Company overview
      • 10.7.2. Key Executives
      • 10.7.3. Company snapshot
      • 10.7.4. Operating business segments
      • 10.7.5. Product portfolio
      • 10.7.6. Business performance
      • 10.7.7. Key strategic moves and developments
    • 10.8. GitLab B.V.
      • 10.8.1. Company overview
      • 10.8.2. Key Executives
      • 10.8.3. Company snapshot
      • 10.8.4. Operating business segments
      • 10.8.5. Product portfolio
      • 10.8.6. Business performance
      • 10.8.7. Key strategic moves and developments
    • 10.9. Pradeo
      • 10.9.1. Company overview
      • 10.9.2. Key Executives
      • 10.9.3. Company snapshot
      • 10.9.4. Operating business segments
      • 10.9.5. Product portfolio
    • 10.10. F5, Inc.
      • 10.10.1. Company overview
      • 10.10.2. Key Executives
      • 10.10.3. Company snapshot
      • 10.10.4. Operating business segments
      • 10.10.5. Product portfolio
      • 10.10.6. Business performance
      • 10.10.7. Key strategic moves and developments


List of Tables

  • TABLE 01. GLOBAL MOBILE APPLICATION SECURITY MARKET, BY COMPONENT, 2022-2032 ($MILLION)
    TABLE 02. MOBILE APPLICATION SECURITY MARKET FOR SOLUTION, BY REGION, 2022-2032 ($MILLION)
    TABLE 03. MOBILE APPLICATION SECURITY MARKET FOR SERVICE, BY REGION, 2022-2032 ($MILLION)
    TABLE 04. GLOBAL MOBILE APPLICATION SECURITY MARKET, BY OPERATING SYSTEM, 2022-2032 ($MILLION)
    TABLE 05. MOBILE APPLICATION SECURITY MARKET FOR ANDROID, BY REGION, 2022-2032 ($MILLION)
    TABLE 06. MOBILE APPLICATION SECURITY MARKET FOR IOS, BY REGION, 2022-2032 ($MILLION)
    TABLE 07. MOBILE APPLICATION SECURITY MARKET FOR OTHERS, BY REGION, 2022-2032 ($MILLION)
    TABLE 08. GLOBAL MOBILE APPLICATION SECURITY MARKET, BY ENTERPRISE SIZE, 2022-2032 ($MILLION)
    TABLE 09. MOBILE APPLICATION SECURITY MARKET FOR LARGE ENTERPRISE, BY REGION, 2022-2032 ($MILLION)
    TABLE 10. MOBILE APPLICATION SECURITY MARKET FOR SMALL AND MEDIUM-SIZE ENTERPRISE, BY REGION, 2022-2032 ($MILLION)
    TABLE 11. GLOBAL MOBILE APPLICATION SECURITY MARKET, BY INDUSTRY VERTICAL, 2022-2032 ($MILLION)
    TABLE 12. MOBILE APPLICATION SECURITY MARKET FOR BFSI, BY REGION, 2022-2032 ($MILLION)
    TABLE 13. MOBILE APPLICATION SECURITY MARKET FOR IT AND TELECOM, BY REGION, 2022-2032 ($MILLION)
    TABLE 14. MOBILE APPLICATION SECURITY MARKET FOR RETAIL, BY REGION, 2022-2032 ($MILLION)
    TABLE 15. MOBILE APPLICATION SECURITY MARKET FOR HEALTHCARE, BY REGION, 2022-2032 ($MILLION)
    TABLE 16. MOBILE APPLICATION SECURITY MARKET FOR GOVERNMENT, BY REGION, 2022-2032 ($MILLION)
    TABLE 17. MOBILE APPLICATION SECURITY MARKET FOR EDUCATION, BY REGION, 2022-2032 ($MILLION)
    TABLE 18. MOBILE APPLICATION SECURITY MARKET FOR OTHERS, BY REGION, 2022-2032 ($MILLION)
    TABLE 19. MOBILE APPLICATION SECURITY MARKET, BY REGION, 2022-2032 ($MILLION)
    TABLE 20. NORTH AMERICA MOBILE APPLICATION SECURITY MARKET, BY COMPONENT, 2022-2032 ($MILLION)
    TABLE 21. NORTH AMERICA MOBILE APPLICATION SECURITY MARKET, BY OPERATING SYSTEM, 2022-2032 ($MILLION)
    TABLE 22. NORTH AMERICA MOBILE APPLICATION SECURITY MARKET, BY ENTERPRISE SIZE, 2022-2032 ($MILLION)
    TABLE 23. NORTH AMERICA MOBILE APPLICATION SECURITY MARKET, BY INDUSTRY VERTICAL, 2022-2032 ($MILLION)
    TABLE 24. NORTH AMERICA MOBILE APPLICATION SECURITY MARKET, BY COUNTRY, 2022-2032 ($MILLION)
    TABLE 25. U.S. MOBILE APPLICATION SECURITY MARKET, BY COMPONENT, 2022-2032 ($MILLION)
    TABLE 26. U.S. MOBILE APPLICATION SECURITY MARKET, BY OPERATING SYSTEM, 2022-2032 ($MILLION)
    TABLE 27. U.S. MOBILE APPLICATION SECURITY MARKET, BY ENTERPRISE SIZE, 2022-2032 ($MILLION)
    TABLE 28. U.S. MOBILE APPLICATION SECURITY MARKET, BY INDUSTRY VERTICAL, 2022-2032 ($MILLION)
    TABLE 29. CANADA MOBILE APPLICATION SECURITY MARKET, BY COMPONENT, 2022-2032 ($MILLION)
    TABLE 30. CANADA MOBILE APPLICATION SECURITY MARKET, BY OPERATING SYSTEM, 2022-2032 ($MILLION)
    TABLE 31. CANADA MOBILE APPLICATION SECURITY MARKET, BY ENTERPRISE SIZE, 2022-2032 ($MILLION)
    TABLE 32. CANADA MOBILE APPLICATION SECURITY MARKET, BY INDUSTRY VERTICAL, 2022-2032 ($MILLION)
    TABLE 33. EUROPE MOBILE APPLICATION SECURITY MARKET, BY COMPONENT, 2022-2032 ($MILLION)
    TABLE 34. EUROPE MOBILE APPLICATION SECURITY MARKET, BY OPERATING SYSTEM, 2022-2032 ($MILLION)
    TABLE 35. EUROPE MOBILE APPLICATION SECURITY MARKET, BY ENTERPRISE SIZE, 2022-2032 ($MILLION)
    TABLE 36. EUROPE MOBILE APPLICATION SECURITY MARKET, BY INDUSTRY VERTICAL, 2022-2032 ($MILLION)
    TABLE 37. EUROPE MOBILE APPLICATION SECURITY MARKET, BY COUNTRY, 2022-2032 ($MILLION)
    TABLE 38. UK MOBILE APPLICATION SECURITY MARKET, BY COMPONENT, 2022-2032 ($MILLION)
    TABLE 39. UK MOBILE APPLICATION SECURITY MARKET, BY OPERATING SYSTEM, 2022-2032 ($MILLION)
    TABLE 40. UK MOBILE APPLICATION SECURITY MARKET, BY ENTERPRISE SIZE, 2022-2032 ($MILLION)
    TABLE 41. UK MOBILE APPLICATION SECURITY MARKET, BY INDUSTRY VERTICAL, 2022-2032 ($MILLION)
    TABLE 42. GERMANY MOBILE APPLICATION SECURITY MARKET, BY COMPONENT, 2022-2032 ($MILLION)
    TABLE 43. GERMANY MOBILE APPLICATION SECURITY MARKET, BY OPERATING SYSTEM, 2022-2032 ($MILLION)
    TABLE 44. GERMANY MOBILE APPLICATION SECURITY MARKET, BY ENTERPRISE SIZE, 2022-2032 ($MILLION)
    TABLE 45. GERMANY MOBILE APPLICATION SECURITY MARKET, BY INDUSTRY VERTICAL, 2022-2032 ($MILLION)
    TABLE 46. FRANCE MOBILE APPLICATION SECURITY MARKET, BY COMPONENT, 2022-2032 ($MILLION)
    TABLE 47. FRANCE MOBILE APPLICATION SECURITY MARKET, BY OPERATING SYSTEM, 2022-2032 ($MILLION)
    TABLE 48. FRANCE MOBILE APPLICATION SECURITY MARKET, BY ENTERPRISE SIZE, 2022-2032 ($MILLION)
    TABLE 49. FRANCE MOBILE APPLICATION SECURITY MARKET, BY INDUSTRY VERTICAL, 2022-2032 ($MILLION)
    TABLE 50. ITALY MOBILE APPLICATION SECURITY MARKET, BY COMPONENT, 2022-2032 ($MILLION)
    TABLE 51. ITALY MOBILE APPLICATION SECURITY MARKET, BY OPERATING SYSTEM, 2022-2032 ($MILLION)
    TABLE 52. ITALY MOBILE APPLICATION SECURITY MARKET, BY ENTERPRISE SIZE, 2022-2032 ($MILLION)
    TABLE 53. ITALY MOBILE APPLICATION SECURITY MARKET, BY INDUSTRY VERTICAL, 2022-2032 ($MILLION)
    TABLE 54. SPAIN MOBILE APPLICATION SECURITY MARKET, BY COMPONENT, 2022-2032 ($MILLION)
    TABLE 55. SPAIN MOBILE APPLICATION SECURITY MARKET, BY OPERATING SYSTEM, 2022-2032 ($MILLION)
    TABLE 56. SPAIN MOBILE APPLICATION SECURITY MARKET, BY ENTERPRISE SIZE, 2022-2032 ($MILLION)
    TABLE 57. SPAIN MOBILE APPLICATION SECURITY MARKET, BY INDUSTRY VERTICAL, 2022-2032 ($MILLION)
    TABLE 58. REST OF EUROPE MOBILE APPLICATION SECURITY MARKET, BY COMPONENT, 2022-2032 ($MILLION)
    TABLE 59. REST OF EUROPE MOBILE APPLICATION SECURITY MARKET, BY OPERATING SYSTEM, 2022-2032 ($MILLION)
    TABLE 60. REST OF EUROPE MOBILE APPLICATION SECURITY MARKET, BY ENTERPRISE SIZE, 2022-2032 ($MILLION)
    TABLE 61. REST OF EUROPE MOBILE APPLICATION SECURITY MARKET, BY INDUSTRY VERTICAL, 2022-2032 ($MILLION)
    TABLE 62. ASIA-PACIFIC MOBILE APPLICATION SECURITY MARKET, BY COMPONENT, 2022-2032 ($MILLION)
    TABLE 63. ASIA-PACIFIC MOBILE APPLICATION SECURITY MARKET, BY OPERATING SYSTEM, 2022-2032 ($MILLION)
    TABLE 64. ASIA-PACIFIC MOBILE APPLICATION SECURITY MARKET, BY ENTERPRISE SIZE, 2022-2032 ($MILLION)
    TABLE 65. ASIA-PACIFIC MOBILE APPLICATION SECURITY MARKET, BY INDUSTRY VERTICAL, 2022-2032 ($MILLION)
    TABLE 66. ASIA-PACIFIC MOBILE APPLICATION SECURITY MARKET, BY COUNTRY, 2022-2032 ($MILLION)
    TABLE 67. CHINA MOBILE APPLICATION SECURITY MARKET, BY COMPONENT, 2022-2032 ($MILLION)
    TABLE 68. CHINA MOBILE APPLICATION SECURITY MARKET, BY OPERATING SYSTEM, 2022-2032 ($MILLION)
    TABLE 69. CHINA MOBILE APPLICATION SECURITY MARKET, BY ENTERPRISE SIZE, 2022-2032 ($MILLION)
    TABLE 70. CHINA MOBILE APPLICATION SECURITY MARKET, BY INDUSTRY VERTICAL, 2022-2032 ($MILLION)
    TABLE 71. JAPAN MOBILE APPLICATION SECURITY MARKET, BY COMPONENT, 2022-2032 ($MILLION)
    TABLE 72. JAPAN MOBILE APPLICATION SECURITY MARKET, BY OPERATING SYSTEM, 2022-2032 ($MILLION)
    TABLE 73. JAPAN MOBILE APPLICATION SECURITY MARKET, BY ENTERPRISE SIZE, 2022-2032 ($MILLION)
    TABLE 74. JAPAN MOBILE APPLICATION SECURITY MARKET, BY INDUSTRY VERTICAL, 2022-2032 ($MILLION)
    TABLE 75. INDIA MOBILE APPLICATION SECURITY MARKET, BY COMPONENT, 2022-2032 ($MILLION)
    TABLE 76. INDIA MOBILE APPLICATION SECURITY MARKET, BY OPERATING SYSTEM, 2022-2032 ($MILLION)
    TABLE 77. INDIA MOBILE APPLICATION SECURITY MARKET, BY ENTERPRISE SIZE, 2022-2032 ($MILLION)
    TABLE 78. INDIA MOBILE APPLICATION SECURITY MARKET, BY INDUSTRY VERTICAL, 2022-2032 ($MILLION)
    TABLE 79. AUSTRALIA MOBILE APPLICATION SECURITY MARKET, BY COMPONENT, 2022-2032 ($MILLION)
    TABLE 80. AUSTRALIA MOBILE APPLICATION SECURITY MARKET, BY OPERATING SYSTEM, 2022-2032 ($MILLION)
    TABLE 81. AUSTRALIA MOBILE APPLICATION SECURITY MARKET, BY ENTERPRISE SIZE, 2022-2032 ($MILLION)
    TABLE 82. AUSTRALIA MOBILE APPLICATION SECURITY MARKET, BY INDUSTRY VERTICAL, 2022-2032 ($MILLION)
    TABLE 83. SOUTH KOREA MOBILE APPLICATION SECURITY MARKET, BY COMPONENT, 2022-2032 ($MILLION)
    TABLE 84. SOUTH KOREA MOBILE APPLICATION SECURITY MARKET, BY OPERATING SYSTEM, 2022-2032 ($MILLION)
    TABLE 85. SOUTH KOREA MOBILE APPLICATION SECURITY MARKET, BY ENTERPRISE SIZE, 2022-2032 ($MILLION)
    TABLE 86. SOUTH KOREA MOBILE APPLICATION SECURITY MARKET, BY INDUSTRY VERTICAL, 2022-2032 ($MILLION)
    TABLE 87. REST OF ASIA-PACIFIC MOBILE APPLICATION SECURITY MARKET, BY COMPONENT, 2022-2032 ($MILLION)
    TABLE 88. REST OF ASIA-PACIFIC MOBILE APPLICATION SECURITY MARKET, BY OPERATING SYSTEM, 2022-2032 ($MILLION)
    TABLE 89. REST OF ASIA-PACIFIC MOBILE APPLICATION SECURITY MARKET, BY ENTERPRISE SIZE, 2022-2032 ($MILLION)
    TABLE 90. REST OF ASIA-PACIFIC MOBILE APPLICATION SECURITY MARKET, BY INDUSTRY VERTICAL, 2022-2032 ($MILLION)
    TABLE 91. LAMEA MOBILE APPLICATION SECURITY MARKET, BY COMPONENT, 2022-2032 ($MILLION)
    TABLE 92. LAMEA MOBILE APPLICATION SECURITY MARKET, BY OPERATING SYSTEM, 2022-2032 ($MILLION)
    TABLE 93. LAMEA MOBILE APPLICATION SECURITY MARKET, BY ENTERPRISE SIZE, 2022-2032 ($MILLION)
    TABLE 94. LAMEA MOBILE APPLICATION SECURITY MARKET, BY INDUSTRY VERTICAL, 2022-2032 ($MILLION)
    TABLE 95. LAMEA MOBILE APPLICATION SECURITY MARKET, BY COUNTRY, 2022-2032 ($MILLION)
    TABLE 96. LATIN AMERICA MOBILE APPLICATION SECURITY MARKET, BY COMPONENT, 2022-2032 ($MILLION)
    TABLE 97. LATIN AMERICA MOBILE APPLICATION SECURITY MARKET, BY OPERATING SYSTEM, 2022-2032 ($MILLION)
    TABLE 98. LATIN AMERICA MOBILE APPLICATION SECURITY MARKET, BY ENTERPRISE SIZE, 2022-2032 ($MILLION)
    TABLE 99. LATIN AMERICA MOBILE APPLICATION SECURITY MARKET, BY INDUSTRY VERTICAL, 2022-2032 ($MILLION)
    TABLE 100. MIDDLE EAST MOBILE APPLICATION SECURITY MARKET, BY COMPONENT, 2022-2032 ($MILLION)
    TABLE 101. MIDDLE EAST MOBILE APPLICATION SECURITY MARKET, BY OPERATING SYSTEM, 2022-2032 ($MILLION)
    TABLE 102. MIDDLE EAST MOBILE APPLICATION SECURITY MARKET, BY ENTERPRISE SIZE, 2022-2032 ($MILLION)
    TABLE 103. MIDDLE EAST MOBILE APPLICATION SECURITY MARKET, BY INDUSTRY VERTICAL, 2022-2032 ($MILLION)
    TABLE 104. AFRICA MOBILE APPLICATION SECURITY MARKET, BY COMPONENT, 2022-2032 ($MILLION)
    TABLE 105. AFRICA MOBILE APPLICATION SECURITY MARKET, BY OPERATING SYSTEM, 2022-2032 ($MILLION)
    TABLE 106. AFRICA MOBILE APPLICATION SECURITY MARKET, BY ENTERPRISE SIZE, 2022-2032 ($MILLION)
    TABLE 107. AFRICA MOBILE APPLICATION SECURITY MARKET, BY INDUSTRY VERTICAL, 2022-2032 ($MILLION)
    TABLE 108. IBM CORPORATION: KEY EXECUTIVES
    TABLE 109. IBM CORPORATION: COMPANY SNAPSHOT
    TABLE 110. IBM CORPORATION: SERVICE SEGMENTS
    TABLE 111. IBM CORPORATION: PRODUCT PORTFOLIO
    TABLE 112. IBM CORPORATION: KEY STRATERGIES
    TABLE 113. ORACLE: KEY EXECUTIVES
    TABLE 114. ORACLE: COMPANY SNAPSHOT
    TABLE 115. ORACLE: SERVICE SEGMENTS
    TABLE 116. ORACLE: PRODUCT PORTFOLIO
    TABLE 117. ORACLE: KEY STRATERGIES
    TABLE 118. CISCO SYSTEMS, INC.: KEY EXECUTIVES
    TABLE 119. CISCO SYSTEMS, INC.: COMPANY SNAPSHOT
    TABLE 120. CISCO SYSTEMS, INC.: SERVICE SEGMENTS
    TABLE 121. CISCO SYSTEMS, INC.: PRODUCT PORTFOLIO
    TABLE 122. CISCO SYSTEMS, INC.: KEY STRATERGIES
    TABLE 123. HCL TECHNOLOGIES LIMITED: KEY EXECUTIVES
    TABLE 124. HCL TECHNOLOGIES LIMITED: COMPANY SNAPSHOT
    TABLE 125. HCL TECHNOLOGIES LIMITED: SERVICE SEGMENTS
    TABLE 126. HCL TECHNOLOGIES LIMITED: PRODUCT PORTFOLIO
    TABLE 127. HCL TECHNOLOGIES LIMITED: KEY STRATERGIES
    TABLE 128. FORTIFY (OPEN TEXT): KEY EXECUTIVES
    TABLE 129. FORTIFY (OPEN TEXT): COMPANY SNAPSHOT
    TABLE 130. FORTIFY (OPEN TEXT): SERVICE SEGMENTS
    TABLE 131. FORTIFY (OPEN TEXT): PRODUCT PORTFOLIO
    TABLE 132. FORTIFY (OPEN TEXT): KEY STRATERGIES
    TABLE 133. SYNOPSYS, INC.: KEY EXECUTIVES
    TABLE 134. SYNOPSYS, INC.: COMPANY SNAPSHOT
    TABLE 135. SYNOPSYS, INC.: SERVICE SEGMENTS
    TABLE 136. SYNOPSYS, INC.: PRODUCT PORTFOLIO
    TABLE 137. SYNOPSYS, INC.: KEY STRATERGIES
    TABLE 138. VMWARE, INC.: KEY EXECUTIVES
    TABLE 139. VMWARE, INC.: COMPANY SNAPSHOT
    TABLE 140. VMWARE, INC.: SERVICE SEGMENTS
    TABLE 141. VMWARE, INC.: PRODUCT PORTFOLIO
    TABLE 142. VMWARE, INC.: KEY STRATERGIES
    TABLE 143. GITLAB B.V.: KEY EXECUTIVES
    TABLE 144. GITLAB B.V.: COMPANY SNAPSHOT
    TABLE 145. GITLAB B.V.: SERVICE SEGMENTS
    TABLE 146. GITLAB B.V.: PRODUCT PORTFOLIO
    TABLE 147. GITLAB B.V.: KEY STRATERGIES
    TABLE 148. PRADEO: KEY EXECUTIVES
    TABLE 149. PRADEO: COMPANY SNAPSHOT
    TABLE 150. PRADEO: SERVICE SEGMENTS
    TABLE 151. PRADEO: PRODUCT PORTFOLIO
    TABLE 152. F5, INC.: KEY EXECUTIVES
    TABLE 153. F5, INC.: COMPANY SNAPSHOT
    TABLE 154. F5, INC.: SERVICE SEGMENTS
    TABLE 155. F5, INC.: PRODUCT PORTFOLIO
    TABLE 156. F5, INC.: KEY STRATERGIES


List of Figures

  • FIGURE 01. MOBILE APPLICATION SECURITY MARKET, 2022-2032
    FIGURE 02. SEGMENTATION OF MOBILE APPLICATION SECURITY MARKET, 2022-2032
    FIGURE 03. TOP INVESTMENT POCKETS IN MOBILE APPLICATION SECURITY MARKET (2023-2032)
    FIGURE 04. LOW BARGAINING POWER OF SUPPLIERS
    FIGURE 05. LOW BARGAINING POWER OF BUYERS
    FIGURE 06. LOW THREAT OF SUBSTITUTES
    FIGURE 07. LOW THREAT OF NEW ENTRANTS
    FIGURE 08. LOW INTENSITY OF RIVALRY
    FIGURE 09. DRIVERS, RESTRAINTS AND OPPORTUNITIES: GLOBALMOBILE APPLICATION SECURITY MARKET
    FIGURE 10. MOBILE APPLICATION SECURITY MARKET, BY COMPONENT, 2022(%)
    FIGURE 11. COMPARATIVE SHARE ANALYSIS OF MOBILE APPLICATION SECURITY MARKET FOR SOLUTION, BY COUNTRY 2022 AND 2032(%)
    FIGURE 12. COMPARATIVE SHARE ANALYSIS OF MOBILE APPLICATION SECURITY MARKET FOR SERVICE, BY COUNTRY 2022 AND 2032(%)
    FIGURE 13. MOBILE APPLICATION SECURITY MARKET, BY OPERATING SYSTEM, 2022(%)
    FIGURE 14. COMPARATIVE SHARE ANALYSIS OF MOBILE APPLICATION SECURITY MARKET FOR ANDROID, BY COUNTRY 2022 AND 2032(%)
    FIGURE 15. COMPARATIVE SHARE ANALYSIS OF MOBILE APPLICATION SECURITY MARKET FOR IOS, BY COUNTRY 2022 AND 2032(%)
    FIGURE 16. COMPARATIVE SHARE ANALYSIS OF MOBILE APPLICATION SECURITY MARKET FOR OTHERS, BY COUNTRY 2022 AND 2032(%)
    FIGURE 17. MOBILE APPLICATION SECURITY MARKET, BY ENTERPRISE SIZE, 2022(%)
    FIGURE 18. COMPARATIVE SHARE ANALYSIS OF MOBILE APPLICATION SECURITY MARKET FOR LARGE ENTERPRISE, BY COUNTRY 2022 AND 2032(%)
    FIGURE 19. COMPARATIVE SHARE ANALYSIS OF MOBILE APPLICATION SECURITY MARKET FOR SMALL AND MEDIUM-SIZE ENTERPRISE, BY COUNTRY 2022 AND 2032(%)
    FIGURE 20. MOBILE APPLICATION SECURITY MARKET, BY INDUSTRY VERTICAL, 2022(%)
    FIGURE 21. COMPARATIVE SHARE ANALYSIS OF MOBILE APPLICATION SECURITY MARKET FOR BFSI, BY COUNTRY 2022 AND 2032(%)
    FIGURE 22. COMPARATIVE SHARE ANALYSIS OF MOBILE APPLICATION SECURITY MARKET FOR IT AND TELECOM, BY COUNTRY 2022 AND 2032(%)
    FIGURE 23. COMPARATIVE SHARE ANALYSIS OF MOBILE APPLICATION SECURITY MARKET FOR RETAIL, BY COUNTRY 2022 AND 2032(%)
    FIGURE 24. COMPARATIVE SHARE ANALYSIS OF MOBILE APPLICATION SECURITY MARKET FOR HEALTHCARE, BY COUNTRY 2022 AND 2032(%)
    FIGURE 25. COMPARATIVE SHARE ANALYSIS OF MOBILE APPLICATION SECURITY MARKET FOR GOVERNMENT, BY COUNTRY 2022 AND 2032(%)
    FIGURE 26. COMPARATIVE SHARE ANALYSIS OF MOBILE APPLICATION SECURITY MARKET FOR EDUCATION, BY COUNTRY 2022 AND 2032(%)
    FIGURE 27. COMPARATIVE SHARE ANALYSIS OF MOBILE APPLICATION SECURITY MARKET FOR OTHERS, BY COUNTRY 2022 AND 2032(%)
    FIGURE 28. MOBILE APPLICATION SECURITY MARKET BY REGION, 2022
    FIGURE 29. U.S. MOBILE APPLICATION SECURITY MARKET, 2022-2032 ($MILLION)
    FIGURE 30. CANADA MOBILE APPLICATION SECURITY MARKET, 2022-2032 ($MILLION)
    FIGURE 31. UK MOBILE APPLICATION SECURITY MARKET, 2022-2032 ($MILLION)
    FIGURE 32. GERMANY MOBILE APPLICATION SECURITY MARKET, 2022-2032 ($MILLION)
    FIGURE 33. FRANCE MOBILE APPLICATION SECURITY MARKET, 2022-2032 ($MILLION)
    FIGURE 34. ITALY MOBILE APPLICATION SECURITY MARKET, 2022-2032 ($MILLION)
    FIGURE 35. SPAIN MOBILE APPLICATION SECURITY MARKET, 2022-2032 ($MILLION)
    FIGURE 36. REST OF EUROPE MOBILE APPLICATION SECURITY MARKET, 2022-2032 ($MILLION)
    FIGURE 37. CHINA MOBILE APPLICATION SECURITY MARKET, 2022-2032 ($MILLION)
    FIGURE 38. JAPAN MOBILE APPLICATION SECURITY MARKET, 2022-2032 ($MILLION)
    FIGURE 39. INDIA MOBILE APPLICATION SECURITY MARKET, 2022-2032 ($MILLION)
    FIGURE 40. AUSTRALIA MOBILE APPLICATION SECURITY MARKET, 2022-2032 ($MILLION)
    FIGURE 41. SOUTH KOREA MOBILE APPLICATION SECURITY MARKET, 2022-2032 ($MILLION)
    FIGURE 42. REST OF ASIA-PACIFIC MOBILE APPLICATION SECURITY MARKET, 2022-2032 ($MILLION)
    FIGURE 43. LATIN AMERICA MOBILE APPLICATION SECURITY MARKET, 2022-2032 ($MILLION)
    FIGURE 44. MIDDLE EAST MOBILE APPLICATION SECURITY MARKET, 2022-2032 ($MILLION)
    FIGURE 45. AFRICA MOBILE APPLICATION SECURITY MARKET, 2022-2032 ($MILLION)
    FIGURE 46. TOP WINNING STRATEGIES, BY YEAR
    FIGURE 47. TOP WINNING STRATEGIES, BY DEVELOPMENT
    FIGURE 48. TOP WINNING STRATEGIES, BY COMPANY
    FIGURE 49. PRODUCT MAPPING OF TOP 10 PLAYERS
    FIGURE 50. COMPETITIVE DASHBOARD
    FIGURE 51. COMPETITIVE HEATMAP: MOBILE APPLICATION SECURITY MARKET
    FIGURE 52. TOP PLAYER POSITIONING, 2022
    FIGURE 53. IBM CORPORATION: RESEARCH & DEVELOPMENT EXPENDITURE, 2020-2022 ($MILLION)
    FIGURE 54. IBM CORPORATION: NET REVENUE, 2020-2022 ($MILLION)
    FIGURE 55. IBM CORPORATION: REVENUE SHARE BY SEGMENT, 2022 (%)
    FIGURE 56. IBM CORPORATION: REVENUE SHARE BY REGION, 2022 (%)
    FIGURE 57. ORACLE: NET REVENUE, 2020-2022 ($MILLION)
    FIGURE 58. ORACLE: RESEARCH & DEVELOPMENT EXPENDITURE, 2020-2022 ($MILLION)
    FIGURE 59. ORACLE: REVENUE SHARE BY SEGMENT, 2022 (%)
    FIGURE 60. ORACLE: REVENUE SHARE BY REGION, 2022 (%)
    FIGURE 61. CISCO SYSTEMS, INC.: NET REVENUE, 2020-2022 ($MILLION)
    FIGURE 62. CISCO SYSTEMS, INC.: RESEARCH & DEVELOPMENT EXPENDITURE, 2020-2022 ($MILLION)
    FIGURE 63. CISCO SYSTEMS, INC.: REVENUE SHARE BY SEGMENT, 2022 (%)
    FIGURE 64. HCL TECHNOLOGIES LIMITED: NET REVENUE, 2020-2022 ($MILLION)
    FIGURE 65. HCL TECHNOLOGIES LIMITED: RESEARCH & DEVELOPMENT EXPENDITURE, 2020-2022 ($MILLION)
    FIGURE 66. HCL TECHNOLOGIES LIMITED: REVENUE SHARE BY SEGMENT, 2022 (%)
    FIGURE 67. HCL TECHNOLOGIES LIMITED: REVENUE SHARE BY REGION, 2022 (%)
    FIGURE 68. FORTIFY (OPEN TEXT): NET REVENUE, 2020-2022 ($MILLION)
    FIGURE 69. FORTIFY (OPEN TEXT): RESEARCH & DEVELOPMENT EXPENDITURE, 2020-2022 ($MILLION)
    FIGURE 70. FORTIFY (OPEN TEXT): REVENUE SHARE BY SEGMENT, 2022 (%)
    FIGURE 71. SYNOPSYS, INC.: NET REVENUE, 2020-2022 ($MILLION)
    FIGURE 72. SYNOPSYS, INC.: RESEARCH & DEVELOPMENT EXPENDITURE, 2020-2022 ($MILLION)
    FIGURE 73. SYNOPSYS, INC.: REVENUE SHARE BY SEGMENT, 2022 (%)
    FIGURE 74. SYNOPSYS, INC.: REVENUE SHARE BY REGION, 2022 (%)
    FIGURE 75. VMWARE, INC.: NET REVENUE, 2020-2022 ($MILLION)
    FIGURE 76. VMWARE, INC.: RESEARCH & DEVELOPMENT EXPENDITURE, 2020-2022 ($MILLION)
    FIGURE 77. VMWARE, INC.: REVENUE SHARE BY REGION, 2022 (%)
    FIGURE 78. VMWARE, INC.: REVENUE SHARE BY SEGMENT, 2022 (%)
    FIGURE 79. GITLAB B.V.: NET REVENUE, 2021-2023 ($MILLION)
    FIGURE 80. GITLAB B.V.: RESEARCH & DEVELOPMENT EXPENDITURE, 2021-2023 ($MILLION)
    FIGURE 81. F5, INC.: NET REVENUE, 2020-2022 ($MILLION)
    FIGURE 82. F5, INC.: RESEARCH & DEVELOPMENT EXPENDITURE, 2020-2022 ($MILLION)
    FIGURE 83. F5, INC.: REVENUE SHARE BY SEGMENT, 2022 (%)
    FIGURE 84. F5, INC.: REVENUE SHARE BY REGION, 2022 (%)
SELECT A FORMAT
Added to Cart
Electronic (PDF)

$5730

This license allows only one user to access the PDF.
Electronic (PDF)

$9600

This license allows users/teams in a same Enterprise to use this report, various departments within an enterpise can use this report
Add to Cart
Buy Now (15% Discount)

OUR CUSTOMER

Nano String

SIMILAR REPORTS


RELATED REPORTS

SSL Devices - Global Market Share and Ranking, Overall Sales and Demand Forecast 2024-2030

120 Pages
Type: Report
Code: QYRE-Auto-3S7933
Thu Oct 10 00:00:00 UTC 2024

Add to Cart

Spear Phishing Protection - Global Market Share and Ranking, Overall Sales and Demand Forecast 2024-2030

120 Pages
Type: Report
Code: QYRE-Auto-5A3408
Tue Oct 08 00:00:00 UTC 2024

Add to Cart

Next-Generation Firewall (NGFW) - Global Market Share and Ranking, Overall Sales and Demand Forecast 2024-2030

120 Pages
Type: Report
Code: QYRE-Auto-32V6065
Tue Oct 08 00:00:00 UTC 2024

Add to Cart

Mobile Data Protection Solutions - Global Market Share and Ranking, Overall Sales and Demand Forecast 2024-2030

120 Pages
Type: Report
Code: QYRE-Auto-26D3990
Tue Oct 08 00:00:00 UTC 2024

Add to Cart