
Bioplastics Market 2030
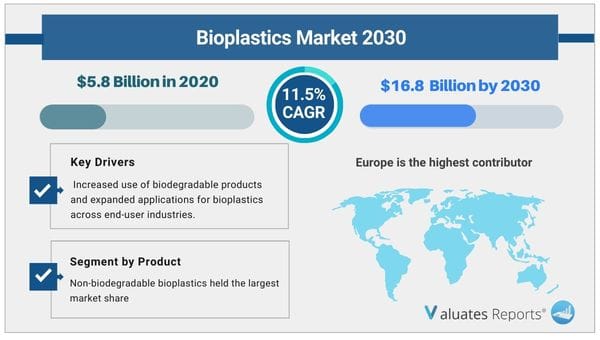
The global bioplastics market size was valued at USD 5.8 Billion in 2020 and is projected to reach USD 16.8 Billion by 2030, growing at a CAGR of 11.5% from 2021 to 2030.
Bioplastics are plastics produced using renewable raw materials like cellulose, sugarcane, and corn. Manufacturers can use bio-based plastics because of elements including their environmental friendliness, the availability of renewable feedstocks, and helpful regulatory regulations.
The bioplastics market is expanding as a result of the increased use of biodegradable products and expanded applications for bioplastics across end-user industries. However, the bioplastics market expansion is somewhat constrained by high production costs and relatively low-performance standards when compared to conventional plastics.
Bioplastics Market Trends Analysis
To lessen reliance on traditional plastics, industry trends are moving toward bio-based goods. The need for bioplastics has grown as a result of these considerations. In addition, renewable resources can be used to produce bioplastics. Corn, wheat, mastic, and sugarcane are some of the common feedstocks used to make bioplastics. Nearly all geographical areas of the world have easy access to these. As a result, the global market's fluctuation in crude oil prices has no impact on the development of the bioplastics sector. The bioplastics market may expand as a result of these factors.
With customer concern over the environment growing, businesses are turning to sustainable and environmentally friendly solutions to build and strengthen their brand image. For instance, top businesses like Coca-Cola and PepsiCo concentrate on using PET, nylon, and polyethylene with bio-based materials for beverage packaging. Additionally, businesses like NEC Corporation incorporate bioplastics into a variety of their products, including LCD projectors and POS terminals. The expansion of these companies corporate social responsibility (CSR) initiatives are anticipated to boost investor interest in the bioplastic industry and fuel demand for the material. This is expected to boost the bioplastics market profitability by increasing the sales of bioplastics.
However, one of the main problems with the global bioplastics market is the high cost of the product. Currently, bioplastics are more than twice as expensive as traditional plastics made from petroleum. This is primarily caused by the expensive R&D, building a polymer plant, and raw material costs while the production scale is still small. This factor might slow the bioplastics market expansion for bioplastics.
Bioplastics Market Share Analysis
Non-biodegradable bioplastics held the largest market share in 2017. The market is expected to develop as a result of the rising demand for non-biodegradable polymers made of polyethylene terephthalate. Bottle wrapping frequently makes use of PET. The world's industry for sustainable packaging is expanding quickly, and this, together with the fluctuating price of crude oil, is boosting the market for Bio-PET.
Bio-PET is significantly lighter than traditional PET in terms of weight. Additionally, Bio-PET is anticipated to meet the growing demand for lightweight materials in the automotive industry. Additionally, it is anticipated that favorable government policies will fuel demand for Bio-PET as an eco-friendly replacement.
The bioplastics market in Europe brought in the most money in 2017. The main factors driving the growth of the bioplastics market in the region are the enactment of pro-bioplastics policies by European policymakers and the rise in the adoption of bioplastics in Germany, Italy, and the UK.
2017 saw the highest usage of bioplastics in rigid packaging, and this trend is anticipated to remain through 2024. Gloss, barrier effect, antistatic behavior, printability, and other qualities of bioplastics make them appropriate for use in rigid packaging. Bottles, cups, cans, corrugated cases, boxes, and other rigid packaging items made of bioplastic are included.
Bioplastics Market Key Segments:
By Type
By Application
By Region
|
Report Metric |
Details |
|
Report Name |
Bioplastics Market |
|
The Market size value in 2020 |
5.8 Billion USD |
|
The Revenue forecast in 2030 |
16.8 Billion USD |
|
Growth Rate |
CAGR of 11.5% from 2021 to 2030 |
|
Base year considered |
2020 |
|
Forecast period |
2021- 2031 |
|
Forecast units |
Value (USD) |
|
Segments covered |
By Product Type, Application and Region |
|
Report coverage |
Revenue & volume forecast, company share, competitive landscape, growth factors, and trends |
|
Geographic regions covered |
North America, Europe, Asia Pacific, Latin America, Middle East & Africa |
|
Companies covered |
The major companies profiled in this report include BASF SE, Biome Technologies Plc., CJ CheilJedang Corp., Corbion N.V., Danimer Scientific, Dow Inc., Eastman Chemical Company, Kuraray Co. Ltd., LG Chem, Mitsubishi Chemical Holdings, Novamont S.P.A and SKC. |
Ans. The global bioplastics market size was valued at USD 5.8 Billion in 2020 and is projected to reach USD 16.8 Billion by 2030, growing at a CAGR of 11.5% from 2021 to 2030.
Ans. Asia-Pacific would exhibit highest CAGR of 12.46% during 2022-2031.
CHAPTER 1: INTRODUCTION
1.1. Report description
1.2. Key benefits for stakeholders
1.3. Key market segments
1.4. Research methodology
1.4.1. Primary research
1.4.2. Secondary research
1.4.3. Analyst tools and models
CHAPTER 2: EXECUTIVE SUMMARY
2.1. Key finding of the study
2.2. CXO perspective
CHAPTER 3: MARKET OVERVIEW
3.1. Market definition and scope
3.2. Key findings
3.2.1. Top investment pocket
3.2.2. Top Winning Strategies
3.2.3. Top Winning Strategies, By Year, 2015-2018*
3.2.4. Top Winning Strategies, By Development, 2015-2018* (%)
3.2.5. Top Winning Strategies, By Company, 2015-2018*
3.3. Porter's five forces analysis
3.3.1. Bargaining power of suppliers
3.3.2. Bargaining power of buyer
3.3.3. Thereat of new entrants
3.3.4. Threat of substitute
3.3.5. Intensity of competitive rivalry
3.4. Market dynamics
3.4.1. Drivers
3.4.1.1. Environmentally Friendly Properties
3.4.1.2. High Consumer Acceptance
3.4.1.3. Favorable Government Policy
3.4.1.4. Renewable Raw Material Sources
3.4.2. Restraint
3.4.2.1. High Cost to End-User
3.4.2.2. Limited Performance
3.4.3. Opportunity
3.4.3.1. Decreasing Dependency on Petroleum Resource & Advancement in R&D
3.4.3.2. Growing Corporate Social Responsibility (CSR)
CHAPTER 4: BIOPLASTICS MARKET, BY TYPE
4.1. Overview
4.1.1. Market size and forecast
4.2. Biodegradable Plastic
4.2.1. Market size and forecast
4.2.2. Polylactic acid (PLA)
4.2.3. Polyhydroxyalkanoates (PHA)
4.2.4. Starch blends
4.2.5. Polyesters (PBAT & PBS)
4.2.6. Cellulose acetate
4.2.7. Key market trends, growth factors, and opportunities
4.2.8. Market size and forecast
4.2.9. Market analysis by country
4.3. Non-biodegradable Plastic
4.3.1. Market size and forecast
4.3.2. Epoxies
4.3.3. Polyurethanes
4.3.4. Polyethylene terephthalate
4.3.5. Others
4.3.6. Key market trends, growth factors, and opportunities
4.3.7. Market size and forecast
4.3.8. Market analysis by country
CHAPTER 5: BIOPLASTICS MARKET, BY APPLICATION
5.1. Overview
5.1.1. Market size and forecast
5.2. Rigid Packaging
5.2.1. Key market trends, growth factors, and opportunities
5.2.2. Market size and forecast
5.2.3. Market analysis by country
5.3. Flexible Packaging
5.3.1. Key market trends, growth factors, and opportunities
5.3.2. Market size and forecast
5.3.3. Market analysis by country
5.4. Textile
5.4.1. Key market trends, growth factors, and opportunities
5.4.2. Market size and forecast
5.4.3. Market analysis by country
5.5. Agriculture and Horticulture
5.5.1. Key market trends, growth factors, and opportunities
5.5.2. Market size and forecast
5.5.3. Market analysis by country
5.6. Consumer Goods
5.6.1. Key market trends, growth factors, and opportunities
5.6.2. Market size and forecast
5.6.3. Market analysis by country
5.7. Automotive
5.7.1. Key market trends, growth factors, and opportunities
5.7.2. Market size and forecast
5.7.3. Market analysis by country
5.8. Electronics
5.8.1. Key market trends, growth factors, and opportunities
5.8.2. Market size and forecast
5.8.3. Market analysis by country
5.9. Building and Construction
5.9.1. Key market trends, growth factors, and opportunities
5.9.2. Market size and forecast
5.9.3. Market analysis by country
5.10. Others
5.10.1. Key market trends, growth factors, and opportunities
5.10.2. Market size and forecast
5.10.3. Market analysis by country
CHAPTER 6: BIOPLASTICS MARKET, BY GEOGRAPHY
6.1. Overview
6.1.1. Market size and forecast
6.2. North America
6.2.1. Key market trends, growth factors, and opportunities
6.2.2. Market size and forecast, by Type
6.2.3. Market size and forecast, by Application
6.2.4. Market size and forecast, by country
6.2.5. U.S.
6.2.5.1. Market size and forecast, by Type
6.2.5.2. Market size and forecast, by Application
6.2.6. Canada
6.2.6.1. Market size and forecast, by Type
6.2.6.2. Market size and forecast, by Application
6.2.7. Mexico
6.2.7.1. Market size and forecast, by Type
6.2.7.2. Market size and forecast, by Application
6.3. Europe
6.3.1. Key market trends, growth factors, and opportunities
6.3.2. Market size and forecast, by Type
6.3.3. Market size and forecast, by Application
6.3.4. Market size and forecast, by country
6.3.5. UK
6.3.5.1. Market size and forecast, by Type
6.3.5.2. Market size and forecast, by Application
6.3.6. Germany
6.3.6.1. Market size and forecast, by Type
6.3.6.2. Market size and forecast, by Application
6.3.7. France
6.3.7.1. Market size and forecast, by Type
6.3.7.2. Market size and forecast, by Application
6.3.8. Italy
6.3.8.1. Market size and forecast, by Type
6.3.8.2. Market size and forecast, by Application
6.3.9. Spain
6.3.9.1. Market size and forecast, by Type
6.3.9.2. Market size and forecast, by Application
6.3.10. Rest of Europe
6.3.10.1. Market size and forecast, by Type
6.3.10.2. Market size and forecast, by Application
6.4. Asia-Pacific
6.4.1. Key market trends, growth factors, and opportunities
6.4.2. Market size and forecast, by Type
6.4.3. Market size and forecast, by Application
6.4.4. Market size and forecast, by country
6.4.5. China
6.4.5.1. Market size and forecast, by Type
6.4.5.2. Market size and forecast, by Application
6.4.6. India
6.4.6.1. Market size and forecast, by Type
6.4.6.2. Market size and forecast, by Application
6.4.7. Japan
6.4.7.1. Market size and forecast, by Type
6.4.7.2. Market size and forecast, by Application
6.4.8. South Korea
6.4.8.1. Market size and forecast, by Type
6.4.8.2. Market size and forecast, by Application
6.4.9. Rest of Asia-Pacific
6.4.9.1. Market size and forecast, by Type
6.4.9.2. Market size and forecast, by Application
6.5. LAMEA
6.5.1. Key market trends, growth factors, and opportunities
6.5.2. Market size and forecast, by Type
6.5.3. Market size and forecast, by Application
6.5.4. Market size and forecast, by country
6.5.5. Brazil
6.5.5.1. Market size and forecast, by Type
6.5.5.2. Market size and forecast, by Application
6.5.6. Argentina
6.5.6.1. Market size and forecast, by Type
6.5.6.2. Market size and forecast, by Application
6.5.7. South Africa
6.5.7.1. Market size and forecast, by Type
6.5.7.2. Market size and forecast, by Application
6.5.8. Saudi Arabia
6.5.8.1. Market size and forecast, by Type
6.5.8.2. Market size and forecast, by Application
6.5.9. UAE
6.5.9.1. Market size and forecast, by Type
6.5.9.2. Market size and forecast, by Application
6.5.10. Rest of LAMEA
6.5.10.1. Market size and forecast, by Type
6.5.10.2. Market size and forecast, by Application
CHAPTER 7: COMPANY PROFILES
7.1. BASF SE
7.1.1. Company overview
7.1.2. Company snapshot
7.1.3. Operating business segments
7.1.4. Business performance
7.1.5. Key strategic moves and developments
7.2. Biome Technologies Plc.
7.2.1. Company overview
7.2.2. Company snapshot
7.2.3. Operating business segments
7.2.4. Business performance
7.2.5. Key strategic moves and developments
7.3. Braskem S.A.
7.3.1. Company overview
7.3.2. Company snapshot
7.3.3. Operating business segments
7.3.4. Business performance
7.3.5. Key strategic moves and developments
7.4. Corbion Purac
7.4.1. Company overview
7.4.2. Company snapshot
7.4.3. Operating business segments
7.4.4. Business performance
7.4.5. Key strategic moves and developments
7.5. FKuR Kunststoff GmbH
7.5.1. Company overview
7.5.2. Company snapshot
7.5.3. Product portfolio
7.5.4. Key strategic moves and developments
7.6. Indorama Ventures Public Company Limited.
7.6.1. Company overview
7.6.2. Company snapshot
7.6.3. Operating business segments
7.6.4. Business performance
7.6.5. Key strategic moves and developments
7.7. Innovia Films
7.7.1. Company overview
7.7.2. Company snapshot
7.7.3. Product portfolio
7.7.4. Key strategic moves and developments
7.8. Natureworks LLC.
7.8.1. Company overview
7.8.2. Company snapshot
7.8.3. Product portfolio
7.8.4. Key strategic moves and developments
7.9. Novamont S.p.A
7.9.1. Company overview
7.9.2. Company snapshot
7.9.3. Operating business segments
7.9.4. Business performance
7.9.5. Key strategic moves and developments
7.10. SECOS Group Ltd. (Cardia Bioplastics)
7.10.1. Company overview
7.10.2. Company snapshot
7.10.3. Operating business segments
7.10.4. Business performance
7.10.5. Key strategic moves and developments
List Of Tables
Table 01. Global Bioplastics Market Value, By Type, 2017-2024 ($million)
Table 02. Global Bioplastics Market Volume, By Type, 2017-2024 (Kilotons)
Table 03. Global Biodegradable Bioplastics Market Value, By Type, 2017-2024 ($million)
Table 04. Global Biodegradable Bioplastics Market Volume, By Type, 2017-2024 (Kilotons)
Table 05. Bioplastics Market Value For Luxury Vinyl Tiles, By Region, 2017-2024 ($million)
Table 06. Global Non-biodegradable Bioplastics Market Value, By Type, 2017-2024 ($million)
Table 07. Global Non-biodegradable Bioplastics Market Volume, By Type, 2017-2024 (Kilotons)
Table 08. Bioplastics Market Value For Vinyl Sheets & Vinyl Composite Tiles, By Region, 2017-2024 ($million)
Table 09. Global Bioplastics Market Value, By Application, 2017-2024 ($million)
Table 10. Global Bioplastics Market Volume, By Application, 2017-2024 (Kilotons)
Table 11. Bioplastics Market Value For Rigid Packaging, By Region, 2017-2024 ($million)
Table 12. Bioplastics Market Value For Flexible Packaging, By Region, 2017-2024 ($million)
Table 13. Bioplastics Market Value For Textile, By Region, 2017-2024 ($million)
Table 14. Bioplastics Market Value For Agriculture And Horticulture, By Region, 2017-2024 ($million)
Table 15. Bioplastics Market Value For Consumer Goods, By Region, 2017-2024 ($million)
Table 16. Bioplastics Market Value For Automotive, By Region, 2017-2024 ($million)
Table 17. Bioplastics Market Value For Electronics, By Region, 2017-2024 ($million)
Table 18. Bioplastics Market Value For Building And Construction, By Region, 2017-2024 ($million)
Table 19. Bioplastics Market Value For Others, By Region, 2017-2024 ($million)
Table 20. Bioplastics Market Value, By Region, 2017-2024 ($million)
Table 21. Bioplastics Market Volume, By Region, 2017-2024 (Kilotons)
Table 22. North America Bioplastics Market Value, By Type, 2017-2024 ($million)
Table 23. North America Bioplastics Market Value, By Application, 2017-2024 ($million)
Table 24. North America Bioplastics Market Value, By Country, 2017-2024 ($million)
Table 25. North America Bioplastics Market Volume, By Country, 2017-2024 (Kilotons)
Table 26. U.s. Bioplastics Market Value, By Type, 2017-2024 ($million)
Table 27. U.s. Bioplastics Market Volume, By Type, 2017-2024 (Kilotons)
Table 28. U.s. Bioplastics Market Value, By Application, 2017-2024 ($million)
Table 29. U.s. Bioplastics Market Volume, By Application, 2017-2024 (Kilotons)
Table 30. Canada Bioplastics Market Value, By Type, 2017-2024 ($million)
Table 31. Canada Bioplastics Market Volume, By Type, 2017-2024 (Kilotons)
Table 32. Canada Bioplastics Market Value, By Application, 2017-2024 ($million)
Table 33. Canada Bioplastics Market Volume, By Application, 2017-2024 (Kilotons)
Table 34. Mexico Bioplastics Market Value, By Type, 2017-2024 ($million)
Table 35. Mexico Bioplastics Market Volume, By Type, 2017-2024 (Kilotons)
Table 36. Mexico Bioplastics Market Value, By Application, 2017-2024 ($million)
Table 37. Mexico Bioplastics Market Volume, By Application, 2017-2024 (Kilotons)
Table 38. Europe Bioplastics Market Value, By Type, 2017-2024 ($million)
Table 39. Europe Bioplastics Market Value, By Application, 2017-2024 ($million)
Table 40. Europe Bioplastics Market Value, By Country, 2017-2024 ($million)
Table 41. Europe Bioplastics Market Volume, By Country, 2017-2024 (Kilotons)
Table 42. Uk Bioplastics Market Value, By Type, 2017-2024 ($million)
Table 43. Uk Bioplastics Market Volume, By Type, 2017-2024 (Kilotons)
Table 44. Uk Bioplastics Market Value, By Application, 2017-2024 ($million)
Table 45. Uk Bioplastics Market Volume, By Application, 2017-2024 (Kilotons)
Table 46. Germany Bioplastics Market Value, By Type, 2017-2024 ($million)
Table 47. Germany Bioplastics Market Volume, By Type, 2017-2024 (Kilotons)
Table 48. Germany Bioplastics Market Value, By Application, 2017-2024 ($million)
Table 49. Germany Bioplastics Market Volume, By Application, 2017-2024 (Kilotons)
Table 50. France Bioplastics Market Value, By Type, 2017-2024 ($million)
Table 51. France Bioplastics Market Volume, By Type, 2017-2024 (Kilotons)
Table 52. France Bioplastics Market Value, By Application, 2017-2024 ($million)
Table 53. France Bioplastics Market Volume, By Application, 2017-2024 (Kilotons)
Table 54. Italy Bioplastics Market Value, By Type, 2017-2024 ($million)
Table 55. Italy Bioplastics Market Volume, By Type, 2017-2024 (Kilotons)
Table 56. Italy Bioplastics Market Value, By Application, 2017-2024 ($million)
Table 57. Italy Bioplastics Market Volume, By Application, 2017-2024 (Kilotons)
Table 58. Spain Bioplastics Market Value, By Type, 2017-2024 ($million)
Table 59. Spain Bioplastics Market Volume, By Type, 2017-2024 (Kilotons)
Table 60. Spain Bioplastics Market Value, By Application, 2017-2024 ($million)
Table 61. Spain Bioplastics Market Volume, By Application, 2017-2024 (Kilotons)
Table 62. Rest Of Europe Bioplastics Market Value, By Type, 2017-2024 ($million)
Table 63. Rest Of Europe Bioplastics Market Volume, By Type, 2017-2024 (Kilotons)
Table 64. Rest Of Europe Bioplastics Market Value, By Application, 2017-2024 ($million)
Table 65. Rest Of Europe Bioplastics Market Volume, By Application, 2017-2024 (Kilotons)
Table 66. Asia-pacific Bioplastics Market Value, By Type, 2017-2024 ($million)
Table 67. Asia-pacific Bioplastics Market Value, By Application, 2017-2024 ($million)
Table 68. Asia-pacific Bioplastics Market Value, By Country, 2017-2024 ($million)
Table 69. Asia-pacific Bioplastics Market Volume, By Country, 2017-2024 (Kilotons)
Table 70. China Bioplastics Market Value, By Type, 2017-2024 ($million)
Table 71. China Bioplastics Market Volume, By Type, 2017-2024 (Kilotons)
Table 72. China Bioplastics Market Value, By Application, 2017-2024 ($million)
Table 73. China Bioplastics Market Volume, By Application, 2017-2024 (Kilotons)
Table 74. India Bioplastics Market Value, By Type, 2017-2024 ($million)
Table 75. India Bioplastics Market Volume, By Type, 2017-2024 (Kilotons)
Table 76. India Bioplastics Market Value, By Application, 2017-2024 ($million)
Table 77. India Bioplastics Market Volume, By Application, 2017-2024 (Kilotons)
Table 78. Japan Bioplastics Market Value, By Type, 2017-2024 ($million)
Table 79. Japan Bioplastics Market Volume, By Type, 2017-2024 (Kilotons)
Table 80. Japan Bioplastics Market Value, By Application, 2017-2024 ($million)
Table 81. Japan Bioplastics Market Volume, By Application, 2017-2024 (Kilotons)
Table 82. South Korea Bioplastics Market Value, By Type, 2017-2024 ($million)
Table 83. South Korea Bioplastics Market Volume, By Type, 2017-2024 (Kilotons)
Table 84. South Korea Bioplastics Market Value, By Application, 2017-2024 ($million)
Table 85. South Korea Bioplastics Market Volume, By Application, 2017-2024 (Kilotons)
Table 86. Rest Of Asia-pacific Bioplastics Market Value, By Type, 2017-2024 ($million)
Table 87. Rest Of Asia-pacific Bioplastics Market Volume, By Type, 2017-2024 (Kilotons)
Table 88. Rest Of Asia-pacific Bioplastics Market Value, By Application, 2017-2024 ($million)
Table 89. Rest Of Asia-pacific Bioplastics Market Volume, By Application, 2017-2024 (Kilotons)
Table 90. Lamea Bioplastics Market Value, By Type, 2017-2024 ($million)
Table 91. Lamea Bioplastics Market Value, By Application, 2017-2024 ($million)
Table 92. Lamea Bioplastics Market Value, By Country, 2017-2024 ($million)
Table 93. Lamea Bioplastics Market Volume, By Country, 2017-2024 (Kilotons)
Table 94. Brazil Bioplastics Market Value, By Type, 2017-2024 ($million)
Table 95. Brazil Bioplastics Market Volume, By Type, 2017-2024 (Kilotons)
Table 96. Brazil Bioplastics Market Value, By Application, 2017-2024 ($million)
Table 97. Brazil Bioplastics Market Volume, By Application, 2017-2024 (Kilotons)
Table 98. Argentina Bioplastics Market Value, By Type, 2017-2024 ($million)
Table 99. Saudi Argentina Bioplastics Market Volume, By Type, 2017-2024 (Kilotons)
Table 100. Argentina Bioplastics Market Value, By Application, 2017-2024 ($million)
Table 101. Argentina Bioplastics Market Volume, By Application, 2017-2024 (Kilotons)
Table 102. South Africa Bioplastics Market Value, By Type, 2017-2024 ($million)
Table 103. South Africa Bioplastics Market Volume, By Type, 2017-2024 (Kilotons)
Table 104. South Africa Bioplastics Market Value, By Application, 2017-2024 ($million)
Table 105. South Africa Bioplastics Market Volume, By Application, 2017-2024 (Kilotons)
Table 106. Saudi Arabia Bioplastics Market Value, By Type, 2017-2024 ($million)
Table 107. Saudi Arabia Bioplastics Market Volume, By Type, 2017-2024 (Kilotons)
Table 108. Saudi Arabia Bioplastics Market Value, By Application, 2017-2024 ($million)
Table 109. Saudi Arabia Bioplastics Market Volume, By Application, 2017-2024 (Kilotons)
Table 110. Uae Bioplastics Market Value, By Type, 2017-2024 ($million)
Table 111. Uae Bioplastics Market Volume, By Type, 2017-2024 (Kilotons)
Table 112. Uae Bioplastics Market Value, By Application, 2017-2024 ($million)
Table 113. Uae Bioplastics Market Volume, By Application, 2017-2024 (Kilotons)
Table 114. Rest Of Lamea Bioplastics Market Value, By Type, 2017-2024 ($million)
Table 115. Rest Of Lamea Bioplastics Market Volume, By Type, 2017-2024 (Kilotons)
Table 116. Rest Of Lamea Bioplastics Market Value, By Application, 2017-2024 ($million)
Table 117. Rest Of Lamea Bioplastics Market Volume, By Application, 2017-2024 (Kilotons)
Table 118. Basf: Company Snapshot
Table 119. Basf: Operating Segments
Table 120. Biome: Company Snapshot
Table 121. Biome: Operating Segments
Table 122. Braskem: Company Snapshot
Table 123. Braskem: Operating Segments
Table 124. Corbion Purac.: Company Snapshot
Table 125. Corbion Purac.: Operating Segments
Table 126. Fkur Kunststoff Gmbh: Company Snapshot
Table 127. Fkur Kunststoff Gmbh: Product Portfolio
Table 128. Indorama Ventures: Company Snapshot
Table 129. Indorama Ventures.: Operating Segments
Table 130. Innovia Films: Company Snapshot
Table 131. Innovia Films: Product Portfolio
Table 132. Natureworks: Company Snapshot
Table 133. Natureworks.: Product Portfolio
Table 134. Novamont: Company Snapshot
Table 135. Novamont: Operating Segments
Table 136. Secos: Company Snapshot
Table 137. Secos: Operating Segments
List Of Figures
Figure 01. Key Market Segments
Figure 02. Top Investment Pocket, 2017
Figure 03. Low Bargaining Power Of Suppliers
Figure 04. Moderate Bargaining Power Of Buyer
Figure 05. Low Threat Of New Entrant
Figure 06. High Threat Of Substitute
Figure 07. Low Intensity Of Competitive Rivalry
Figure 08. Global Bioplastics Market Share, By Type, 2017-2024 (%)
Figure 09. Comparative Share Analysis Of Biodegradable Based Bioplastics Market Value, By Country, 2017 & 2024 (%)
Figure 10. Comparative Share Analysis Of Biodegradable Based Bioplastics Market Volume, By Country, 2017 & 2024 (%)
Figure 11. Comparative Share Analysis Of Non-biodegradable Based Bioplastics Market Value, By Country, 2017 & 2024 (%)
Figure 12. Comparative Share Analysis Of Non-biodegradable Based Bioplastics Market Volume, By Country, 2017 & 2024 (%)
Figure 13. Global Bioplastics Market Share, By Application, 2017-2024 (%)
Figure 14. Comparative Share Analysis Of Bioplastics Market Value For Rigid Packaging, By Country, 2017 & 2024 (%)
Figure 15. Comparative Share Analysis Of Bioplastics Market Volume For Rigid Packaging, By Country, 2017 & 2024 (%)
Figure 16. Comparative Share Analysis Of Bioplastics Market Value For Flexible Packaging, By Country, 2017 & 2024 (%)
Figure 17. Comparative Share Analysis Of Bioplastics Market Volume For Flexible Packaging, By Country, 2017 & 2024 (%)
Figure 18. Comparative Share Analysis Bioplastics Market Value For Textile, By Country, 2017 & 2024 (%)
Figure 19. Comparative Share Analysis Bioplastics Market Volume For Textile, By Country, 2017 & 2024 (%)
Figure 20. Comparative Share Analysis Of Bioplastics Market Value For Agriculture And Horticulture, By Country, 2017 & 2024 (%)
Figure 21. Comparative Share Analysis Of Bioplastics Market Volume For Agriculture And Horticulture, By Country, 2017 & 2024 (%)
Figure 22. Comparative Share Analysis Of Bioplastics Market Value For Consumer Goods, By Country, 2017 & 2024 (%)
Figure 23. Comparative Share Analysis Of Bioplastics Market Volume For Consumer Goods, By Country, 2017 & 2024 (%)
Figure 24. Comparative Share Analysis Of Bioplastics Market Value For Automotive, By Country, 2017 & 2024 (%)
Figure 25. Comparative Share Analysis Of Bioplastics Market For Automotive, By Country, 2017 & 2024 (%)
Figure 26. Comparative Share Analysis Bioplastics Market Value For Electronics, By Country, 2017 & 2024 (%)
Figure 27. Comparative Share Analysis Bioplastics Market Volume For Electronics, By Country, 2017 & 2024 (%)
Figure 28. Comparative Share Analysis Of Bioplastics Market Value For Building And Construction, By Country, 2017 & 2024 (%)
Figure 29. Comparative Share Analysis Of Bioplastics Market Volume For Building And Construction, By Country, 2017 & 2024 (%)
Figure 30. Comparative Share Analysis Of Bioplastics Market Value For Others, By Country, 2017 & 2024 (%)
Figure 31. Comparative Share Analysis Of Bioplastics Market Volume For Others, By Country, 2017 & 2024 (%)
Figure 32. Bioplastics Market Share, By Region, 2017-2024 (%)
Figure 33. U.s. Bioplastics Market, 2017-2024 ($million)
Figure 34. Canada Bioplastics Market, 2017-2024 ($million)
Figure 35. Mexico Bioplastics Market, 2017-2024 ($million)
Figure 36. Uk Bioplastics Market, 2017-2024 ($million)
Figure 37. Germany Bioplastics Market, 2017-2024 ($million)
Figure 38. France Bioplastics Market, 2017-2024 ($million)
Figure 39. Italy Bioplastics Market, 2017-2024 ($million)
Figure 40. Spain Bioplastics Market, 2017-2024 ($million)
Figure 41. Rest Of Europe Bioplastics Market, 2017-2024 ($million)
Figure 42. China Bioplastics Market, 2017-2024 ($million)
Figure 43. India Bioplastics Market, 2017-2024 ($million)
Figure 44. Japan Bioplastics Market, 2017-2024 ($million)
Figure 45. South Korea Bioplastics Market, 2017-2024 ($million)
Figure 46. Rest Of Asia-pacific Bioplastics Market, 2017-2024 ($million)
Figure 47. Brazil Bioplastics Market, 2017-2024 ($million)
Figure 48. Argentina Bioplastics Market, 2017-2024 ($million)
Figure 49. South Africa Bioplastics Market, 2017-2024 ($million)
Figure 50. Saudi Arabia Bioplastics Market, 2017-2024 ($million)
Figure 51. Uae Bioplastics Market, 2017-2024 ($million)
Figure 52. Rest Of Lamea Bioplastics Market, 2017-2024 ($million)
Figure 53. Basf: Net Sales, 2015-2017 ($million)
Figure 54. Basf: Revenue Share By Segment, 2017 (%)
Figure 55. Basf: Revenue Share By Geography, 2017 (%)
Figure 56. Biome: Net Sales, 2015-2017 ($million)
Figure 57. Biome: Revenue Share By Segments, 2017 (%)
Figure 58. Biome: Revenue Share By Country, 2017 (%)
Figure 59. Braskem: Net Sales, 2015-2017 ($million)
Figure 60. Braskem: Revenue Share By Segments, 2017 (%)
Figure 61. Corbion Purac.: Net Sales, 2015-2017 ($million)
Figure 62. Corbion Purac.: Revenue Share By Segment, 2017 (%)
Figure 63. Corbion Purac.: Revenue Share By Geography, 2016 (%)
Figure 64. Indorama Ventures: Net Sales, 2015-2017 ($million)
Figure 65. Indorama Ventures: Revenue Share By Segment, 2017 (%)
Figure 66. Indorama Ventures: Revenue Share By Geography, 2017 (%)
Figure 67. Novamont: Net Sales, 2014-2015 ($million)
Figure 68. Secos: Net Sales, 2015-2017 ($million)
Figure 69. Secos: Revenue Share By Segments, 2017 (%)
$5769
$9995
HAVE A QUERY?
OUR CUSTOMER
