
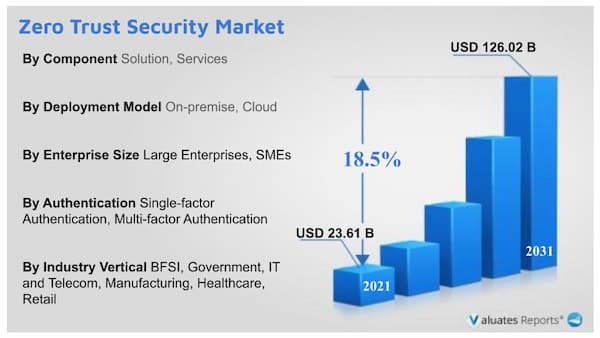
The global zero trust security market was valued at $23.61 billion in 2021 and is projected to reach $126.02 billion by 2031, growing at a CAGR of 18.5% from 2022 to 2031. Key drivers of the zero trust security market include a rise in the number of data breaches targeting business applications.
The growing malware and phishing threats will propel the growth of the zero trust security market during the forecast period.
The increasing adoption of cloud-based zero-trust security solutions will boost the growth of the market in the upcoming years.
Cyberthreats
Firms around the globe are deploying digital solutions in order to overcome the economic uncertainties of the covid 19 pandemic. They are utilizing applications to offer services to their clients. At the same time, hackers are bypassing the application security to stole crucial client information. Ransomware attacks and cyberthreats have grown drastically. The work-from-home mandates have opened the door for savvy cybercriminals as employees are using their personal computers for office work. The poorly secured home networks increase the exposure of work data. The total number of stolen records has increased dramatically. This will foster the growth of the zero trust security market during the forecast period. The proliferation of internet-connected devices and apps have made single entry point protection insufficient. Attackers have become sophisticated as they are stealing information from various end-point communication networks. Be the sensitive GPS information from cell phones, images from social media, or buying details from credit cards each and every piece of information is exposed to attackers nowadays. Information-rich mobile applications have increased the risk of threat actors.
Malware and phishing activities
Malware, Trojan horses, and phishing activities have the enhanced ability to penetrate, control, and corrupt entire electronic information networks and databases. This is done to seize control of the machines and devices for carrying out duplicate transactions by themselves. The BSI, healthcare, and government industry are particularly vulnerable as they generate huge amounts of data every single day. This will drive the demand for the zero trust security market during the forecast period. Hackers can use it to steal passwords, delete files or render the entire computer system useless. Small and large businesses have to deal with information theft which is a costly affair. Hackers can gain company or personal information that will be then sold to third-party sources which lead to a lack of privacy. Browsing history, client profiles, and important passwords can be stolen easily. It spreads throughout the network damaging the entire organizational assets. Many of the files can become difficult to retrieve or gain access to once it has fallen into the wrong hands.
Cloud-based zero security solutions
Enterprises are increasingly deploying cloud-based zero security solutions which include access control, user security, threat prevention, detection, and mitigation. It also involves regulatory compliance and data center security. This will bolster the growth of the zero trust security market during the forecast period. It provides data encryption, masking, dynamic threat intelligence, and strong identity management and access controls. Cloud solutions provide 24*7 monitoring thereby improving the overall visibility of the entire assets. They have distributed global networks that accelerate performance and efficiently handle unusual traffic surges. The built-in dynamic intelligence reporting eliminates DDoS attacks. Moreover, they have strong security protocols to prevent illegal access to confidential information. Cloud security offers the flexibility of pay as you go model which ensures that the users pats as much as they consume. All these things allow application security providers to maintain regulatory standards.
Based on components, the solutions segment will be the most dominating segment in the zero trust security market share as they provide all-around protection related to risk management, compliance, security operations, identity, access management, etc. However, the services segment will be the fastest growing due to rising adoption by small scale businesses and increasing security threats.
Based on authentication, the single-factor authentication segment will provide lucrative opportunities for growth in the zero rust security market due to the ease of use and need for having only one verifying protocol. While the multifactor authentication segment will grow the fastest due to the rising need for multiple verification protocols.
Based on the industry vertical, the BFSI segment will witness considerable growth due to the rising need for tight security and digital privacy for efficient financial management. Zero trust security solutions are very helpful for financial institutions to improve their overall security and regulatory needs.
Based on enterprise size, the large enterprise segment will be the most lucrative whereas the small enterprise segment will be the fastest growing segment during the forecast period due to the need for reducing operational costs and removing business complexity.
Based on deployment. The on-premise segment will maintain dominance due to the tendency of organizations to keep their vital information in-house. However thecloud segment will grow the facets due to ease of use, and cost-effectiveness.
Based on region, North America is expected to dominate due to technological advancements, the presence of key players, rising investments in zero-security solutions, and well-established security infrastructure. The increasing use of mobile and web-based applications will also contribute to its growth. While Asia-Pacific will be the fastest growing due to growing vulnerability to cyberattacks and increasing awareness levels.
Zero Trust Security Market Scope
|
Report Metric |
Details |
|
Report Name |
Zero Trust Security Market |
|
The Market size value in 2021 |
23.61 Billion USD |
|
The Revenue forecast in 2031 |
126.02 Billion USD |
|
Growth Rate |
CAGR of 18.5% from 2021 to 2031 |
|
Base year considered |
2021 |
|
Forecast period |
2021- 2031 |
|
Forecast units |
Value (USD) |
|
Segments covered |
By Application, By Age Group, By Size, By End User, By Distribution Channel, By Product Type |
|
Report coverage |
Revenue & volume forecast, company share, competitive landscape, growth factors, and trends |
|
Geographic regions covered |
North America, Europe, Asia Pacific, Latin America, Middle East & Africa |
|
Companies covered |
Kampa, exxel outdoors, Bushtec Safari, Sawday’s Canopy and Stars Ltd., Huttopia, Wigwam Holidays Ltd, ArenaCampsites, Others. |
Ans. The global zero trust security market was valued at $23.61 billion in 2021 and is projected to reach $126.02 billion by 2031.
Ans. The global zero trust security market is expected to grow at a compound annual growth rate of 18.5% from 2021 to 2031.
Ans. The key players are Cloudflare, Google, Cyxtera Technologies, SonicWall, Palo Alto Networks, Check Point Software Technologies, Trend Micro, Inc., Symantec Corp., FireEye, Inc., McAfee Corp.
CHAPTER 1:INTRODUCTION
1.1.Report description
1.2.Key market segments
1.3.Key benefits to the stakeholders
1.4.Research Methodology
1.4.1.Secondary research
1.4.2.Primary research
1.4.3.Analyst tools and models
CHAPTER 2:EXECUTIVE SUMMARY
2.1.Key findings of the study
2.2.CXO Perspective
CHAPTER 3:MARKET OVERVIEW
3.1.Market definition and scope
3.2.Key findings
3.2.1.Top investment pockets
3.3.Porter’s five forces analysis
3.4.Top player positioning
3.5.Market dynamics
3.5.1.Drivers
3.5.2.Restraints
3.5.3.Opportunities
3.6.COVID-19 Impact Analysis on the market
3.7.Key Regulation Analysis
3.8.Patent Landscape
CHAPTER 4: ZERO TRUST SECURITY MARKET, BY COMPONENT
4.1 Overview
4.1.1 Market size and forecast
4.2 Solution
4.2.1 Key market trends, growth factors and opportunities
4.2.2 Market size and forecast, by region
4.2.3 Market analysis by country
4.3 Services
4.3.1 Key market trends, growth factors and opportunities
4.3.2 Market size and forecast, by region
4.3.3 Market analysis by country
CHAPTER 5: ZERO TRUST SECURITY MARKET, BY DEPLOYMENT MODEL
5.1 Overview
5.1.1 Market size and forecast
5.2 On-premise
5.2.1 Key market trends, growth factors and opportunities
5.2.2 Market size and forecast, by region
5.2.3 Market analysis by country
5.3 Cloud
5.3.1 Key market trends, growth factors and opportunities
5.3.2 Market size and forecast, by region
5.3.3 Market analysis by country
CHAPTER 6: ZERO TRUST SECURITY MARKET, BY ENTERPRISE SIZE
6.1 Overview
6.1.1 Market size and forecast
6.2 Large Enterprises
6.2.1 Key market trends, growth factors and opportunities
6.2.2 Market size and forecast, by region
6.2.3 Market analysis by country
6.3 SMEs
6.3.1 Key market trends, growth factors and opportunities
6.3.2 Market size and forecast, by region
6.3.3 Market analysis by country
CHAPTER 7: ZERO TRUST SECURITY MARKET, BY AUTHENTICATION
7.1 Overview
7.1.1 Market size and forecast
7.2 Single-factor Authentication
7.2.1 Key market trends, growth factors and opportunities
7.2.2 Market size and forecast, by region
7.2.3 Market analysis by country
7.3 Multi-factor Authentication
7.3.1 Key market trends, growth factors and opportunities
7.3.2 Market size and forecast, by region
7.3.3 Market analysis by country
CHAPTER 8: ZERO TRUST SECURITY MARKET, BY INDUSTRY VERTICAL
8.1 Overview
8.1.1 Market size and forecast
8.2 BFSI
8.2.1 Key market trends, growth factors and opportunities
8.2.2 Market size and forecast, by region
8.2.3 Market analysis by country
8.3 Government
8.3.1 Key market trends, growth factors and opportunities
8.3.2 Market size and forecast, by region
8.3.3 Market analysis by country
8.4 IT and Telecom
8.4.1 Key market trends, growth factors and opportunities
8.4.2 Market size and forecast, by region
8.4.3 Market analysis by country
8.5 Manufacturing
8.5.1 Key market trends, growth factors and opportunities
8.5.2 Market size and forecast, by region
8.5.3 Market analysis by country
8.6 Healthcare
8.6.1 Key market trends, growth factors and opportunities
8.6.2 Market size and forecast, by region
8.6.3 Market analysis by country
8.7 Retail
8.7.1 Key market trends, growth factors and opportunities
8.7.2 Market size and forecast, by region
8.7.3 Market analysis by country
8.8 Energy and Utilities
8.8.1 Key market trends, growth factors and opportunities
8.8.2 Market size and forecast, by region
8.8.3 Market analysis by country
8.9 Others
8.9.1 Key market trends, growth factors and opportunities
8.9.2 Market size and forecast, by region
8.9.3 Market analysis by country
CHAPTER 9: ZERO TRUST SECURITY MARKET, BY REGION
9.1 Overview
9.1.1 Market size and forecast
9.2 North America
9.2.1 Key trends and opportunities
9.2.2 North America Market size and forecast, by Component
9.2.3 North America Market size and forecast, by Deployment Model
9.2.4 North America Market size and forecast, by Enterprise Size
9.2.5 North America Market size and forecast, by Authentication
9.2.6 North America Market size and forecast, by Industry Vertical
9.2.7 North America Market size and forecast, by country
9.2.7.1 U.S.
9.2.7.1.1 Market size and forecast, by Component
9.2.7.1.2 Market size and forecast, by Deployment Model
9.2.7.1.3 Market size and forecast, by Enterprise Size
9.2.7.1.4 Market size and forecast, by Authentication
9.2.7.1.5 Market size and forecast, by Industry Vertical
9.2.7.2 Canada
9.2.7.2.1 Market size and forecast, by Component
9.2.7.2.2 Market size and forecast, by Deployment Model
9.2.7.2.3 Market size and forecast, by Enterprise Size
9.2.7.2.4 Market size and forecast, by Authentication
9.2.7.2.5 Market size and forecast, by Industry Vertical
9.3 Europe
9.3.1 Key trends and opportunities
9.3.2 Europe Market size and forecast, by Component
9.3.3 Europe Market size and forecast, by Deployment Model
9.3.4 Europe Market size and forecast, by Enterprise Size
9.3.5 Europe Market size and forecast, by Authentication
9.3.6 Europe Market size and forecast, by Industry Vertical
9.3.7 Europe Market size and forecast, by country
9.3.7.1 U.K.
9.3.7.1.1 Market size and forecast, by Component
9.3.7.1.2 Market size and forecast, by Deployment Model
9.3.7.1.3 Market size and forecast, by Enterprise Size
9.3.7.1.4 Market size and forecast, by Authentication
9.3.7.1.5 Market size and forecast, by Industry Vertical
9.3.7.2 Germany
9.3.7.2.1 Market size and forecast, by Component
9.3.7.2.2 Market size and forecast, by Deployment Model
9.3.7.2.3 Market size and forecast, by Enterprise Size
9.3.7.2.4 Market size and forecast, by Authentication
9.3.7.2.5 Market size and forecast, by Industry Vertical
9.3.7.3 France
9.3.7.3.1 Market size and forecast, by Component
9.3.7.3.2 Market size and forecast, by Deployment Model
9.3.7.3.3 Market size and forecast, by Enterprise Size
9.3.7.3.4 Market size and forecast, by Authentication
9.3.7.3.5 Market size and forecast, by Industry Vertical
9.3.7.4 Spain
9.3.7.4.1 Market size and forecast, by Component
9.3.7.4.2 Market size and forecast, by Deployment Model
9.3.7.4.3 Market size and forecast, by Enterprise Size
9.3.7.4.4 Market size and forecast, by Authentication
9.3.7.4.5 Market size and forecast, by Industry Vertical
9.3.7.5 Netherlands
9.3.7.5.1 Market size and forecast, by Component
9.3.7.5.2 Market size and forecast, by Deployment Model
9.3.7.5.3 Market size and forecast, by Enterprise Size
9.3.7.5.4 Market size and forecast, by Authentication
9.3.7.5.5 Market size and forecast, by Industry Vertical
9.3.7.6 Rest of Europe
9.3.7.6.1 Market size and forecast, by Component
9.3.7.6.2 Market size and forecast, by Deployment Model
9.3.7.6.3 Market size and forecast, by Enterprise Size
9.3.7.6.4 Market size and forecast, by Authentication
9.3.7.6.5 Market size and forecast, by Industry Vertical
9.4 Asia-Pacific
9.4.1 Key trends and opportunities
9.4.2 Asia-Pacific Market size and forecast, by Component
9.4.3 Asia-Pacific Market size and forecast, by Deployment Model
9.4.4 Asia-Pacific Market size and forecast, by Enterprise Size
9.4.5 Asia-Pacific Market size and forecast, by Authentication
9.4.6 Asia-Pacific Market size and forecast, by Industry Vertical
9.4.7 Asia-Pacific Market size and forecast, by country
9.4.7.1 China
9.4.7.1.1 Market size and forecast, by Component
9.4.7.1.2 Market size and forecast, by Deployment Model
9.4.7.1.3 Market size and forecast, by Enterprise Size
9.4.7.1.4 Market size and forecast, by Authentication
9.4.7.1.5 Market size and forecast, by Industry Vertical
9.4.7.2 India
9.4.7.2.1 Market size and forecast, by Component
9.4.7.2.2 Market size and forecast, by Deployment Model
9.4.7.2.3 Market size and forecast, by Enterprise Size
9.4.7.2.4 Market size and forecast, by Authentication
9.4.7.2.5 Market size and forecast, by Industry Vertical
9.4.7.3 Japan
9.4.7.3.1 Market size and forecast, by Component
9.4.7.3.2 Market size and forecast, by Deployment Model
9.4.7.3.3 Market size and forecast, by Enterprise Size
9.4.7.3.4 Market size and forecast, by Authentication
9.4.7.3.5 Market size and forecast, by Industry Vertical
9.4.7.4 Australia
9.4.7.4.1 Market size and forecast, by Component
9.4.7.4.2 Market size and forecast, by Deployment Model
9.4.7.4.3 Market size and forecast, by Enterprise Size
9.4.7.4.4 Market size and forecast, by Authentication
9.4.7.4.5 Market size and forecast, by Industry Vertical
9.4.7.5 South Korea
9.4.7.5.1 Market size and forecast, by Component
9.4.7.5.2 Market size and forecast, by Deployment Model
9.4.7.5.3 Market size and forecast, by Enterprise Size
9.4.7.5.4 Market size and forecast, by Authentication
9.4.7.5.5 Market size and forecast, by Industry Vertical
9.4.7.6 Rest of Asia-Pacific
9.4.7.6.1 Market size and forecast, by Component
9.4.7.6.2 Market size and forecast, by Deployment Model
9.4.7.6.3 Market size and forecast, by Enterprise Size
9.4.7.6.4 Market size and forecast, by Authentication
9.4.7.6.5 Market size and forecast, by Industry Vertical
9.5 LAMEA
9.5.1 Key trends and opportunities
9.5.2 LAMEA Market size and forecast, by Component
9.5.3 LAMEA Market size and forecast, by Deployment Model
9.5.4 LAMEA Market size and forecast, by Enterprise Size
9.5.5 LAMEA Market size and forecast, by Authentication
9.5.6 LAMEA Market size and forecast, by Industry Vertical
9.5.7 LAMEA Market size and forecast, by country
9.5.7.1 Latin America
9.5.7.1.1 Market size and forecast, by Component
9.5.7.1.2 Market size and forecast, by Deployment Model
9.5.7.1.3 Market size and forecast, by Enterprise Size
9.5.7.1.4 Market size and forecast, by Authentication
9.5.7.1.5 Market size and forecast, by Industry Vertical
9.5.7.2 Middle East
9.5.7.2.1 Market size and forecast, by Component
9.5.7.2.2 Market size and forecast, by Deployment Model
9.5.7.2.3 Market size and forecast, by Enterprise Size
9.5.7.2.4 Market size and forecast, by Authentication
9.5.7.2.5 Market size and forecast, by Industry Vertical
9.5.7.3 Africa
9.5.7.3.1 Market size and forecast, by Component
9.5.7.3.2 Market size and forecast, by Deployment Model
9.5.7.3.3 Market size and forecast, by Enterprise Size
9.5.7.3.4 Market size and forecast, by Authentication
9.5.7.3.5 Market size and forecast, by Industry Vertical
CHAPTER 10: COMPANY LANDSCAPE
10.1. Introduction
10.2. Top winning strategies
10.3. Product Mapping of Top 10 Player
10.4. Competitive Dashboard
10.5. Competitive Heatmap
10.6. Key developments
CHAPTER 11: COMPANY PROFILES
11.1 Cisco Systems Inc.
11.1.1 Company overview
11.1.2 Company snapshot
11.1.3 Operating business segments
11.1.4 Product portfolio
11.1.5 Business performance
11.1.6 Key strategic moves and developments
11.2 IBM
11.2.1 Company overview
11.2.2 Company snapshot
11.2.3 Operating business segments
11.2.4 Product portfolio
11.2.5 Business performance
11.2.6 Key strategic moves and developments
11.3 Akamai Technologies Inc.
11.3.1 Company overview
11.3.2 Company snapshot
11.3.3 Operating business segments
11.3.4 Product portfolio
11.3.5 Business performance
11.3.6 Key strategic moves and developments
11.4 Zscaler
11.4.1 Company overview
11.4.2 Company snapshot
11.4.3 Operating business segments
11.4.4 Product portfolio
11.4.5 Business performance
11.4.6 Key strategic moves and developments
11.5 VMware, Inc.
11.5.1 Company overview
11.5.2 Company snapshot
11.5.3 Operating business segments
11.5.4 Product portfolio
11.5.5 Business performance
11.5.6 Key strategic moves and developments
11.6 Microsoft Corporation
11.6.1 Company overview
11.6.2 Company snapshot
11.6.3 Operating business segments
11.6.4 Product portfolio
11.6.5 Business performance
11.6.6 Key strategic moves and developments
11.7 Cloudflare
11.7.1 Company overview
11.7.2 Company snapshot
11.7.3 Operating business segments
11.7.4 Product portfolio
11.7.5 Business performance
11.7.6 Key strategic moves and developments
11.8 Google
11.8.1 Company overview
11.8.2 Company snapshot
11.8.3 Operating business segments
11.8.4 Product portfolio
11.8.5 Business performance
11.8.6 Key strategic moves and developments
11.9 Cyxtera Technologies
11.9.1 Company overview
11.9.2 Company snapshot
11.9.3 Operating business segments
11.9.4 Product portfolio
11.9.5 Business performance
11.9.6 Key strategic moves and developments
11.10 SonicWall
11.10.1 Company overview
11.10.2 Company snapshot
11.10.3 Operating business segments
11.10.4 Product portfolio
11.10.5 Business performance
11.10.6 Key strategic moves and developments
11.11 Palo Alto Networks
11.11.1 Company overview
11.11.2 Company snapshot
11.11.3 Operating business segments
11.11.4 Product portfolio
11.11.5 Business performance
11.11.6 Key strategic moves and developments
11.12 Check Point Software Technologies
11.12.1 Company overview
11.12.2 Company snapshot
11.12.3 Operating business segments
11.12.4 Product portfolio
11.12.5 Business performance
11.12.6 Key strategic moves and developments
11.13 Trend Micro, Inc.
11.13.1 Company overview
11.13.2 Company snapshot
11.13.3 Operating business segments
11.13.4 Product portfolio
11.13.5 Business performance
11.13.6 Key strategic moves and developments
11.14 Symantec Corp.
11.14.1 Company overview
11.14.2 Company snapshot
11.14.3 Operating business segments
11.14.4 Product portfolio
11.14.5 Business performance
11.14.6 Key strategic moves and developments
11.15 FireEye, Inc.
11.15.1 Company overview
11.15.2 Company snapshot
11.15.3 Operating business segments
11.15.4 Product portfolio
11.15.5 Business performance
11.15.6 Key strategic moves and developments
11.16 McAfee Corp.
11.16.1 Company overview
11.16.2 Company snapshot
11.16.3 Operating business segments
11.16.4 Product portfolio
11.16.5 Business performance
11.16.6 Key strategic moves and developments
LIST OF TABLES
TABLE 1. GLOBAL ZERO TRUST SECURITY MARKET, BY COMPONENT, 2021-2031 ($BILLION)
TABLE 2. ZERO TRUST SECURITY MARKET SIZE, FOR SOLUTION, BY REGION, 2021-2031 ($BILLION)
TABLE 3. ZERO TRUST SECURITY MARKET FOR SOLUTION BY COUNTRY, 2021-2031 ($BILLION)
TABLE 4. ZERO TRUST SECURITY MARKET SIZE, FOR SERVICES, BY REGION, 2021-2031 ($BILLION)
TABLE 5. ZERO TRUST SECURITY MARKET FOR SERVICES BY COUNTRY, 2021-2031 ($BILLION)
TABLE 6. GLOBAL ZERO TRUST SECURITY MARKET, BY DEPLOYMENT MODEL, 2021-2031 ($BILLION)
TABLE 7. ZERO TRUST SECURITY MARKET SIZE, FOR ON-PREMISE, BY REGION, 2021-2031 ($BILLION)
TABLE 8. ZERO TRUST SECURITY MARKET FOR ON-PREMISE BY COUNTRY, 2021-2031 ($BILLION)
TABLE 9. ZERO TRUST SECURITY MARKET SIZE, FOR CLOUD, BY REGION, 2021-2031 ($BILLION)
TABLE 10. ZERO TRUST SECURITY MARKET FOR CLOUD BY COUNTRY, 2021-2031 ($BILLION)
TABLE 11. GLOBAL ZERO TRUST SECURITY MARKET, BY ENTERPRISE SIZE, 2021-2031 ($BILLION)
TABLE 12. ZERO TRUST SECURITY MARKET SIZE, FOR LARGE ENTERPRISES, BY REGION, 2021-2031 ($BILLION)
TABLE 13. ZERO TRUST SECURITY MARKET FOR LARGE ENTERPRISES BY COUNTRY, 2021-2031 ($BILLION)
TABLE 14. ZERO TRUST SECURITY MARKET SIZE, FOR SMES, BY REGION, 2021-2031 ($BILLION)
TABLE 15. ZERO TRUST SECURITY MARKET FOR SMES BY COUNTRY, 2021-2031 ($BILLION)
TABLE 16. GLOBAL ZERO TRUST SECURITY MARKET, BY AUTHENTICATION, 2021-2031 ($BILLION)
TABLE 17. ZERO TRUST SECURITY MARKET SIZE, FOR SINGLE-FACTOR AUTHENTICATION, BY REGION, 2021-2031 ($BILLION)
TABLE 18. ZERO TRUST SECURITY MARKET FOR SINGLE-FACTOR AUTHENTICATION BY COUNTRY, 2021-2031 ($BILLION)
TABLE 19. ZERO TRUST SECURITY MARKET SIZE, FOR MULTI-FACTOR AUTHENTICATION, BY REGION, 2021-2031 ($BILLION)
TABLE 20. ZERO TRUST SECURITY MARKET FOR MULTI-FACTOR AUTHENTICATION BY COUNTRY, 2021-2031 ($BILLION)
TABLE 21. GLOBAL ZERO TRUST SECURITY MARKET, BY INDUSTRY VERTICAL, 2021-2031 ($BILLION)
TABLE 22. ZERO TRUST SECURITY MARKET SIZE, FOR BFSI, BY REGION, 2021-2031 ($BILLION)
TABLE 23. ZERO TRUST SECURITY MARKET FOR BFSI BY COUNTRY, 2021-2031 ($BILLION)
TABLE 24. ZERO TRUST SECURITY MARKET SIZE, FOR GOVERNMENT, BY REGION, 2021-2031 ($BILLION)
TABLE 25. ZERO TRUST SECURITY MARKET FOR GOVERNMENT BY COUNTRY, 2021-2031 ($BILLION)
TABLE 26. ZERO TRUST SECURITY MARKET SIZE, FOR IT AND TELECOM, BY REGION, 2021-2031 ($BILLION)
TABLE 27. ZERO TRUST SECURITY MARKET FOR IT AND TELECOM BY COUNTRY, 2021-2031 ($BILLION)
TABLE 28. ZERO TRUST SECURITY MARKET SIZE, FOR MANUFACTURING, BY REGION, 2021-2031 ($BILLION)
TABLE 29. ZERO TRUST SECURITY MARKET FOR MANUFACTURING BY COUNTRY, 2021-2031 ($BILLION)
TABLE 30. ZERO TRUST SECURITY MARKET SIZE, FOR HEALTHCARE, BY REGION, 2021-2031 ($BILLION)
TABLE 31. ZERO TRUST SECURITY MARKET FOR HEALTHCARE BY COUNTRY, 2021-2031 ($BILLION)
TABLE 32. ZERO TRUST SECURITY MARKET SIZE, FOR RETAIL, BY REGION, 2021-2031 ($BILLION)
TABLE 33. ZERO TRUST SECURITY MARKET FOR RETAIL BY COUNTRY, 2021-2031 ($BILLION)
TABLE 34. ZERO TRUST SECURITY MARKET SIZE, FOR ENERGY AND UTILITIES, BY REGION, 2021-2031 ($BILLION)
TABLE 35. ZERO TRUST SECURITY MARKET FOR ENERGY AND UTILITIES BY COUNTRY, 2021-2031 ($BILLION)
TABLE 36. ZERO TRUST SECURITY MARKET SIZE, FOR OTHERS, BY REGION, 2021-2031 ($BILLION)
TABLE 37. ZERO TRUST SECURITY MARKET FOR OTHERS BY COUNTRY, 2021-2031 ($BILLION)
TABLE 38. ZERO TRUST SECURITY MARKET, BY REGION, 2021-2031 ($BILLION)
TABLE 39. NORTH AMERICA ZERO TRUST SECURITY MARKET, BY COMPONENT, 2021-2031 ($BILLION)
TABLE 40. NORTH AMERICA ZERO TRUST SECURITY MARKET, BY DEPLOYMENT MODEL, 2021-2031 ($BILLION)
TABLE 41. NORTH AMERICA ZERO TRUST SECURITY MARKET, BY ENTERPRISE SIZE, 2021-2031 ($BILLION)
TABLE 42. NORTH AMERICA ZERO TRUST SECURITY MARKET, BY AUTHENTICATION, 2021-2031 ($BILLION)
TABLE 43. NORTH AMERICA ZERO TRUST SECURITY MARKET, BY INDUSTRY VERTICAL, 2021-2031 ($BILLION)
TABLE 44. NORTH AMERICA ZERO TRUST SECURITY MARKET, BY COUNTRY, 2021-2031 ($BILLION)
TABLE 45. U.S. ZERO TRUST SECURITY MARKET, BY COMPONENT, 2021-2031 ($BILLION)
TABLE 46. U.S. ZERO TRUST SECURITY MARKET, BY DEPLOYMENT MODEL, 2021-2031 ($BILLION)
TABLE 47. U.S. ZERO TRUST SECURITY MARKET, BY ENTERPRISE SIZE, 2021-2031 ($BILLION)
TABLE 48. U.S. ZERO TRUST SECURITY MARKET, BY AUTHENTICATION, 2021-2031 ($BILLION)
TABLE 49. U.S. ZERO TRUST SECURITY MARKET, BY INDUSTRY VERTICAL, 2021-2031 ($BILLION)
TABLE 50. CANADA ZERO TRUST SECURITY MARKET, BY COMPONENT, 2021-2031 ($BILLION)
TABLE 51. CANADA ZERO TRUST SECURITY MARKET, BY DEPLOYMENT MODEL, 2021-2031 ($BILLION)
TABLE 52. CANADA ZERO TRUST SECURITY MARKET, BY ENTERPRISE SIZE, 2021-2031 ($BILLION)
TABLE 53. CANADA ZERO TRUST SECURITY MARKET, BY AUTHENTICATION, 2021-2031 ($BILLION)
TABLE 54. CANADA ZERO TRUST SECURITY MARKET, BY INDUSTRY VERTICAL, 2021-2031 ($BILLION)
TABLE 55. EUROPE ZERO TRUST SECURITY MARKET, BY COMPONENT, 2021-2031 ($BILLION)
TABLE 56. EUROPE ZERO TRUST SECURITY MARKET, BY DEPLOYMENT MODEL, 2021-2031 ($BILLION)
TABLE 57. EUROPE ZERO TRUST SECURITY MARKET, BY ENTERPRISE SIZE, 2021-2031 ($BILLION)
TABLE 58. EUROPE ZERO TRUST SECURITY MARKET, BY AUTHENTICATION, 2021-2031 ($BILLION)
TABLE 59. EUROPE ZERO TRUST SECURITY MARKET, BY INDUSTRY VERTICAL, 2021-2031 ($BILLION)
TABLE 60. EUROPE ZERO TRUST SECURITY MARKET, BY COUNTRY, 2021-2031 ($BILLION)
TABLE 61. U.K. ZERO TRUST SECURITY MARKET, BY COMPONENT, 2021-2031 ($BILLION)
TABLE 62. U.K. ZERO TRUST SECURITY MARKET, BY DEPLOYMENT MODEL, 2021-2031 ($BILLION)
TABLE 63. U.K. ZERO TRUST SECURITY MARKET, BY ENTERPRISE SIZE, 2021-2031 ($BILLION)
TABLE 64. U.K. ZERO TRUST SECURITY MARKET, BY AUTHENTICATION, 2021-2031 ($BILLION)
TABLE 65. U.K. ZERO TRUST SECURITY MARKET, BY INDUSTRY VERTICAL, 2021-2031 ($BILLION)
TABLE 66. GERMANY ZERO TRUST SECURITY MARKET, BY COMPONENT, 2021-2031 ($BILLION)
TABLE 67. GERMANY ZERO TRUST SECURITY MARKET, BY DEPLOYMENT MODEL, 2021-2031 ($BILLION)
TABLE 68. GERMANY ZERO TRUST SECURITY MARKET, BY ENTERPRISE SIZE, 2021-2031 ($BILLION)
TABLE 69. GERMANY ZERO TRUST SECURITY MARKET, BY AUTHENTICATION, 2021-2031 ($BILLION)
TABLE 70. GERMANY ZERO TRUST SECURITY MARKET, BY INDUSTRY VERTICAL, 2021-2031 ($BILLION)
TABLE 71. FRANCE ZERO TRUST SECURITY MARKET, BY COMPONENT, 2021-2031 ($BILLION)
TABLE 72. FRANCE ZERO TRUST SECURITY MARKET, BY DEPLOYMENT MODEL, 2021-2031 ($BILLION)
TABLE 73. FRANCE ZERO TRUST SECURITY MARKET, BY ENTERPRISE SIZE, 2021-2031 ($BILLION)
TABLE 74. FRANCE ZERO TRUST SECURITY MARKET, BY AUTHENTICATION, 2021-2031 ($BILLION)
TABLE 75. FRANCE ZERO TRUST SECURITY MARKET, BY INDUSTRY VERTICAL, 2021-2031 ($BILLION)
TABLE 76. SPAIN ZERO TRUST SECURITY MARKET, BY COMPONENT, 2021-2031 ($BILLION)
TABLE 77. SPAIN ZERO TRUST SECURITY MARKET, BY DEPLOYMENT MODEL, 2021-2031 ($BILLION)
TABLE 78. SPAIN ZERO TRUST SECURITY MARKET, BY ENTERPRISE SIZE, 2021-2031 ($BILLION)
TABLE 79. SPAIN ZERO TRUST SECURITY MARKET, BY AUTHENTICATION, 2021-2031 ($BILLION)
TABLE 80. SPAIN ZERO TRUST SECURITY MARKET, BY INDUSTRY VERTICAL, 2021-2031 ($BILLION)
TABLE 81. NETHERLANDS ZERO TRUST SECURITY MARKET, BY COMPONENT, 2021-2031 ($BILLION)
TABLE 82. NETHERLANDS ZERO TRUST SECURITY MARKET, BY DEPLOYMENT MODEL, 2021-2031 ($BILLION)
TABLE 83. NETHERLANDS ZERO TRUST SECURITY MARKET, BY ENTERPRISE SIZE, 2021-2031 ($BILLION)
TABLE 84. NETHERLANDS ZERO TRUST SECURITY MARKET, BY AUTHENTICATION, 2021-2031 ($BILLION)
TABLE 85. NETHERLANDS ZERO TRUST SECURITY MARKET, BY INDUSTRY VERTICAL, 2021-2031 ($BILLION)
TABLE 86. REST OF EUROPE ZERO TRUST SECURITY MARKET, BY COMPONENT, 2021-2031 ($BILLION)
TABLE 87. REST OF EUROPE ZERO TRUST SECURITY MARKET, BY DEPLOYMENT MODEL, 2021-2031 ($BILLION)
TABLE 88. REST OF EUROPE ZERO TRUST SECURITY MARKET, BY ENTERPRISE SIZE, 2021-2031 ($BILLION)
TABLE 89. REST OF EUROPE ZERO TRUST SECURITY MARKET, BY AUTHENTICATION, 2021-2031 ($BILLION)
TABLE 90. REST OF EUROPE ZERO TRUST SECURITY MARKET, BY INDUSTRY VERTICAL, 2021-2031 ($BILLION)
TABLE 91. ASIA-PACIFIC ZERO TRUST SECURITY MARKET, BY COMPONENT, 2021-2031 ($BILLION)
TABLE 92. ASIA-PACIFIC ZERO TRUST SECURITY MARKET, BY DEPLOYMENT MODEL, 2021-2031 ($BILLION)
TABLE 93. ASIA-PACIFIC ZERO TRUST SECURITY MARKET, BY ENTERPRISE SIZE, 2021-2031 ($BILLION)
TABLE 94. ASIA-PACIFIC ZERO TRUST SECURITY MARKET, BY AUTHENTICATION, 2021-2031 ($BILLION)
TABLE 95. ASIA-PACIFIC ZERO TRUST SECURITY MARKET, BY INDUSTRY VERTICAL, 2021-2031 ($BILLION)
TABLE 96. ASIA-PACIFIC ZERO TRUST SECURITY MARKET, BY COUNTRY, 2021-2031 ($BILLION)
TABLE 97. CHINA ZERO TRUST SECURITY MARKET, BY COMPONENT, 2021-2031 ($BILLION)
TABLE 98. CHINA ZERO TRUST SECURITY MARKET, BY DEPLOYMENT MODEL, 2021-2031 ($BILLION)
TABLE 99. CHINA ZERO TRUST SECURITY MARKET, BY ENTERPRISE SIZE, 2021-2031 ($BILLION)
TABLE 100. CHINA ZERO TRUST SECURITY MARKET, BY AUTHENTICATION, 2021-2031 ($BILLION)
TABLE 101. CHINA ZERO TRUST SECURITY MARKET, BY INDUSTRY VERTICAL, 2021-2031 ($BILLION)
TABLE 102. INDIA ZERO TRUST SECURITY MARKET, BY COMPONENT, 2021-2031 ($BILLION)
TABLE 103. INDIA ZERO TRUST SECURITY MARKET, BY DEPLOYMENT MODEL, 2021-2031 ($BILLION)
TABLE 104. INDIA ZERO TRUST SECURITY MARKET, BY ENTERPRISE SIZE, 2021-2031 ($BILLION)
TABLE 105. INDIA ZERO TRUST SECURITY MARKET, BY AUTHENTICATION, 2021-2031 ($BILLION)
TABLE 106. INDIA ZERO TRUST SECURITY MARKET, BY INDUSTRY VERTICAL, 2021-2031 ($BILLION)
TABLE 107. JAPAN ZERO TRUST SECURITY MARKET, BY COMPONENT, 2021-2031 ($BILLION)
TABLE 108. JAPAN ZERO TRUST SECURITY MARKET, BY DEPLOYMENT MODEL, 2021-2031 ($BILLION)
TABLE 109. JAPAN ZERO TRUST SECURITY MARKET, BY ENTERPRISE SIZE, 2021-2031 ($BILLION)
TABLE 110. JAPAN ZERO TRUST SECURITY MARKET, BY AUTHENTICATION, 2021-2031 ($BILLION)
TABLE 111. JAPAN ZERO TRUST SECURITY MARKET, BY INDUSTRY VERTICAL, 2021-2031 ($BILLION)
TABLE 112. AUSTRALIA ZERO TRUST SECURITY MARKET, BY COMPONENT, 2021-2031 ($BILLION)
TABLE 113. AUSTRALIA ZERO TRUST SECURITY MARKET, BY DEPLOYMENT MODEL, 2021-2031 ($BILLION)
TABLE 114. AUSTRALIA ZERO TRUST SECURITY MARKET, BY ENTERPRISE SIZE, 2021-2031 ($BILLION)
TABLE 115. AUSTRALIA ZERO TRUST SECURITY MARKET, BY AUTHENTICATION, 2021-2031 ($BILLION)
TABLE 116. AUSTRALIA ZERO TRUST SECURITY MARKET, BY INDUSTRY VERTICAL, 2021-2031 ($BILLION)
TABLE 117. SOUTH KOREA ZERO TRUST SECURITY MARKET, BY COMPONENT, 2021-2031 ($BILLION)
TABLE 118. SOUTH KOREA ZERO TRUST SECURITY MARKET, BY DEPLOYMENT MODEL, 2021-2031 ($BILLION)
TABLE 119. SOUTH KOREA ZERO TRUST SECURITY MARKET, BY ENTERPRISE SIZE, 2021-2031 ($BILLION)
TABLE 120. SOUTH KOREA ZERO TRUST SECURITY MARKET, BY AUTHENTICATION, 2021-2031 ($BILLION)
TABLE 121. SOUTH KOREA ZERO TRUST SECURITY MARKET, BY INDUSTRY VERTICAL, 2021-2031 ($BILLION)
TABLE 122. REST OF ASIA-PACIFIC ZERO TRUST SECURITY MARKET, BY COMPONENT, 2021-2031 ($BILLION)
TABLE 123. REST OF ASIA-PACIFIC ZERO TRUST SECURITY MARKET, BY DEPLOYMENT MODEL, 2021-2031 ($BILLION)
TABLE 124. REST OF ASIA-PACIFIC ZERO TRUST SECURITY MARKET, BY ENTERPRISE SIZE, 2021-2031 ($BILLION)
TABLE 125. REST OF ASIA-PACIFIC ZERO TRUST SECURITY MARKET, BY AUTHENTICATION, 2021-2031 ($BILLION)
TABLE 126. REST OF ASIA-PACIFIC ZERO TRUST SECURITY MARKET, BY INDUSTRY VERTICAL, 2021-2031 ($BILLION)
TABLE 127. LAMEA ZERO TRUST SECURITY MARKET, BY COMPONENT, 2021-2031 ($BILLION)
TABLE 128. LAMEA ZERO TRUST SECURITY MARKET, BY DEPLOYMENT MODEL, 2021-2031 ($BILLION)
TABLE 129. LAMEA ZERO TRUST SECURITY MARKET, BY ENTERPRISE SIZE, 2021-2031 ($BILLION)
TABLE 130. LAMEA ZERO TRUST SECURITY MARKET, BY AUTHENTICATION, 2021-2031 ($BILLION)
TABLE 131. LAMEA ZERO TRUST SECURITY MARKET, BY INDUSTRY VERTICAL, 2021-2031 ($BILLION)
TABLE 132. LAMEA ZERO TRUST SECURITY MARKET, BY COUNTRY, 2021-2031 ($BILLION)
TABLE 133. LATIN AMERICA ZERO TRUST SECURITY MARKET, BY COMPONENT, 2021-2031 ($BILLION)
TABLE 134. LATIN AMERICA ZERO TRUST SECURITY MARKET, BY DEPLOYMENT MODEL, 2021-2031 ($BILLION)
TABLE 135. LATIN AMERICA ZERO TRUST SECURITY MARKET, BY ENTERPRISE SIZE, 2021-2031 ($BILLION)
TABLE 136. LATIN AMERICA ZERO TRUST SECURITY MARKET, BY AUTHENTICATION, 2021-2031 ($BILLION)
TABLE 137. LATIN AMERICA ZERO TRUST SECURITY MARKET, BY INDUSTRY VERTICAL, 2021-2031 ($BILLION)
TABLE 138. MIDDLE EAST ZERO TRUST SECURITY MARKET, BY COMPONENT, 2021-2031 ($BILLION)
TABLE 139. MIDDLE EAST ZERO TRUST SECURITY MARKET, BY DEPLOYMENT MODEL, 2021-2031 ($BILLION)
TABLE 140. MIDDLE EAST ZERO TRUST SECURITY MARKET, BY ENTERPRISE SIZE, 2021-2031 ($BILLION)
TABLE 141. MIDDLE EAST ZERO TRUST SECURITY MARKET, BY AUTHENTICATION, 2021-2031 ($BILLION)
TABLE 142. MIDDLE EAST ZERO TRUST SECURITY MARKET, BY INDUSTRY VERTICAL, 2021-2031 ($BILLION)
TABLE 143. AFRICA ZERO TRUST SECURITY MARKET, BY COMPONENT, 2021-2031 ($BILLION)
TABLE 144. AFRICA ZERO TRUST SECURITY MARKET, BY DEPLOYMENT MODEL, 2021-2031 ($BILLION)
TABLE 145. AFRICA ZERO TRUST SECURITY MARKET, BY ENTERPRISE SIZE, 2021-2031 ($BILLION)
TABLE 146. AFRICA ZERO TRUST SECURITY MARKET, BY AUTHENTICATION, 2021-2031 ($BILLION)
TABLE 147. AFRICA ZERO TRUST SECURITY MARKET, BY INDUSTRY VERTICAL, 2021-2031 ($BILLION)
TABLE 148.CISCO SYSTEMS INC.: COMPANY SNAPSHOT
TABLE 149.CISCO SYSTEMS INC.: OPERATING SEGMENTS
TABLE 150.CISCO SYSTEMS INC.: PRODUCT PORTFOLIO
TABLE 151.CISCO SYSTEMS INC.: NET SALES,
TABLE 152.CISCO SYSTEMS INC.: KEY STRATERGIES
TABLE 153.IBM: COMPANY SNAPSHOT
TABLE 154.IBM: OPERATING SEGMENTS
TABLE 155.IBM: PRODUCT PORTFOLIO
TABLE 156.IBM: NET SALES,
TABLE 157.IBM: KEY STRATERGIES
TABLE 158.AKAMAI TECHNOLOGIES INC.: COMPANY SNAPSHOT
TABLE 159.AKAMAI TECHNOLOGIES INC.: OPERATING SEGMENTS
TABLE 160.AKAMAI TECHNOLOGIES INC.: PRODUCT PORTFOLIO
TABLE 161.AKAMAI TECHNOLOGIES INC.: NET SALES,
TABLE 162.AKAMAI TECHNOLOGIES INC.: KEY STRATERGIES
TABLE 163.ZSCALER: COMPANY SNAPSHOT
TABLE 164.ZSCALER: OPERATING SEGMENTS
TABLE 165.ZSCALER: PRODUCT PORTFOLIO
TABLE 166.ZSCALER: NET SALES,
TABLE 167.ZSCALER: KEY STRATERGIES
TABLE 168.VMWARE, INC.: COMPANY SNAPSHOT
TABLE 169.VMWARE, INC.: OPERATING SEGMENTS
TABLE 170.VMWARE, INC.: PRODUCT PORTFOLIO
TABLE 171.VMWARE, INC.: NET SALES,
TABLE 172.VMWARE, INC.: KEY STRATERGIES
TABLE 173.MICROSOFT CORPORATION: COMPANY SNAPSHOT
TABLE 174.MICROSOFT CORPORATION: OPERATING SEGMENTS
TABLE 175.MICROSOFT CORPORATION: PRODUCT PORTFOLIO
TABLE 176.MICROSOFT CORPORATION: NET SALES,
TABLE 177.MICROSOFT CORPORATION: KEY STRATERGIES
TABLE 178.CLOUDFLARE: COMPANY SNAPSHOT
TABLE 179.CLOUDFLARE: OPERATING SEGMENTS
TABLE 180.CLOUDFLARE: PRODUCT PORTFOLIO
TABLE 181.CLOUDFLARE: NET SALES,
TABLE 182.CLOUDFLARE: KEY STRATERGIES
TABLE 183.GOOGLE: COMPANY SNAPSHOT
TABLE 184.GOOGLE: OPERATING SEGMENTS
TABLE 185.GOOGLE: PRODUCT PORTFOLIO
TABLE 186.GOOGLE: NET SALES,
TABLE 187.GOOGLE: KEY STRATERGIES
TABLE 188.CYXTERA TECHNOLOGIES: COMPANY SNAPSHOT
TABLE 189.CYXTERA TECHNOLOGIES: OPERATING SEGMENTS
TABLE 190.CYXTERA TECHNOLOGIES: PRODUCT PORTFOLIO
TABLE 191.CYXTERA TECHNOLOGIES: NET SALES,
TABLE 192.CYXTERA TECHNOLOGIES: KEY STRATERGIES
TABLE 193.SONICWALL: COMPANY SNAPSHOT
TABLE 194.SONICWALL: OPERATING SEGMENTS
TABLE 195.SONICWALL: PRODUCT PORTFOLIO
TABLE 196.SONICWALL: NET SALES,
TABLE 197.SONICWALL: KEY STRATERGIES
TABLE 198.PALO ALTO NETWORKS: COMPANY SNAPSHOT
TABLE 199.PALO ALTO NETWORKS: OPERATING SEGMENTS
TABLE 200.PALO ALTO NETWORKS: PRODUCT PORTFOLIO
TABLE 201.PALO ALTO NETWORKS: NET SALES,
TABLE 202.PALO ALTO NETWORKS: KEY STRATERGIES
TABLE 203.CHECK POINT SOFTWARE TECHNOLOGIES: COMPANY SNAPSHOT
TABLE 204.CHECK POINT SOFTWARE TECHNOLOGIES: OPERATING SEGMENTS
TABLE 205.CHECK POINT SOFTWARE TECHNOLOGIES: PRODUCT PORTFOLIO
TABLE 206.CHECK POINT SOFTWARE TECHNOLOGIES: NET SALES,
TABLE 207.CHECK POINT SOFTWARE TECHNOLOGIES: KEY STRATERGIES
TABLE 208.TREND MICRO, INC.: COMPANY SNAPSHOT
TABLE 209.TREND MICRO, INC.: OPERATING SEGMENTS
TABLE 210.TREND MICRO, INC.: PRODUCT PORTFOLIO
TABLE 211.TREND MICRO, INC.: NET SALES,
TABLE 212.TREND MICRO, INC.: KEY STRATERGIES
TABLE 213.SYMANTEC CORP.: COMPANY SNAPSHOT
TABLE 214.SYMANTEC CORP.: OPERATING SEGMENTS
TABLE 215.SYMANTEC CORP.: PRODUCT PORTFOLIO
TABLE 216.SYMANTEC CORP.: NET SALES,
TABLE 217.SYMANTEC CORP.: KEY STRATERGIES
TABLE 218.FIREEYE, INC.: COMPANY SNAPSHOT
TABLE 219.FIREEYE, INC.: OPERATING SEGMENTS
TABLE 220.FIREEYE, INC.: PRODUCT PORTFOLIO
TABLE 221.FIREEYE, INC.: NET SALES,
TABLE 222.FIREEYE, INC.: KEY STRATERGIES
TABLE 223.MCAFEE CORP.: COMPANY SNAPSHOT
TABLE 224.MCAFEE CORP.: OPERATING SEGMENTS
TABLE 225.MCAFEE CORP.: PRODUCT PORTFOLIO
TABLE 226.MCAFEE CORP.: NET SALES,
TABLE 227.MCAFEE CORP.: KEY STRATERGIES
LIST OF FIGURES
FIGURE 1.ZERO TRUST SECURITY MARKET SEGMENTATION
FIGURE 2.ZERO TRUST SECURITY MARKET,2021-2031
FIGURE 3.ZERO TRUST SECURITY MARKET,2021-2031
FIGURE 4. TOP INVESTMENT POCKETS, BY REGION
FIGURE 5.PORTER FIVE-1
FIGURE 6.PORTER FIVE-2
FIGURE 7.PORTER FIVE-3
FIGURE 8.PORTER FIVE-4
FIGURE 9.PORTER FIVE-5
FIGURE 10.TOP PLAYER POSITIONING
FIGURE 11.ZERO TRUST SECURITY MARKET:DRIVERS, RESTRAINTS AND OPPORTUNITIES
FIGURE 12.KEY REGULATION ANALYSIS
FIGURE 13.PATENT ANALYSIS BY COMPANY
FIGURE 14.PATENT ANALYSIS BY COUNTRY
FIGURE 15.ZERO TRUST SECURITY MARKET,BY COMPONENT,2021(%)
FIGURE 16.COMPARATIVE SHARE ANALYSIS OF SOLUTION ZERO TRUST SECURITY MARKET,2021-2031(%)
FIGURE 17.COMPARATIVE SHARE ANALYSIS OF SERVICES ZERO TRUST SECURITY MARKET,2021-2031(%)
FIGURE 18.ZERO TRUST SECURITY MARKET,BY DEPLOYMENT MODEL,2021(%)
FIGURE 19.COMPARATIVE SHARE ANALYSIS OF ON-PREMISE ZERO TRUST SECURITY MARKET,2021-2031(%)
FIGURE 20.COMPARATIVE SHARE ANALYSIS OF CLOUD ZERO TRUST SECURITY MARKET,2021-2031(%)
FIGURE 21.ZERO TRUST SECURITY MARKET,BY ENTERPRISE SIZE,2021(%)
FIGURE 22.COMPARATIVE SHARE ANALYSIS OF LARGE ENTERPRISES ZERO TRUST SECURITY MARKET,2021-2031(%)
FIGURE 23.COMPARATIVE SHARE ANALYSIS OF SMES ZERO TRUST SECURITY MARKET,2021-2031(%)
FIGURE 24.ZERO TRUST SECURITY MARKET,BY AUTHENTICATION,2021(%)
FIGURE 25.COMPARATIVE SHARE ANALYSIS OF SINGLE-FACTOR AUTHENTICATION ZERO TRUST SECURITY MARKET,2021-2031(%)
FIGURE 26.COMPARATIVE SHARE ANALYSIS OF MULTI-FACTOR AUTHENTICATION ZERO TRUST SECURITY MARKET,2021-2031(%)
FIGURE 27.ZERO TRUST SECURITY MARKET,BY INDUSTRY VERTICAL,2021(%)
FIGURE 28.COMPARATIVE SHARE ANALYSIS OF BFSI ZERO TRUST SECURITY MARKET,2021-2031(%)
FIGURE 29.COMPARATIVE SHARE ANALYSIS OF GOVERNMENT ZERO TRUST SECURITY MARKET,2021-2031(%)
FIGURE 30.COMPARATIVE SHARE ANALYSIS OF IT AND TELECOM ZERO TRUST SECURITY MARKET,2021-2031(%)
FIGURE 31.COMPARATIVE SHARE ANALYSIS OF MANUFACTURING ZERO TRUST SECURITY MARKET,2021-2031(%)
FIGURE 32.COMPARATIVE SHARE ANALYSIS OF HEALTHCARE ZERO TRUST SECURITY MARKET,2021-2031(%)
FIGURE 33.COMPARATIVE SHARE ANALYSIS OF RETAIL ZERO TRUST SECURITY MARKET,2021-2031(%)
FIGURE 34.COMPARATIVE SHARE ANALYSIS OF ENERGY AND UTILITIES ZERO TRUST SECURITY MARKET,2021-2031(%)
FIGURE 35.COMPARATIVE SHARE ANALYSIS OF OTHERS ZERO TRUST SECURITY MARKET,2021-2031(%)
FIGURE 36.ZERO TRUST SECURITY MARKET BY REGION,2021
FIGURE 37.U.S. ZERO TRUST SECURITY MARKET,2021-2031($BILLION)
FIGURE 38.CANADA ZERO TRUST SECURITY MARKET,2021-2031($BILLION)
FIGURE 39.U.K. ZERO TRUST SECURITY MARKET,2021-2031($BILLION)
FIGURE 40.GERMANY ZERO TRUST SECURITY MARKET,2021-2031($BILLION)
FIGURE 41.FRANCE ZERO TRUST SECURITY MARKET,2021-2031($BILLION)
FIGURE 42.SPAIN ZERO TRUST SECURITY MARKET,2021-2031($BILLION)
FIGURE 43.NETHERLANDS ZERO TRUST SECURITY MARKET,2021-2031($BILLION)
FIGURE 44.REST OF EUROPE ZERO TRUST SECURITY MARKET,2021-2031($BILLION)
FIGURE 45.CHINA ZERO TRUST SECURITY MARKET,2021-2031($BILLION)
FIGURE 46.INDIA ZERO TRUST SECURITY MARKET,2021-2031($BILLION)
FIGURE 47.JAPAN ZERO TRUST SECURITY MARKET,2021-2031($BILLION)
FIGURE 48.AUSTRALIA ZERO TRUST SECURITY MARKET,2021-2031($BILLION)
FIGURE 49.SOUTH KOREA ZERO TRUST SECURITY MARKET,2021-2031($BILLION)
FIGURE 50.REST OF ASIA-PACIFIC ZERO TRUST SECURITY MARKET,2021-2031($BILLION)
FIGURE 51.LATIN AMERICA ZERO TRUST SECURITY MARKET,2021-2031($BILLION)
FIGURE 52.MIDDLE EAST ZERO TRUST SECURITY MARKET,2021-2031($BILLION)
FIGURE 53.AFRICA ZERO TRUST SECURITY MARKET,2021-2031($BILLION)
FIGURE 54. TOP WINNING STRATEGIES, BY YEAR
FIGURE 55. TOP WINNING STRATEGIES, BY DEVELOPMENT
FIGURE 56. TOP WINNING STRATEGIES, BY COMPANY
FIGURE 57.PRODUCT MAPPING OF TOP 10 PLAYERS
FIGURE 58.COMPETITIVE DASHBOARD
FIGURE 59.COMPETITIVE HEATMAP OF TOP 10 KEY PLAYERS
FIGURE 60.CISCO SYSTEMS INC..: NET SALES ,($BILLION)
FIGURE 61.IBM.: NET SALES ,($BILLION)
FIGURE 62.AKAMAI TECHNOLOGIES INC..: NET SALES ,($BILLION)
FIGURE 63.ZSCALER.: NET SALES ,($BILLION)
FIGURE 64.VMWARE, INC..: NET SALES ,($BILLION)
FIGURE 65.MICROSOFT CORPORATION.: NET SALES ,($BILLION)
FIGURE 66.CLOUDFLARE.: NET SALES ,($BILLION)
FIGURE 67.GOOGLE.: NET SALES ,($BILLION)
FIGURE 68.CYXTERA TECHNOLOGIES.: NET SALES ,($BILLION)
FIGURE 69.SONICWALL.: NET SALES ,($BILLION)
FIGURE 70.PALO ALTO NETWORKS.: NET SALES ,($BILLION)
FIGURE 71.CHECK POINT SOFTWARE TECHNOLOGIES.: NET SALES ,($BILLION)
FIGURE 72.TREND MICRO, INC..: NET SALES ,($BILLION)
FIGURE 73.SYMANTEC CORP..: NET SALES ,($BILLION)
FIGURE 74.FIREEYE, INC..: NET SALES ,($BILLION)
FIGURE 75.MCAFEE CORP..: NET SALES ,($BILLION)
$5730
$6450
$9600
HAVE A QUERY?
OUR CUSTOMER
